How to Identify a Dragonfly Doji
A doji candlestick is formed when security closes at the opening price, suggesting indecision in the market.
However, if a doji appears in a prominent uptrend or downtrend, it could suggest a potential reversal of the trend.
This week we’ll walk you through the dragonfly doji candlestick pattern.
What is a dragonfly doji?
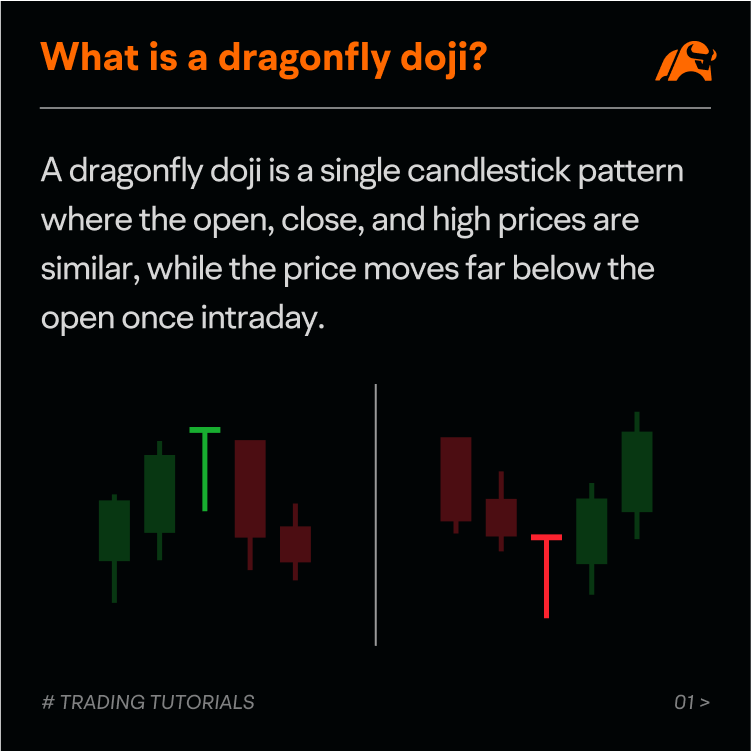
A dragonfly doji is a single candlestick pattern where the open, close, and high prices are similar, while the price moves far below the open at once intraday. Thus, it is T-shaped with a long lower shadow but not a visible upper shadow.
A dragonfly doji can signal a potential reversal in price to the upside or downside, depending on the prior price movement. In other words, a dragonfly doji can either be bullish or bearish.
After an uptrend, a dragonfly doji signals a potential price drop, which might be confirmed if the following candlestick closes below the pattern; and if it appears after a downtrend, a potential price rise might occur if the confirmation candlestick closes above the pattern.
How does a dragonfly doji occur?
A dragonfly doji may appear after a price decline. The long lower shadow of the pattern shows a large amount of selling during a certain period of the session.
As the session nears, however, the price rallies strongly and closes near the opening price, suggesting buyers can absorb the selling and push the price back up.
If the next candlestick closes higher, a bullish dragonfly doji is likely to be confirmed, indicating a potential bullish reversal of the prior trend.
On the other hand, if a dragonfly doji forms after a price advance, it might signal a potential bearish reversal.
The long lower shadow shows that sellers take control for a period of the session. While the price closes almost unchanged, the increase in selling pressure during the session could be a warning sign that the market might move down.
If the next candlestick closes lower, a bearish dragonfly doji is likely to be confirmed, indicating a potential bearish reversal of the prior price action.
How to identify a dragonfly doji?
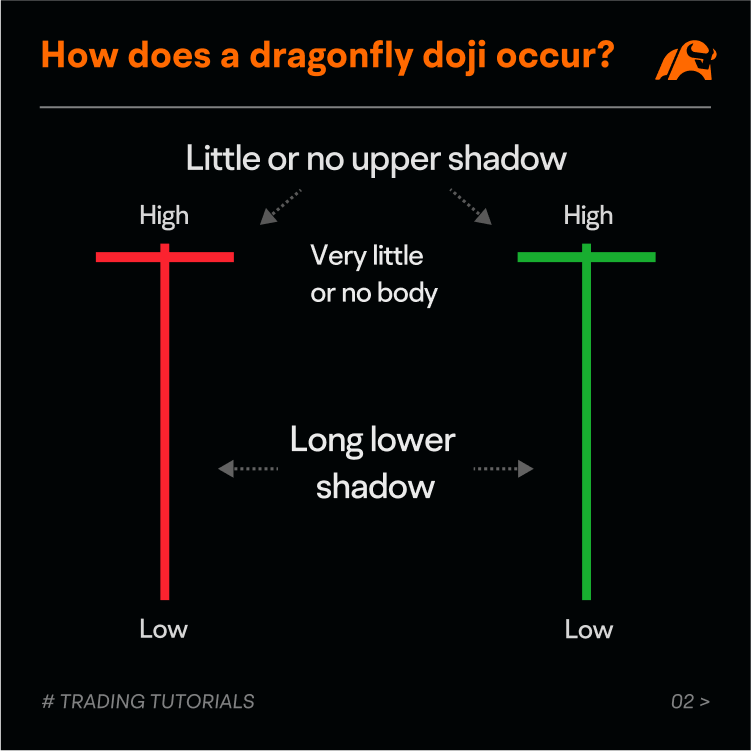
To identify a dragonfly doji, traders might consider the following characteristics.
● Prior trend
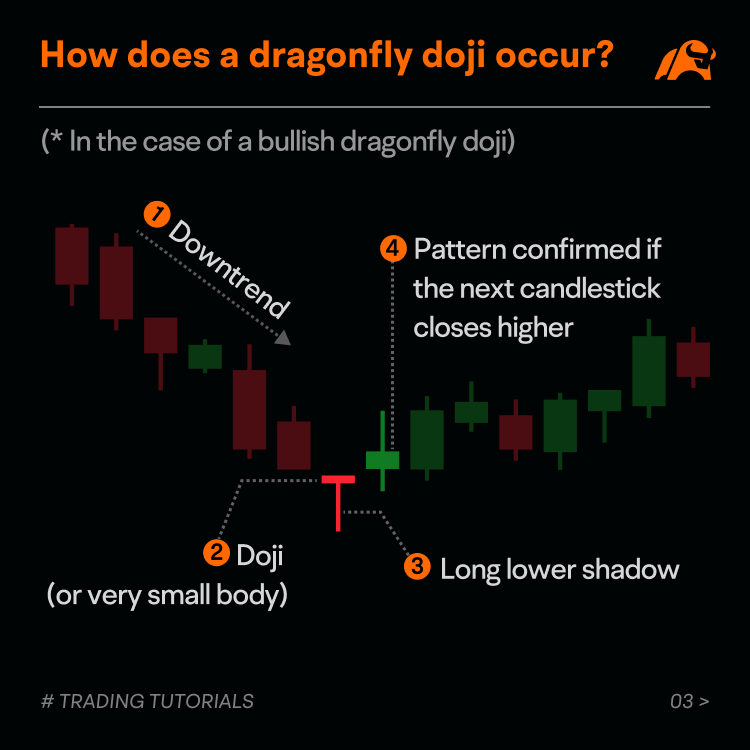
A dragonfly doji typically forms after a prominent uptrend or downtrend. If the pattern occurs in a choppy market, traders might ignore the signal.
● Doji
As a special type of doji candlestick, a dragonfly doji usually does not have a pronounced body on the candlestick.
● Long lower shadow
The candlestick’s lower shadow should be long, indicating a large amount of selling occurred during the session but the price still managed to move back up.
● Confirmation
A bullish dragonfly doji is likely to be confirmed when it appears in a downtrend and is followed by the next candlestick closing above it. Similarly, a bearish dragonfly doji might be confirmed when it forms in an uptrend and is followed by the next candlestick closing below it.
Case Study
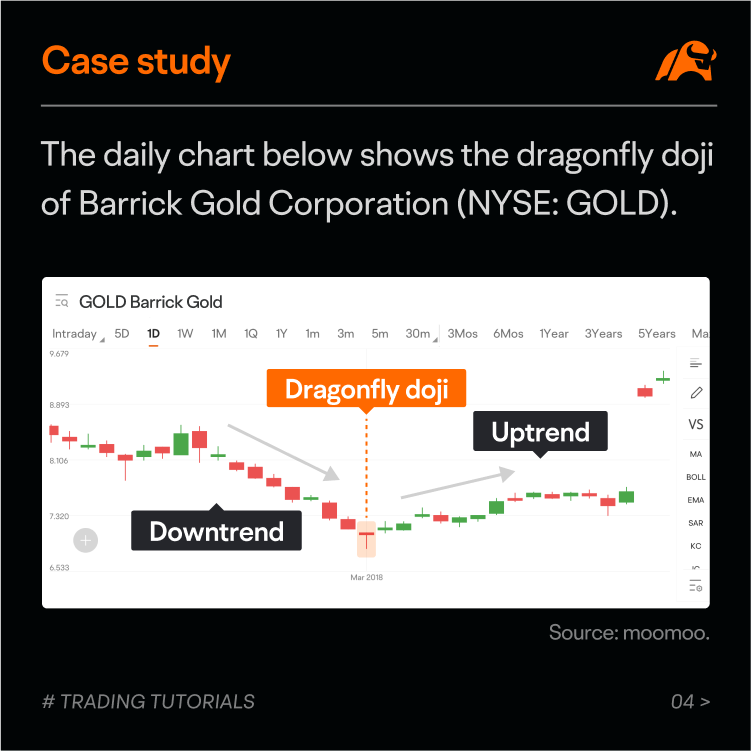
The chart below shows the dragonfly doji of Barrick Gold Corporation (NYSE: GOLD).
The stock was in a downtrend starting in late January 2018.
On March 1, the day the dragonfly doji was formed, the stock opened below the previous closing price at US$7.07.
As the session progressed, selling pressure continued, pushing down the price to a new low of US$6.84.
However, the buyers stepped in and held their ground by the end of the day, making the price close near the day’s open. Thus, a bullish dragonfly doji emerged following the downtrend.
The price moved up the next day, helping to confirm the bullish trading bias.
Summary
The dragonfly doji could be considered a reversal candlestick pattern when it forms during an uptrend or downtrend.
The pattern might help traders to determine a potential entry point for a trade.
When trading candlestick patterns, traders should factor in other technical methods.
This presentation is for informational and educational use only and is not a recommendation or endorsement of any particular investment or investment strategy. Investment information provided in this content is general in nature, strictly for illustrative purposes, and may not be appropriate for all investors. Read more