
Moomoo Insights
Jul 16 15:38
TSMC Earnings: AI Demand Is Stronger Than the Chip Selloff Suggests
Moomoo Insights
Sep 30 05:04
Live Take | Anthropic’s $518B Compute Bet: Who Wins From the AI Buildout?
Professional investors pay close attention to the strength of the US dollar as an important indicator of trends in global markets.
The US dollar is the global reserve currency. Understanding how it strengthens and weakens can help you follow market shifts and find potential investment opportunities.
Takeaways:
The US dollar is the primary global reserve currency, dominating foreign exchange reserves and commodity trading.
The US Dollar Index tracks the dollar's strength against six major currencies and is key for assessing its global value.
The Dollar Index fluctuates based on Federal Reserve policies and global economic events.
If you're in the financial game, you've probably heard the term "Dollar Hegemony" tossed around.
The U.S. dollar, backed by the world's largest economy, has long been the heavyweight champ in the global economic and financial ring. Here's the scoop:
The dollar isn't just pocket change; it's the world's go-to reserve currency. About 60% of the world's foreign reserves are held in dollars. Central banks hold it to keep their currencies and economies steady. Think of it as the financial world's security blanket.
Commodities like crude oil and gold are priced in dollars, and the dollar is also extensively used in global trade settlements.
During economic and political uncertainty, investors often turn to the dollar as a safe haven, increasing its demand during market turmoil.
In the forex market, currencies are like dance partners. You've got the dollar waltzing with the euro (USDEUR), the yen (USDJPY), and so on.
For instance, if the dollar-yen pair moves from 120 to 150, the dollar has strengthened against the yen.
But how do we know how the dollar's doing overall? Enter the US Dollar Index.
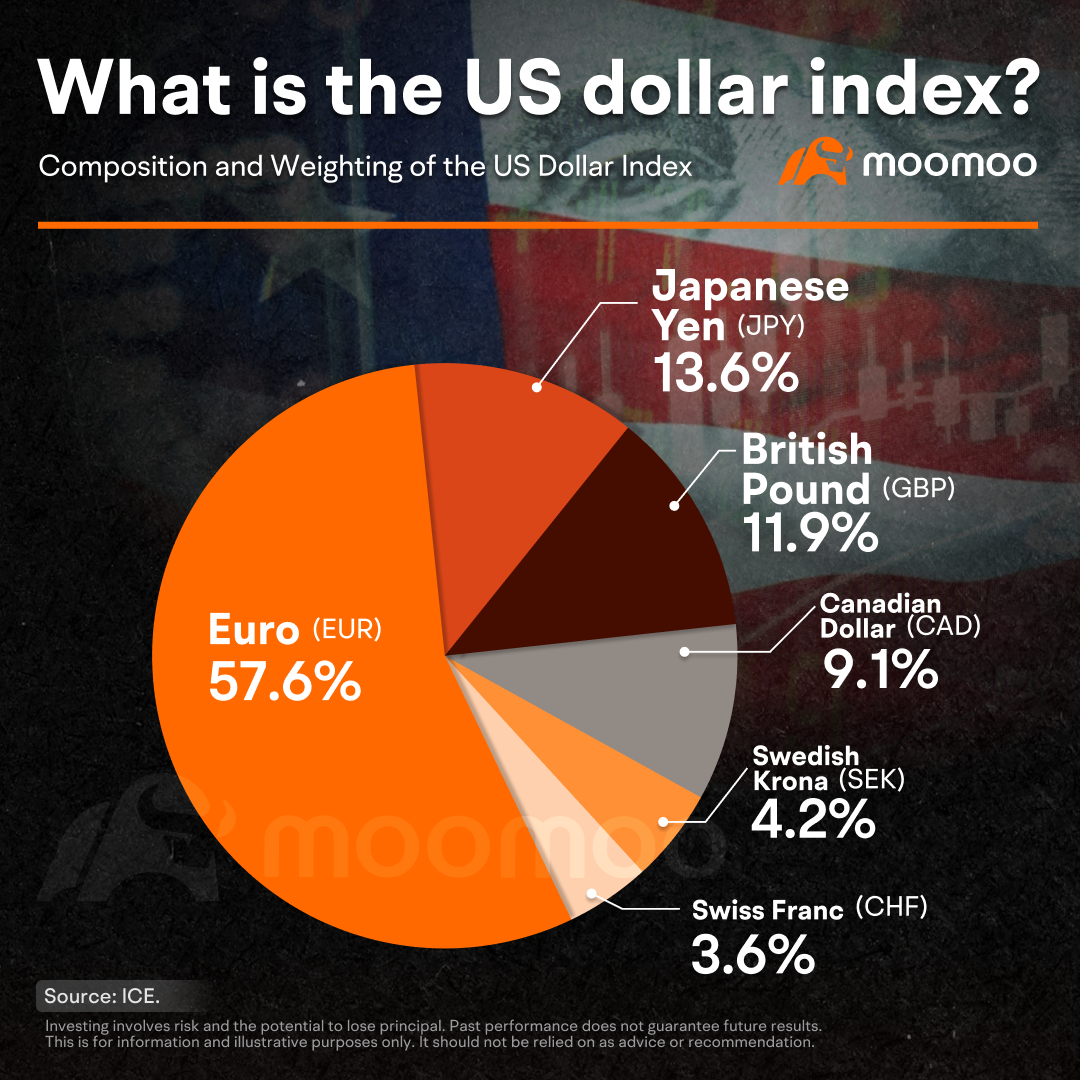
It's like a report card for the dollar, made up of six currency pairs. Each pair gets a grade based on its economic heft.
The euro has the highest weight, comprising nearly 60%, while the yen and the British pound each account for over 10%.
Born in the '70s, the Dollar Index emerged when the post-World War II Bretton Woods system unraveled.
The dollar unhitched from gold, and the fixed exchange rate between other currencies and the dollar also ended, leaving global currencies without a steady anchor.
The Fed whipped up the Dollar Index in 1973 to see how the dollar fared in the new free-floating world. Fast forward to 1999, and with the eurozone coming to life, the euro muscled its way to the top of the index.
Its currency basket is based on old trade patterns and hasn't kept up with today's global economy.
Despite significant increases in trade between the US and emerging markets like China and India, the index remains focused on traditional developed countries.
In 2025, it's still a valuable tool for assessing the dollar's strength and offers investors and analysts key insights into market shifts.
Investors can track it easily with moomoo by searching for USDindex.
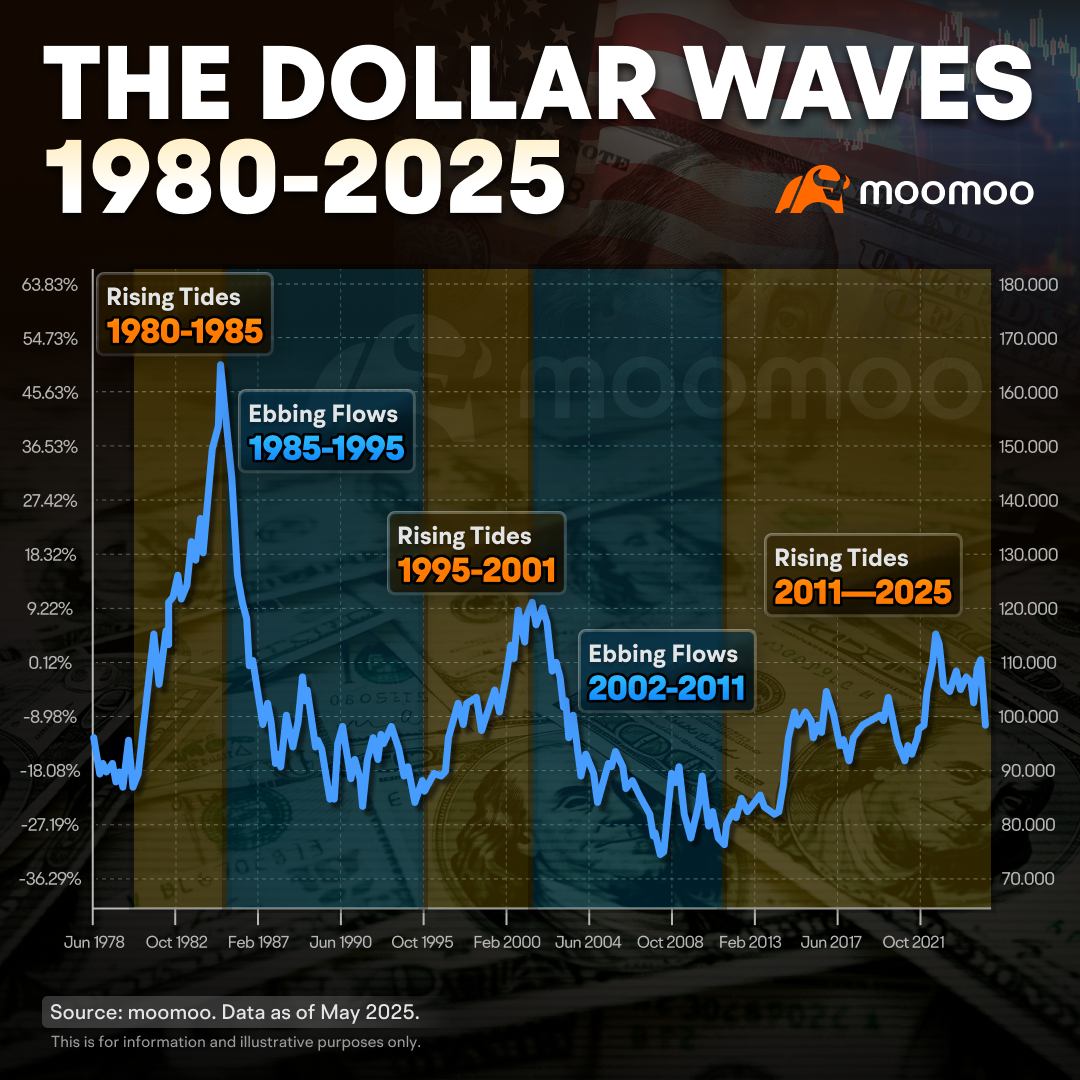
Over the decades, the Dollar Index has seen its share of ups and downs.
Rising Tides:
1980-1985: The Fed jacked up interest rates to 20% to curb stagflation, sending the Index skyrocketing.
1995-2001: The dot-com boom and Clinton-era fiscal policies lured capital back to the U.S.
2011 to present: The U.S. rebounded from the financial crisis and started dialing back on Quantitative Easing. Post-pandemic, high inflation had the Fed hiking rates again, boosting the dollar.
Ebbing Flows:
1985-1995: The Plaza Accord saw the U.S. and trade buddies step in to weaken the dollar and tackle trade imbalances.
2002-2011: The dot-com bust and the '08 financial meltdown dented the dollar's reputation.
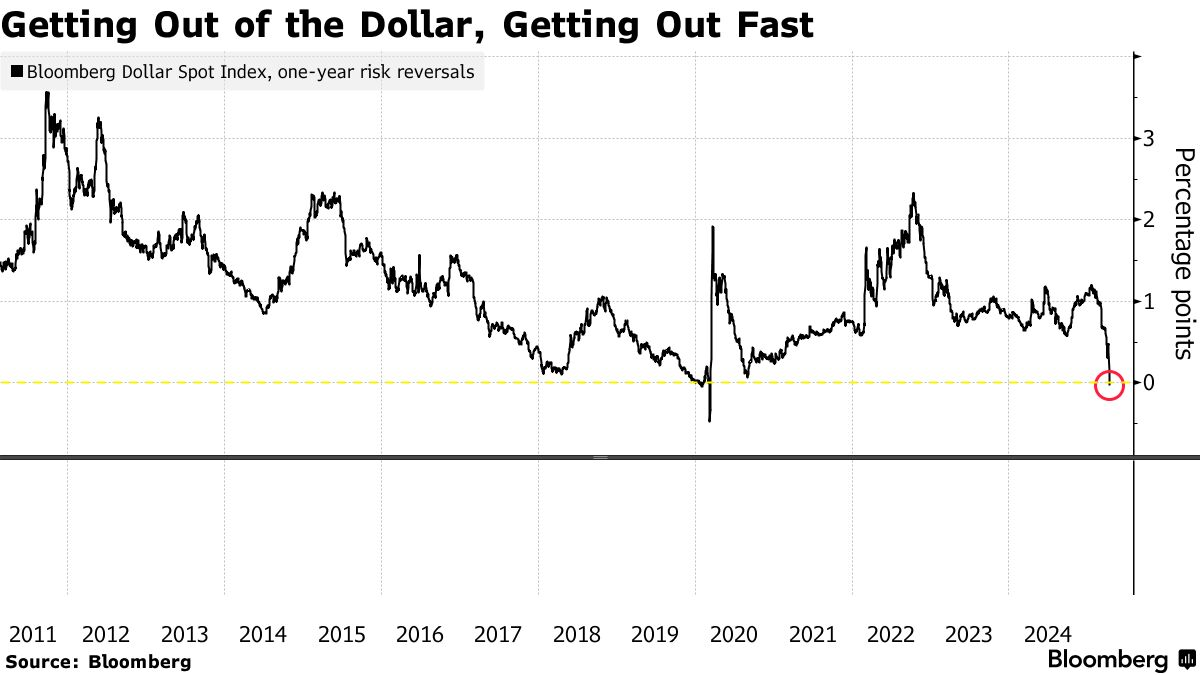
The dollar's journey reflects shifting economic landscapes and drives global capital flows. Looking ahead, Trump's tariffs have thrown a new wrench into the dollar's future path.
Past performance does not guarantee future results. This is for information and illustrative purposes only.
In bullish and bearish scenarios, which assets might win big? And how should investors play their cards?
Stay tuned for our next session, and we'll dive into it. Don't miss out!
This presentation is for informational and educational use only and is not a recommendation or endorsement of any particular investment or investment strategy. Investment information provided in this content is general in nature, strictly for illustrative purposes, and may not be appropriate for all investors. Read more
Recommend
Why does Warren Buffett say don't piggyback on his trades?

How does nonfarm payroll impact the global market?
Unveiling Inflation: Why is Your Wallet Shrinking?

Mastering the Dollar Cycle: How to invest in a changing economy
Gold vs. Gold Miners: A Comparison
Are U.S. Treasuries still a safe haven?
Meet Dr. Copper: Understanding the Copper Market
Do Oil Price Swings Rock the Stock Market?
How Tariffs Could Impact the Copper Landscape?
Why do oil ETFs lag behind oil prices in the long run?
Why is the US dollar so powerful worldwide, and how can we tell?
A look at employment: what other indicators are there?
GDP: The Barometer of National Prosperity
Understanding Treasury Auctions: A Step-by-Step Guide
Unpacking the U.S. Debt Issue
Why is Oil Called the "Mother of All Commodities"?
How Inflation Affects the Market
How to interpret the Fed dot plot?
How to Decode Inflation: CPI, PCE, and PPI
Understanding Bessent's Fiscal Blueprint
The Rise of the Fed: Can Trump Dismiss Powell?
What's in the Fed's Toolbox?
'Oracle of Omaha' Warren Buffett:ROE>20% is preferable
'Father of value investing' Benjamin Graham: Ten Stock Selection Criteria
Strong Consumer Spending Despite Economic Slowdown: Here's Why
Analyzing the manufacturing industry may help you grasp economic trends
What is the Debt Ceiling? A Deep Dive into US Fiscal Policy
How to Preserve Your Wealth in a High Inflation Environment
How to analyze the Federal Reserve's monetary policy?
Rapidly Rising US Housing Prices: Opportunity or Risk?
How Will the US Dollar Perform in 2024? A Closer Look into the US Dollar Index
Discussing the driving forces behind rises in gold prices
Investing and Labor Market Indicators
Discover the bond market: A quick and easy guide
The Underlying Conflicts Surrounding Crude Oil Prices
Understanding the relationship between the stock market and the bond market
Understanding the US Non-Farm Payroll Data
Understanding the Federal Reserve Interest Rate Decision
Understanding the CCI
Understanding the PPI
Understanding the Retail Sales
Understanding the US Crude Oil Inventories
Understanding the Durable Goods Orders
Listen to the Fed's speakers: Hawks or doves?
Open the Fed's monetary policy toolbox
The Fed Dot Plot explained: What it says about US interest rates
How does monetary policy steer our lives and investment
What the Federal Reserve does?
Understanding the GDP
A brief history lesson on the Fed and U.S. economy
08 Carl Icahn & Icahn Enterprises
09 Seth Klarman & Baupost Group
07 Howard Marks & Oaktree Capital
01 Using 13F filings to learn from big investors
03 How to Read Form 13F
02 Identify a fund's investment strategy
04 Warren Buffett & Berkshire Hathaway
06 Ray Dalio & Bridgewater Associates
05 Bill Ackerman & Pershing Square Capital
Why does Warren Buffett say don't piggyback on his trades?
How does nonfarm payroll impact the global market?
Unveiling Inflation: Why is Your Wallet Shrinking?
Mastering the Dollar Cycle: How to invest in a changing economy
Gold vs. Gold Miners: A Comparison
Are U.S. Treasuries still a safe haven?
Meet Dr. Copper: Understanding the Copper Market
Do Oil Price Swings Rock the Stock Market?
How Tariffs Could Impact the Copper Landscape?
Why do oil ETFs lag behind oil prices in the long run?
Why is the US dollar so powerful worldwide, and how can we tell?
A look at employment: what other indicators are there?
GDP: The Barometer of National Prosperity
Understanding Treasury Auctions: A Step-by-Step Guide
Unpacking the U.S. Debt Issue
Why is Oil Called the "Mother of All Commodities"?
How Inflation Affects the Market
How to interpret the Fed dot plot?
How to Decode Inflation: CPI, PCE, and PPI
Understanding Bessent's Fiscal Blueprint
The Rise of the Fed: Can Trump Dismiss Powell?
What's in the Fed's Toolbox?
'Oracle of Omaha' Warren Buffett:ROE>20% is preferable
'Father of value investing' Benjamin Graham: Ten Stock Selection Criteria
Strong Consumer Spending Despite Economic Slowdown: Here's Why
Analyzing the manufacturing industry may help you grasp economic trends
What is the Debt Ceiling? A Deep Dive into US Fiscal Policy
How to Preserve Your Wealth in a High Inflation Environment
How to analyze the Federal Reserve's monetary policy?
Rapidly Rising US Housing Prices: Opportunity or Risk?
How Will the US Dollar Perform in 2024? A Closer Look into the US Dollar Index
Discussing the driving forces behind rises in gold prices
Investing and Labor Market Indicators
Discover the bond market: A quick and easy guide
The Underlying Conflicts Surrounding Crude Oil Prices
Understanding the relationship between the stock market and the bond market
Understanding the US Non-Farm Payroll Data
Understanding the Federal Reserve Interest Rate Decision
Understanding the CCI
Understanding the PPI
Understanding the Retail Sales
Understanding the US Crude Oil Inventories
Understanding the Durable Goods Orders
Listen to the Fed's speakers: Hawks or doves?
Open the Fed's monetary policy toolbox
The Fed Dot Plot explained: What it says about US interest rates
How does monetary policy steer our lives and investment
What the Federal Reserve does?
Understanding the GDP
A brief history lesson on the Fed and U.S. economy
08 Carl Icahn & Icahn Enterprises
09 Seth Klarman & Baupost Group
07 Howard Marks & Oaktree Capital
01 Using 13F filings to learn from big investors
03 How to Read Form 13F
02 Identify a fund's investment strategy
04 Warren Buffett & Berkshire Hathaway
06 Ray Dalio & Bridgewater Associates
05 Bill Ackerman & Pershing Square Capital

