
Moomoo Insights
Jul 16 15:38
TSMC Earnings: AI Demand Is Stronger Than the Chip Selloff Suggests
Moomoo Insights
Sep 30 05:04
Live Take | Anthropic’s $518B Compute Bet: Who Wins From the AI Buildout?
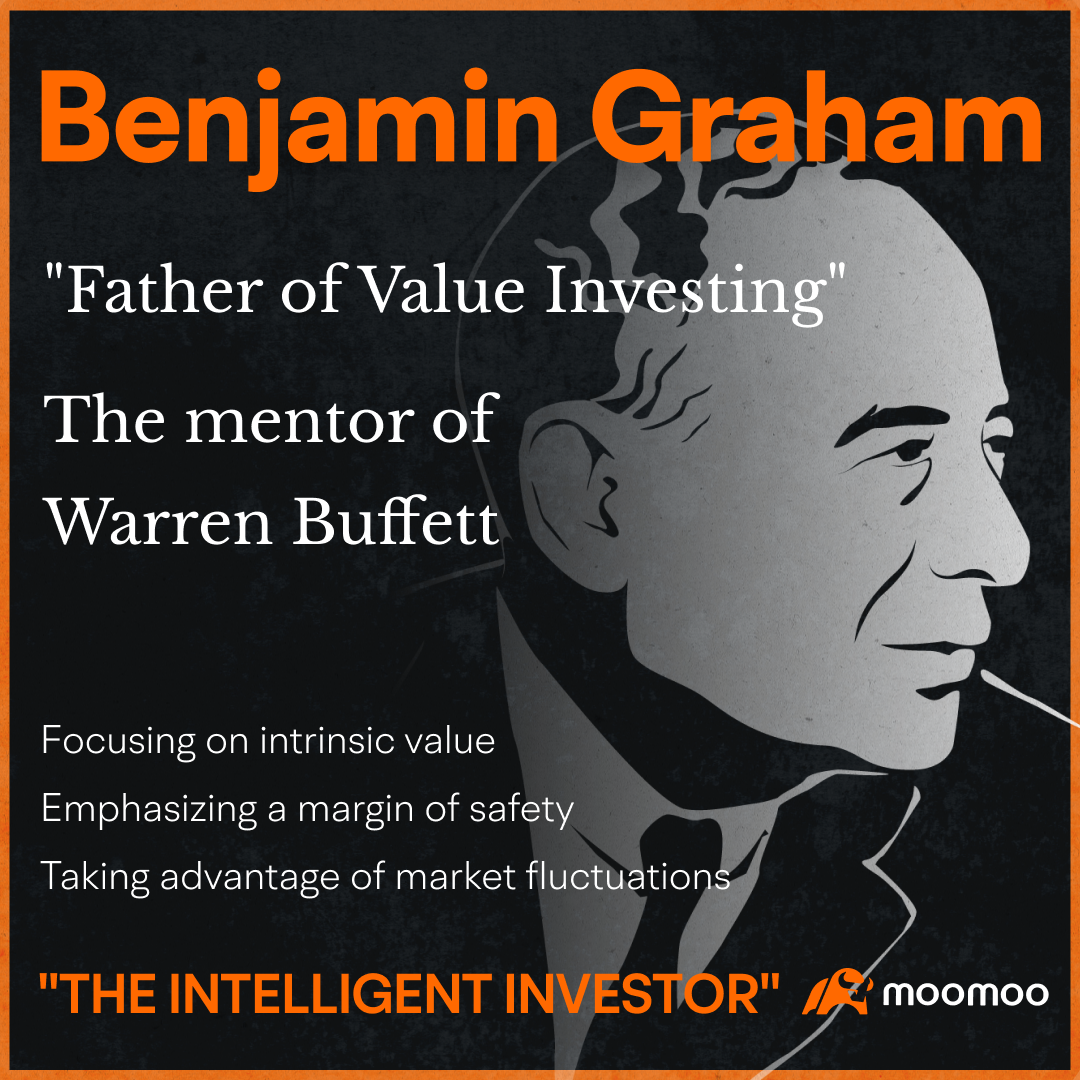
When it comes to value investing, one cannot overlook the contribution of Benjamin Graham, who is often regarded as the "father of value investing."
He was not only an well-known investor but also a renowned professor and economist. His two classic works, "Security Analysis" and "The Intelligent Investor," have influenced many investors over the years. "Security Analysis" promoted money management practices to become a modern profession with more transparency. On the other hand, "The Intelligent Investor" has become the bible of value investing.
Many other well-known investors, such as Warren Buffet and Irving Kahn, were once Graham's students. According to Buffet, Graham's influence on him was second only to his father.
So, what kind of investment experience did Graham have? After graduating from Columbia University with honors, he started working on Wall Street. From starting as a clerk and an analyst, he co-founded the Graham-Newman Corporation and dived into stock research. Although he suffered heavy losses during the Great Depression of 1929-1932, the Graham-Newman Corporation achieved an annualized return rate of no less than 14.7% from 1936 to 1956, the year he retired.
During Graham's investment career, one of his most significant achievements was investing in the Northern Pipeline Company. He identified that the company held bond and cash assets, which were not being utilized optimally, so he purchased its stock, teamed up with other shareholders to force a proxy vote to distribute the assets to shareholders, allowing them to make substantial profits.
Graham had his own set of core principles that enabled him to succeed. For instance, he valued the intrinsic value of a company, believing that it does not depend on its stock price. He recognized that the market is always fluctuating, and shrewd investors can leverage these fluctuations. Moreover, he emphasized the importance of having a margin of safety and expected to "buy assets worth $1 for 50 cents".
Then, what are Graham's core principles in stock selection?
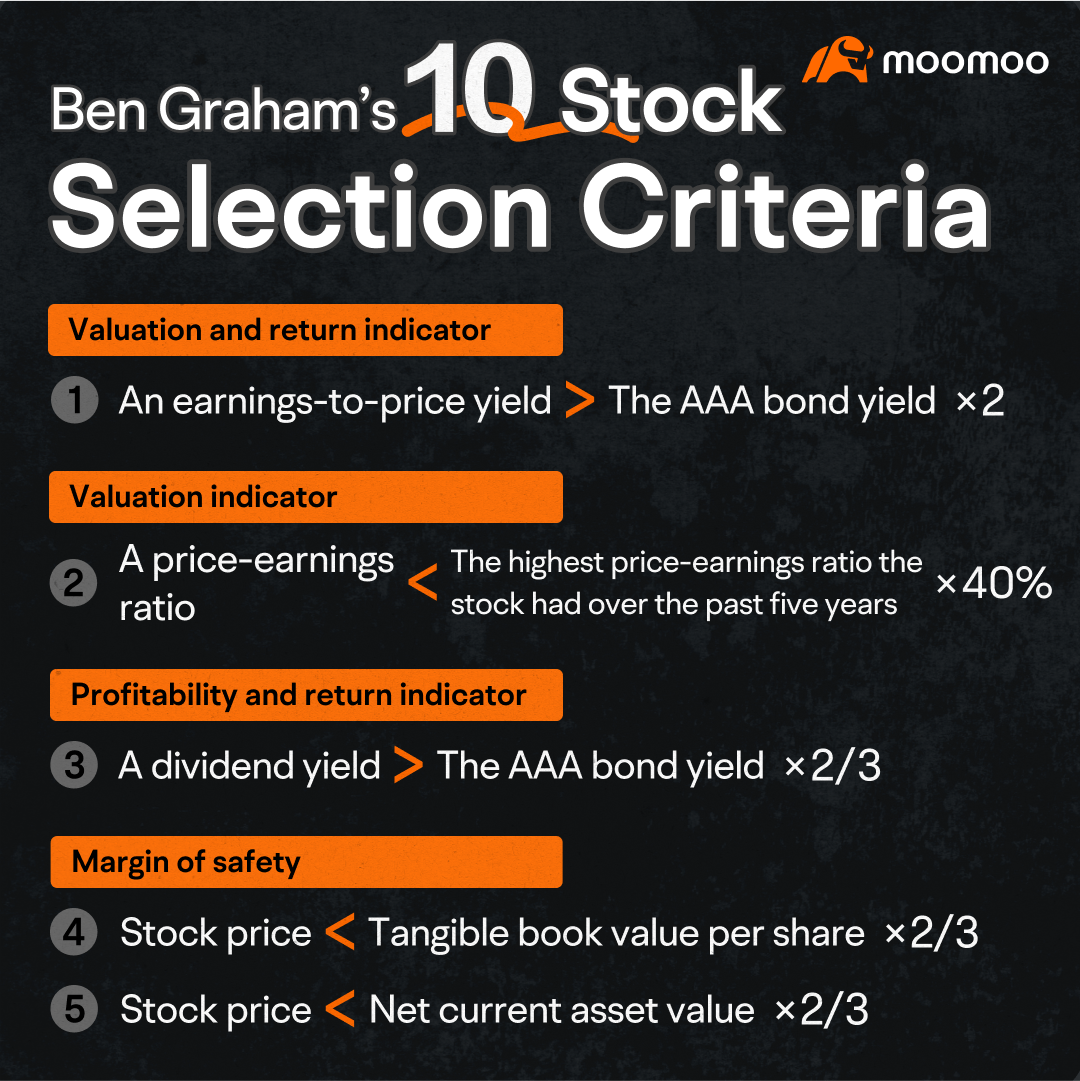
(1) An earnings-to-price yield at least twice the AAA bond yield.
What does this mean? Earnings Yield = 1 / P/E ratio = Net Profit / Total Market Value. In other words, you may understand it as the annual return yield brought by the company's earnings if we have bought the company at the price of the total market value.
This indicator reflects stock valuation, with low values indicating overvaluation and high values indicating undervaluation. It also reflects the potential returns that stocks may generate to some extent. This indicator is suitable for companies with relatively stable earnings.
As of August 2, 2023, the actual yield on AAA-rated corporate bonds in the United States from Bank of America Merrill Lynch was 4.87%. If we calculate based on this value, then the requirement here is that the earnings yield of stocks should be greater than 9.74%.
(2) A price-earnings ratio less than 40 per cent of the highest price-earnings ratio the stock had over the past five years.
The P/E Ratio = Total Market Value / Net Profit = Price Per Share / Earnings Per Share. This indicator is particularly useful for companies with relatively stable profitability.
The standard here is to compare the relative value of the same stock at different periods to ensure it is not at a high point.
(3) A dividend yield of at least two-thirds the AAA bond yield.
The dividend yield of a stock refers to the amount of dividend income that an investor can receive for each unit of stock they own. It's an important component of the total investment return rate, and it also reflects the profitability of the company to some extent.
If the yield on AAA-rated bonds in the United States is still calculated at 4.87%, the requirement for the dividend yield of stocks to reach should be at least 3.25%.
(4) Stock price below two-thirds of tangible book value per share.
Graham's standard requires that the stock price be lower than two-thirds of the company's net tangible assets per share. This ensures that investors have a margin of safety by buying stocks at a discount to the company's tangible assets, which are easier to estimate accurately than intangible assets like brand value or intellectual property.
(5) Stock price below two-thirds of "net current asset value."
Net Current Assets Per Share is an indicator by Graham, calculated as: (Current Assets - Total Liabilities - Preferred Stock) / Number of Shares Outstanding.
This standard requires the stock price to have a discount relative to the Net Current Assets per Share. This reflects the importance of having a margin of safety when making stock valuation.
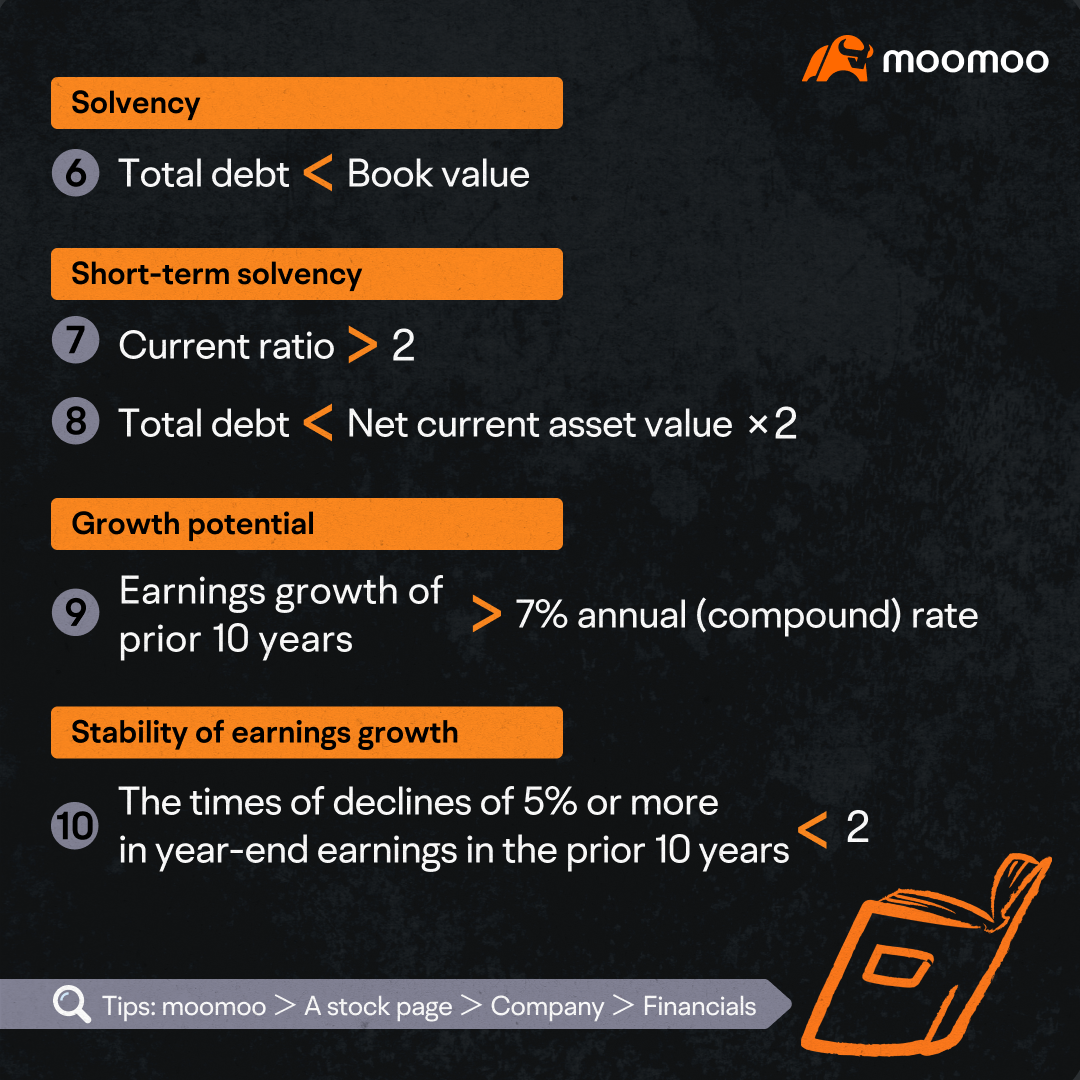
(6) Total debt less than book value.
Graham's standard requires a company's total debt to be less than its net tangible assets, ensuring that the value of its tangible assets is sufficient to cover its debts and reduce risks such as bankruptcy and delisting.
(7) Current ratio greater than two.
The current ratio is a key indicator of a company's ability to pay off short-term debts. It compares current assets to current liabilities, with higher ratios indicating greater short-term debt-paying ability.
(8) Total debt less than twice "net current asset value."
The ratio of total debt to net current assets doesn't have a clear standard, but Graham's requirement is for this ratio to be less than 2. This standard emphasizes the importance of a company's short-term debt-paying ability.
(9) Earnings growth of prior 10 years at least at a 7 per cent annual (compound) rate.
(10) Stability of growth of earnings in that no more than two declines of 5 per cent or more in year-end earnings in the prior 10 years are permissible.
These two standards focus on a company's profit growth rate. The first requires an average annualized profit growth rate of over 7% in the past decade, while the second restricts negative growth rate to no more than two instances of less than 5% in the same period. These standards evaluate a company's profit growth stability and are important for long-term investors seeking growth opportunities.
Graham's ten standards cover various aspects of valuation, return rate (including dividend yield), stock price bubble, debt-paying ability, growth, and more. They appear consistent with his emphasis on intrinsic value and margin of safety.
However, these standards may seem excessively strict since it can be challenging to find a company that meets all of them. For instance, such a company would need to have a high dividend yield, low debt levels, and an average annualized profit growth rate exceeding 7% in the past decade.
One possible solution is to simplify the standards by focusing on both returns and risks. Graham suggests meeting at least one standard for return and one for risk. This simplification makes the standards more feasible to apply.
For example, a trader named Henry Oppenheimer created a successful investment portfolio by screening stocks from the New York and American Stock Exchanges based on criteria, including "profit return rates greater than twice the yield on AAA-rated bonds" and "total debt lower than net tangible assets."
What can we learn from the above criteria?
The key concepts in Graham's strategy are a stock's value and margin of safety. To identify companies worth investing in, investors might want to consider factors such as valuation indicators, dividend yield, solvency, and growth. Next, a company's stock price relative to tangible book value per share and net current asset value can provide a margin of safety. When selecting specific indicators, there is some flexibility.
It should be noted that the article is for educational purposes and practical exercises only, and does not represent investment advice. Graham's strategy discussed in this article does not guarantee profits from individual stocks, it can provide valuable insights for investors.
This presentation is for informational and educational use only and is not a recommendation or endorsement of any particular investment or investment strategy. Investment information provided in this content is general in nature, strictly for illustrative purposes, and may not be appropriate for all investors. Read more
Recommend
Why does Warren Buffett say don't piggyback on his trades?

How does nonfarm payroll impact the global market?
Unveiling Inflation: Why is Your Wallet Shrinking?

Mastering the Dollar Cycle: How to invest in a changing economy
Gold vs. Gold Miners: A Comparison
Are U.S. Treasuries still a safe haven?
Meet Dr. Copper: Understanding the Copper Market
Do Oil Price Swings Rock the Stock Market?
How Tariffs Could Impact the Copper Landscape?
Why do oil ETFs lag behind oil prices in the long run?
Why is the US dollar so powerful worldwide, and how can we tell?
A look at employment: what other indicators are there?
GDP: The Barometer of National Prosperity
Understanding Treasury Auctions: A Step-by-Step Guide
Unpacking the U.S. Debt Issue
Why is Oil Called the "Mother of All Commodities"?
How Inflation Affects the Market
How to interpret the Fed dot plot?
How to Decode Inflation: CPI, PCE, and PPI
Understanding Bessent's Fiscal Blueprint
The Rise of the Fed: Can Trump Dismiss Powell?
What's in the Fed's Toolbox?
'Oracle of Omaha' Warren Buffett:ROE>20% is preferable
'Father of value investing' Benjamin Graham: Ten Stock Selection Criteria
Strong Consumer Spending Despite Economic Slowdown: Here's Why
Analyzing the manufacturing industry may help you grasp economic trends
What is the Debt Ceiling? A Deep Dive into US Fiscal Policy
How to Preserve Your Wealth in a High Inflation Environment
How to analyze the Federal Reserve's monetary policy?
Rapidly Rising US Housing Prices: Opportunity or Risk?
How Will the US Dollar Perform in 2024? A Closer Look into the US Dollar Index
Discussing the driving forces behind rises in gold prices
Investing and Labor Market Indicators
Discover the bond market: A quick and easy guide
The Underlying Conflicts Surrounding Crude Oil Prices
Understanding the relationship between the stock market and the bond market
Understanding the US Non-Farm Payroll Data
Understanding the Federal Reserve Interest Rate Decision
Understanding the CCI
Understanding the PPI
Understanding the Retail Sales
Understanding the US Crude Oil Inventories
Understanding the Durable Goods Orders
Listen to the Fed's speakers: Hawks or doves?
Open the Fed's monetary policy toolbox
The Fed Dot Plot explained: What it says about US interest rates
How does monetary policy steer our lives and investment
What the Federal Reserve does?
Understanding the GDP
A brief history lesson on the Fed and U.S. economy
08 Carl Icahn & Icahn Enterprises
09 Seth Klarman & Baupost Group
07 Howard Marks & Oaktree Capital
01 Using 13F filings to learn from big investors
03 How to Read Form 13F
02 Identify a fund's investment strategy
04 Warren Buffett & Berkshire Hathaway
06 Ray Dalio & Bridgewater Associates
05 Bill Ackerman & Pershing Square Capital
Why does Warren Buffett say don't piggyback on his trades?
How does nonfarm payroll impact the global market?
Unveiling Inflation: Why is Your Wallet Shrinking?
Mastering the Dollar Cycle: How to invest in a changing economy
Gold vs. Gold Miners: A Comparison
Are U.S. Treasuries still a safe haven?
Meet Dr. Copper: Understanding the Copper Market
Do Oil Price Swings Rock the Stock Market?
How Tariffs Could Impact the Copper Landscape?
Why do oil ETFs lag behind oil prices in the long run?
Why is the US dollar so powerful worldwide, and how can we tell?
A look at employment: what other indicators are there?
GDP: The Barometer of National Prosperity
Understanding Treasury Auctions: A Step-by-Step Guide
Unpacking the U.S. Debt Issue
Why is Oil Called the "Mother of All Commodities"?
How Inflation Affects the Market
How to interpret the Fed dot plot?
How to Decode Inflation: CPI, PCE, and PPI
Understanding Bessent's Fiscal Blueprint
The Rise of the Fed: Can Trump Dismiss Powell?
What's in the Fed's Toolbox?
'Oracle of Omaha' Warren Buffett:ROE>20% is preferable
'Father of value investing' Benjamin Graham: Ten Stock Selection Criteria
Strong Consumer Spending Despite Economic Slowdown: Here's Why
Analyzing the manufacturing industry may help you grasp economic trends
What is the Debt Ceiling? A Deep Dive into US Fiscal Policy
How to Preserve Your Wealth in a High Inflation Environment
How to analyze the Federal Reserve's monetary policy?
Rapidly Rising US Housing Prices: Opportunity or Risk?
How Will the US Dollar Perform in 2024? A Closer Look into the US Dollar Index
Discussing the driving forces behind rises in gold prices
Investing and Labor Market Indicators
Discover the bond market: A quick and easy guide
The Underlying Conflicts Surrounding Crude Oil Prices
Understanding the relationship between the stock market and the bond market
Understanding the US Non-Farm Payroll Data
Understanding the Federal Reserve Interest Rate Decision
Understanding the CCI
Understanding the PPI
Understanding the Retail Sales
Understanding the US Crude Oil Inventories
Understanding the Durable Goods Orders
Listen to the Fed's speakers: Hawks or doves?
Open the Fed's monetary policy toolbox
The Fed Dot Plot explained: What it says about US interest rates
How does monetary policy steer our lives and investment
What the Federal Reserve does?
Understanding the GDP
A brief history lesson on the Fed and U.S. economy
08 Carl Icahn & Icahn Enterprises
09 Seth Klarman & Baupost Group
07 Howard Marks & Oaktree Capital
01 Using 13F filings to learn from big investors
03 How to Read Form 13F
02 Identify a fund's investment strategy
04 Warren Buffett & Berkshire Hathaway
06 Ray Dalio & Bridgewater Associates
05 Bill Ackerman & Pershing Square Capital