
Moomoo Insights
Jul 16 15:38
TSMC Earnings: AI Demand Is Stronger Than the Chip Selloff Suggests
Moomoo Insights
Sep 30 05:04
Live Take | Anthropic’s $518B Compute Bet: Who Wins From the AI Buildout?
As the world's largest economy, you’d think the U.S. would run like a well-oiled machine. But a lurking concern keeps popping up - the ever-growing debt problem.
Now and then, you might catch a headline about the 'government shutdown' or see Congress in a heated showdown over the debt ceiling. These are just the symptoms of the debt issue.
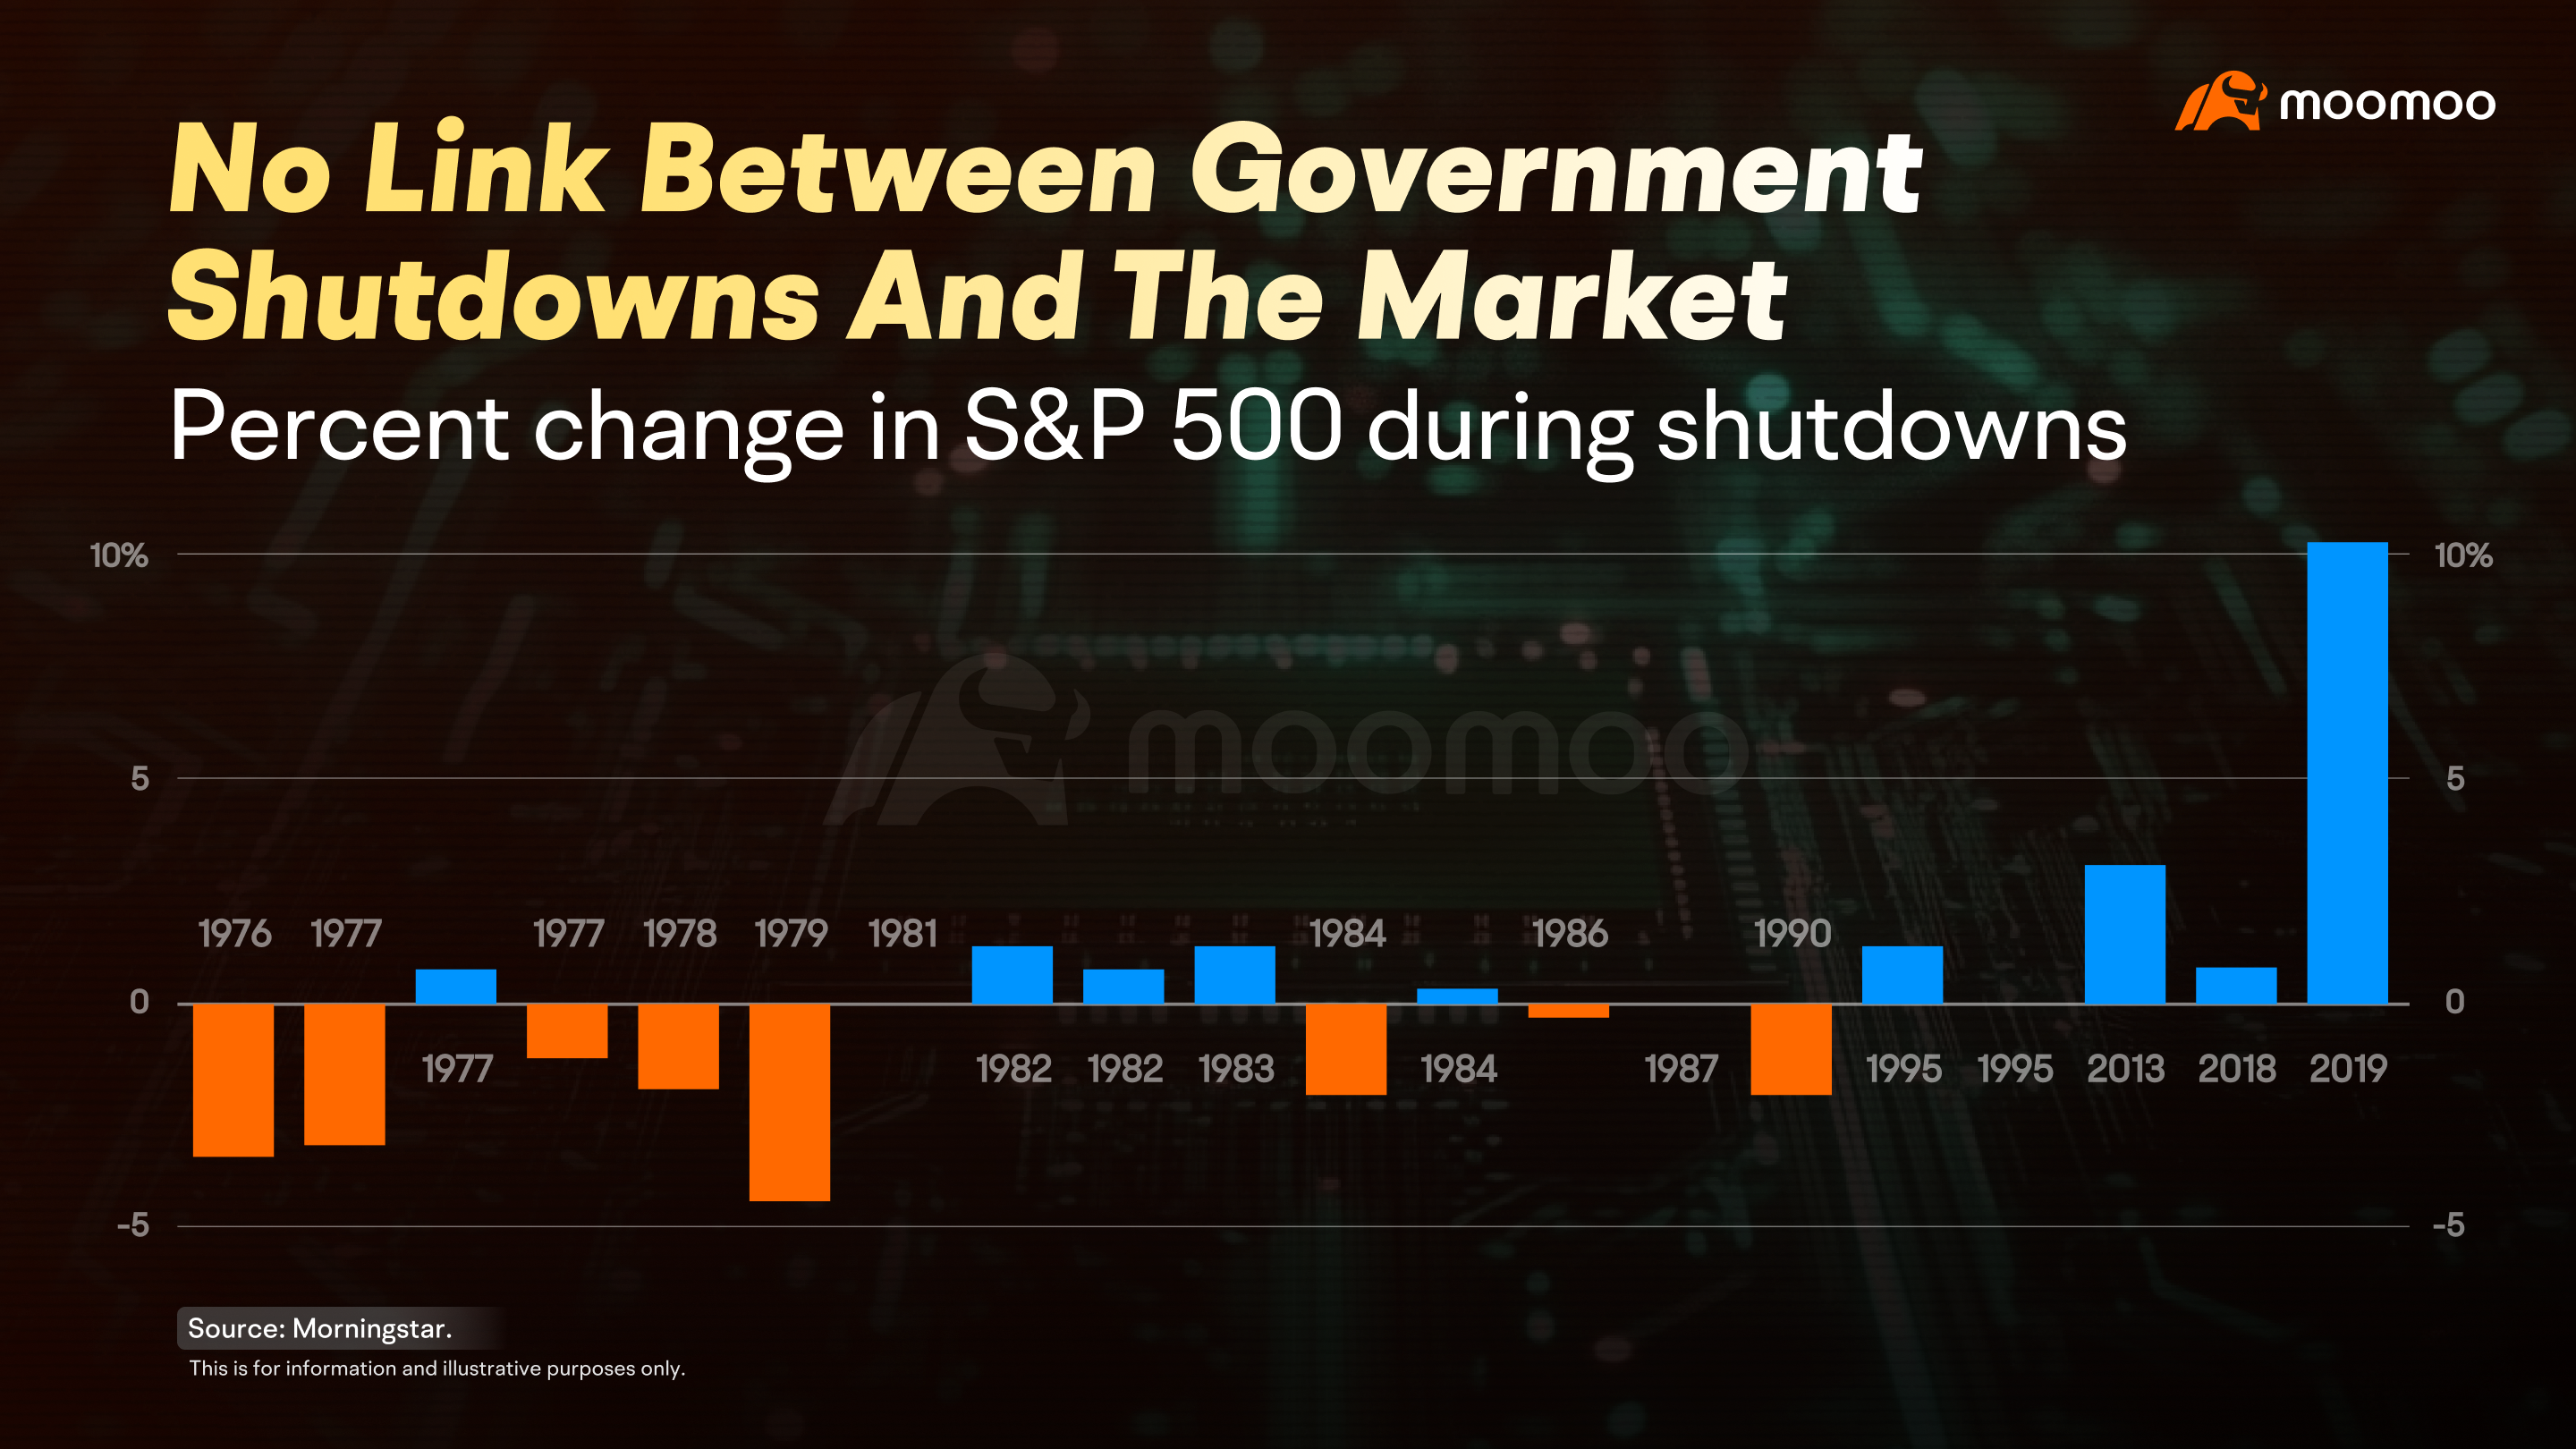
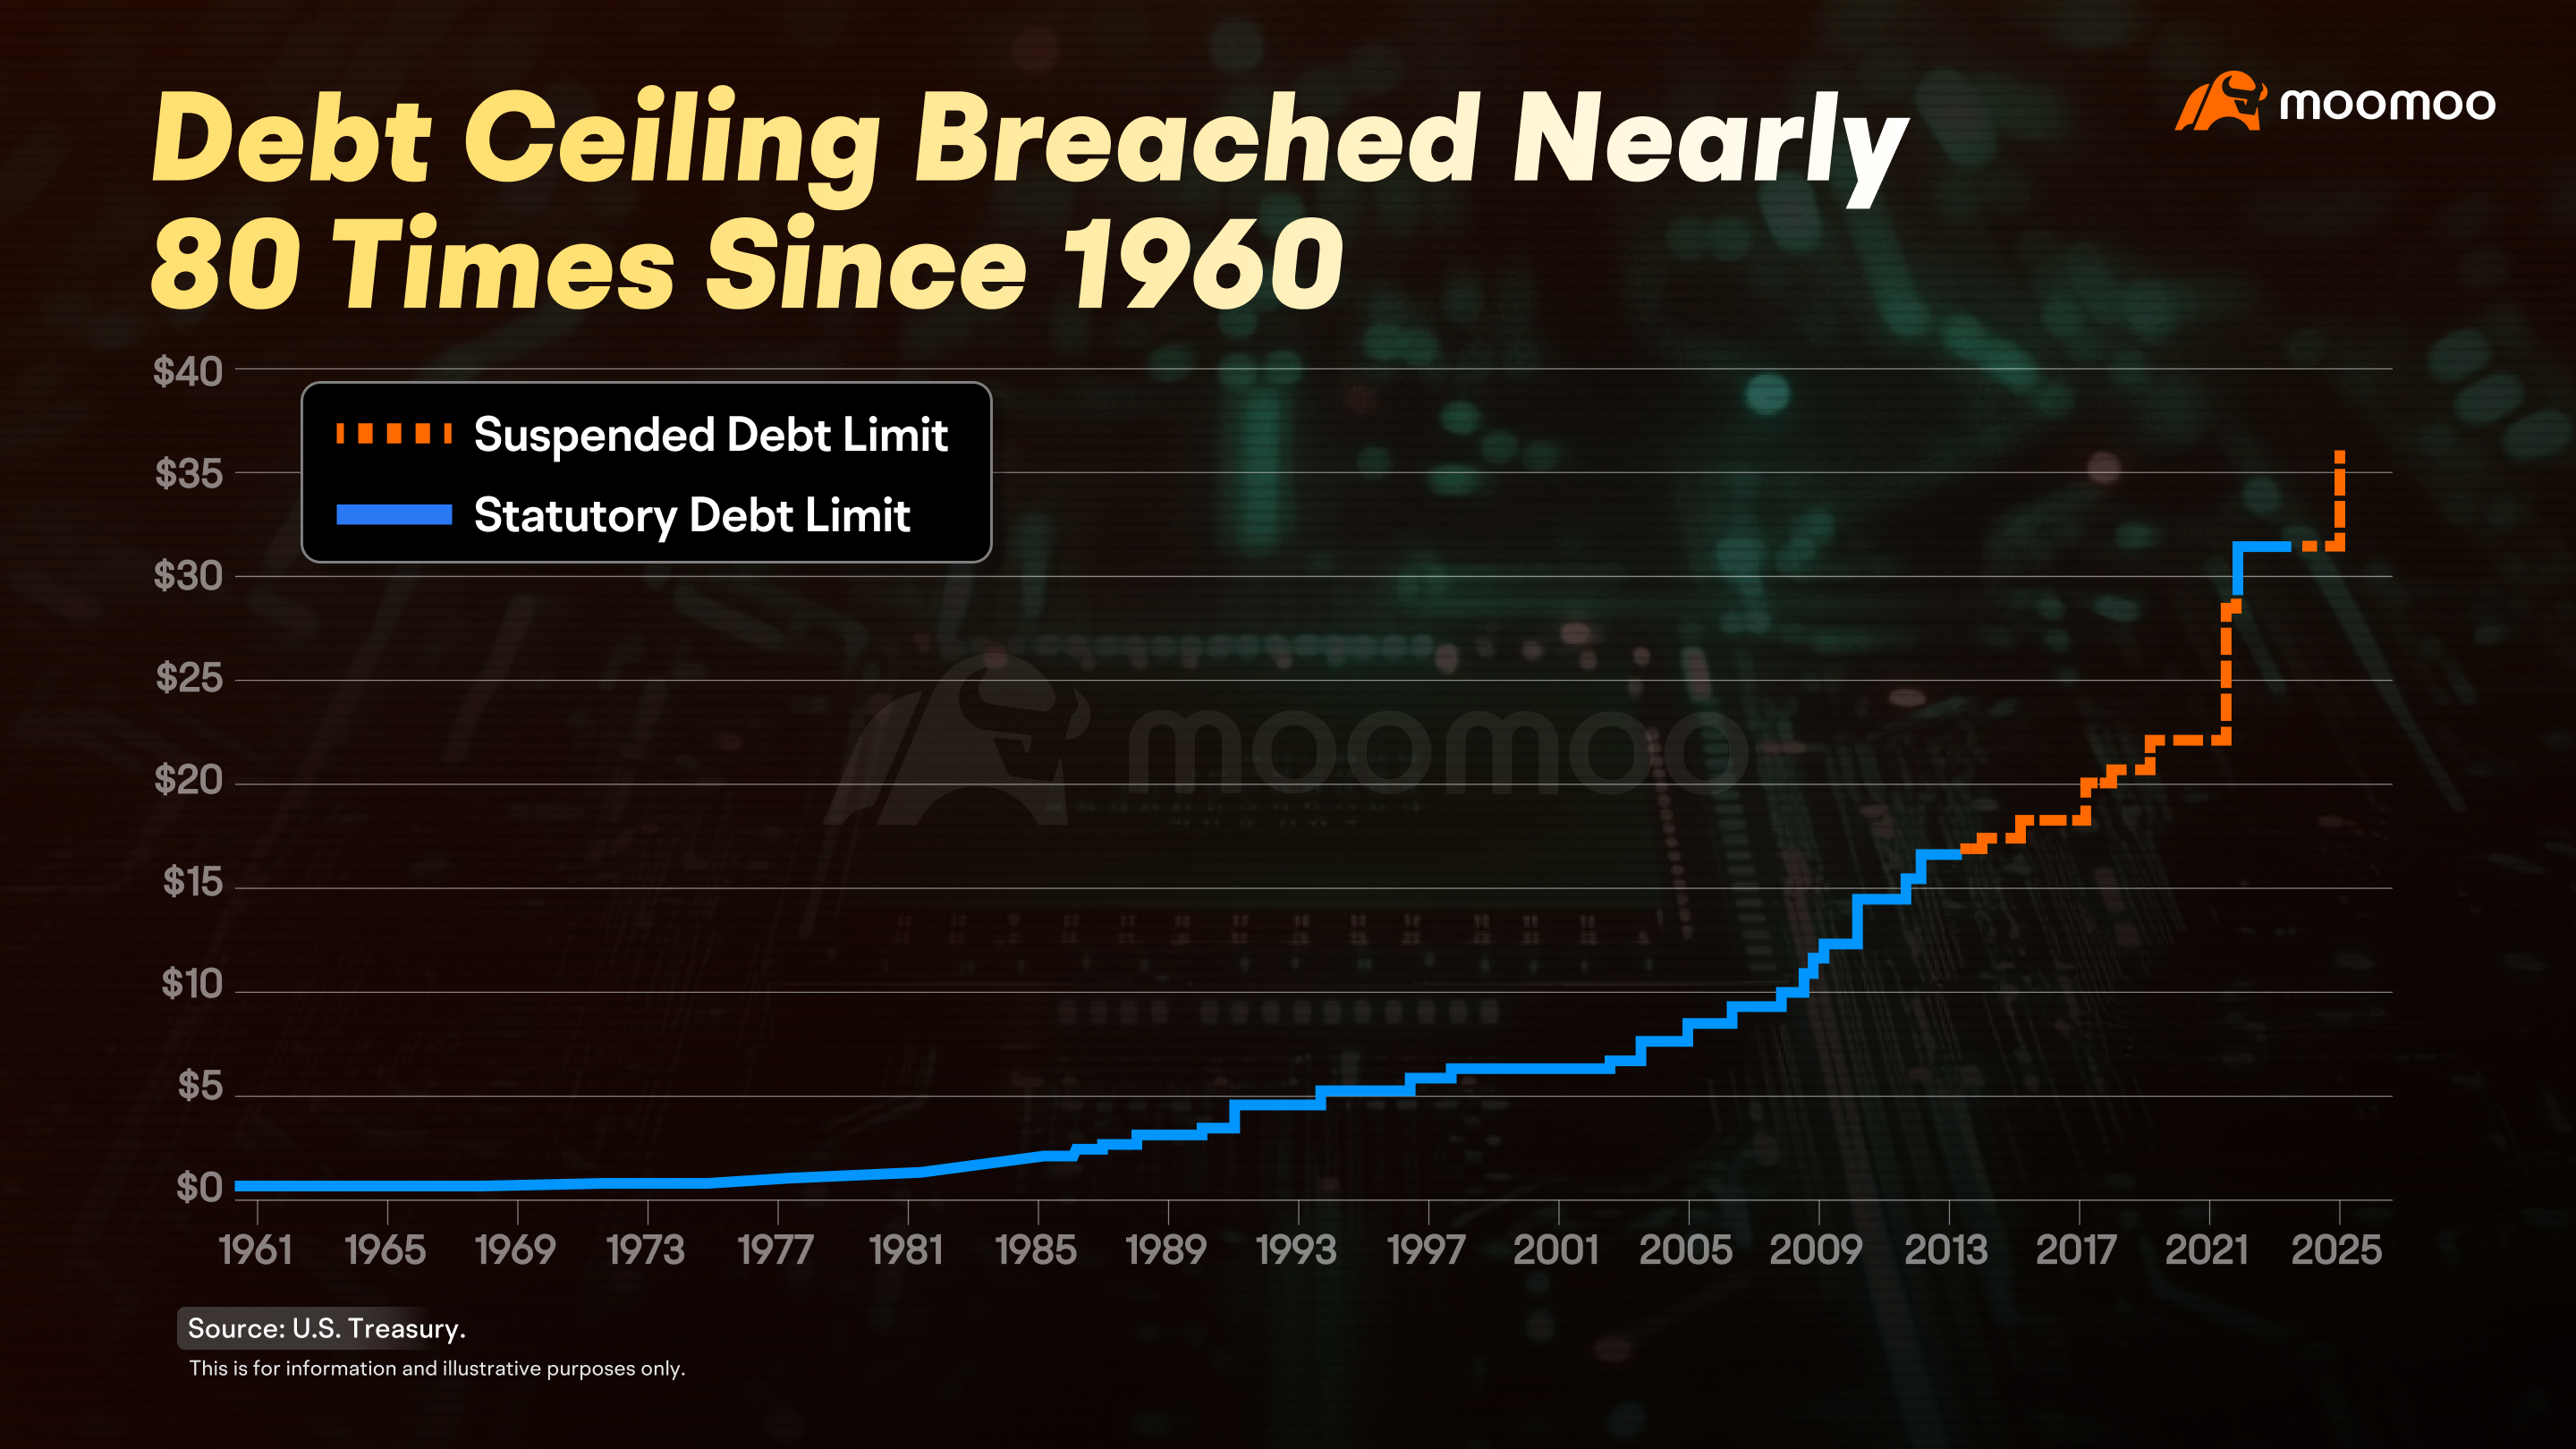
The U.S. government has been hitting the pause button quite a bit—nearly 20 times from 1976 to 2024. And since 1960, Congress has raised the debt ceiling nearly 80 times.
So, what's going on with America's debt situation, and what does it mean for the markets? Let’s break it down.
Takeaways:
U.S. government shutdowns typically occur due to political and budgetary conflicts
The "debt ceiling" is often raised, leading to concerns about the rapidly growing national debt
Unchecked debt growth could pose significant economic risks
Two culprits are at play here: sky-high government debt and the politics between the two major political parties in Congress.
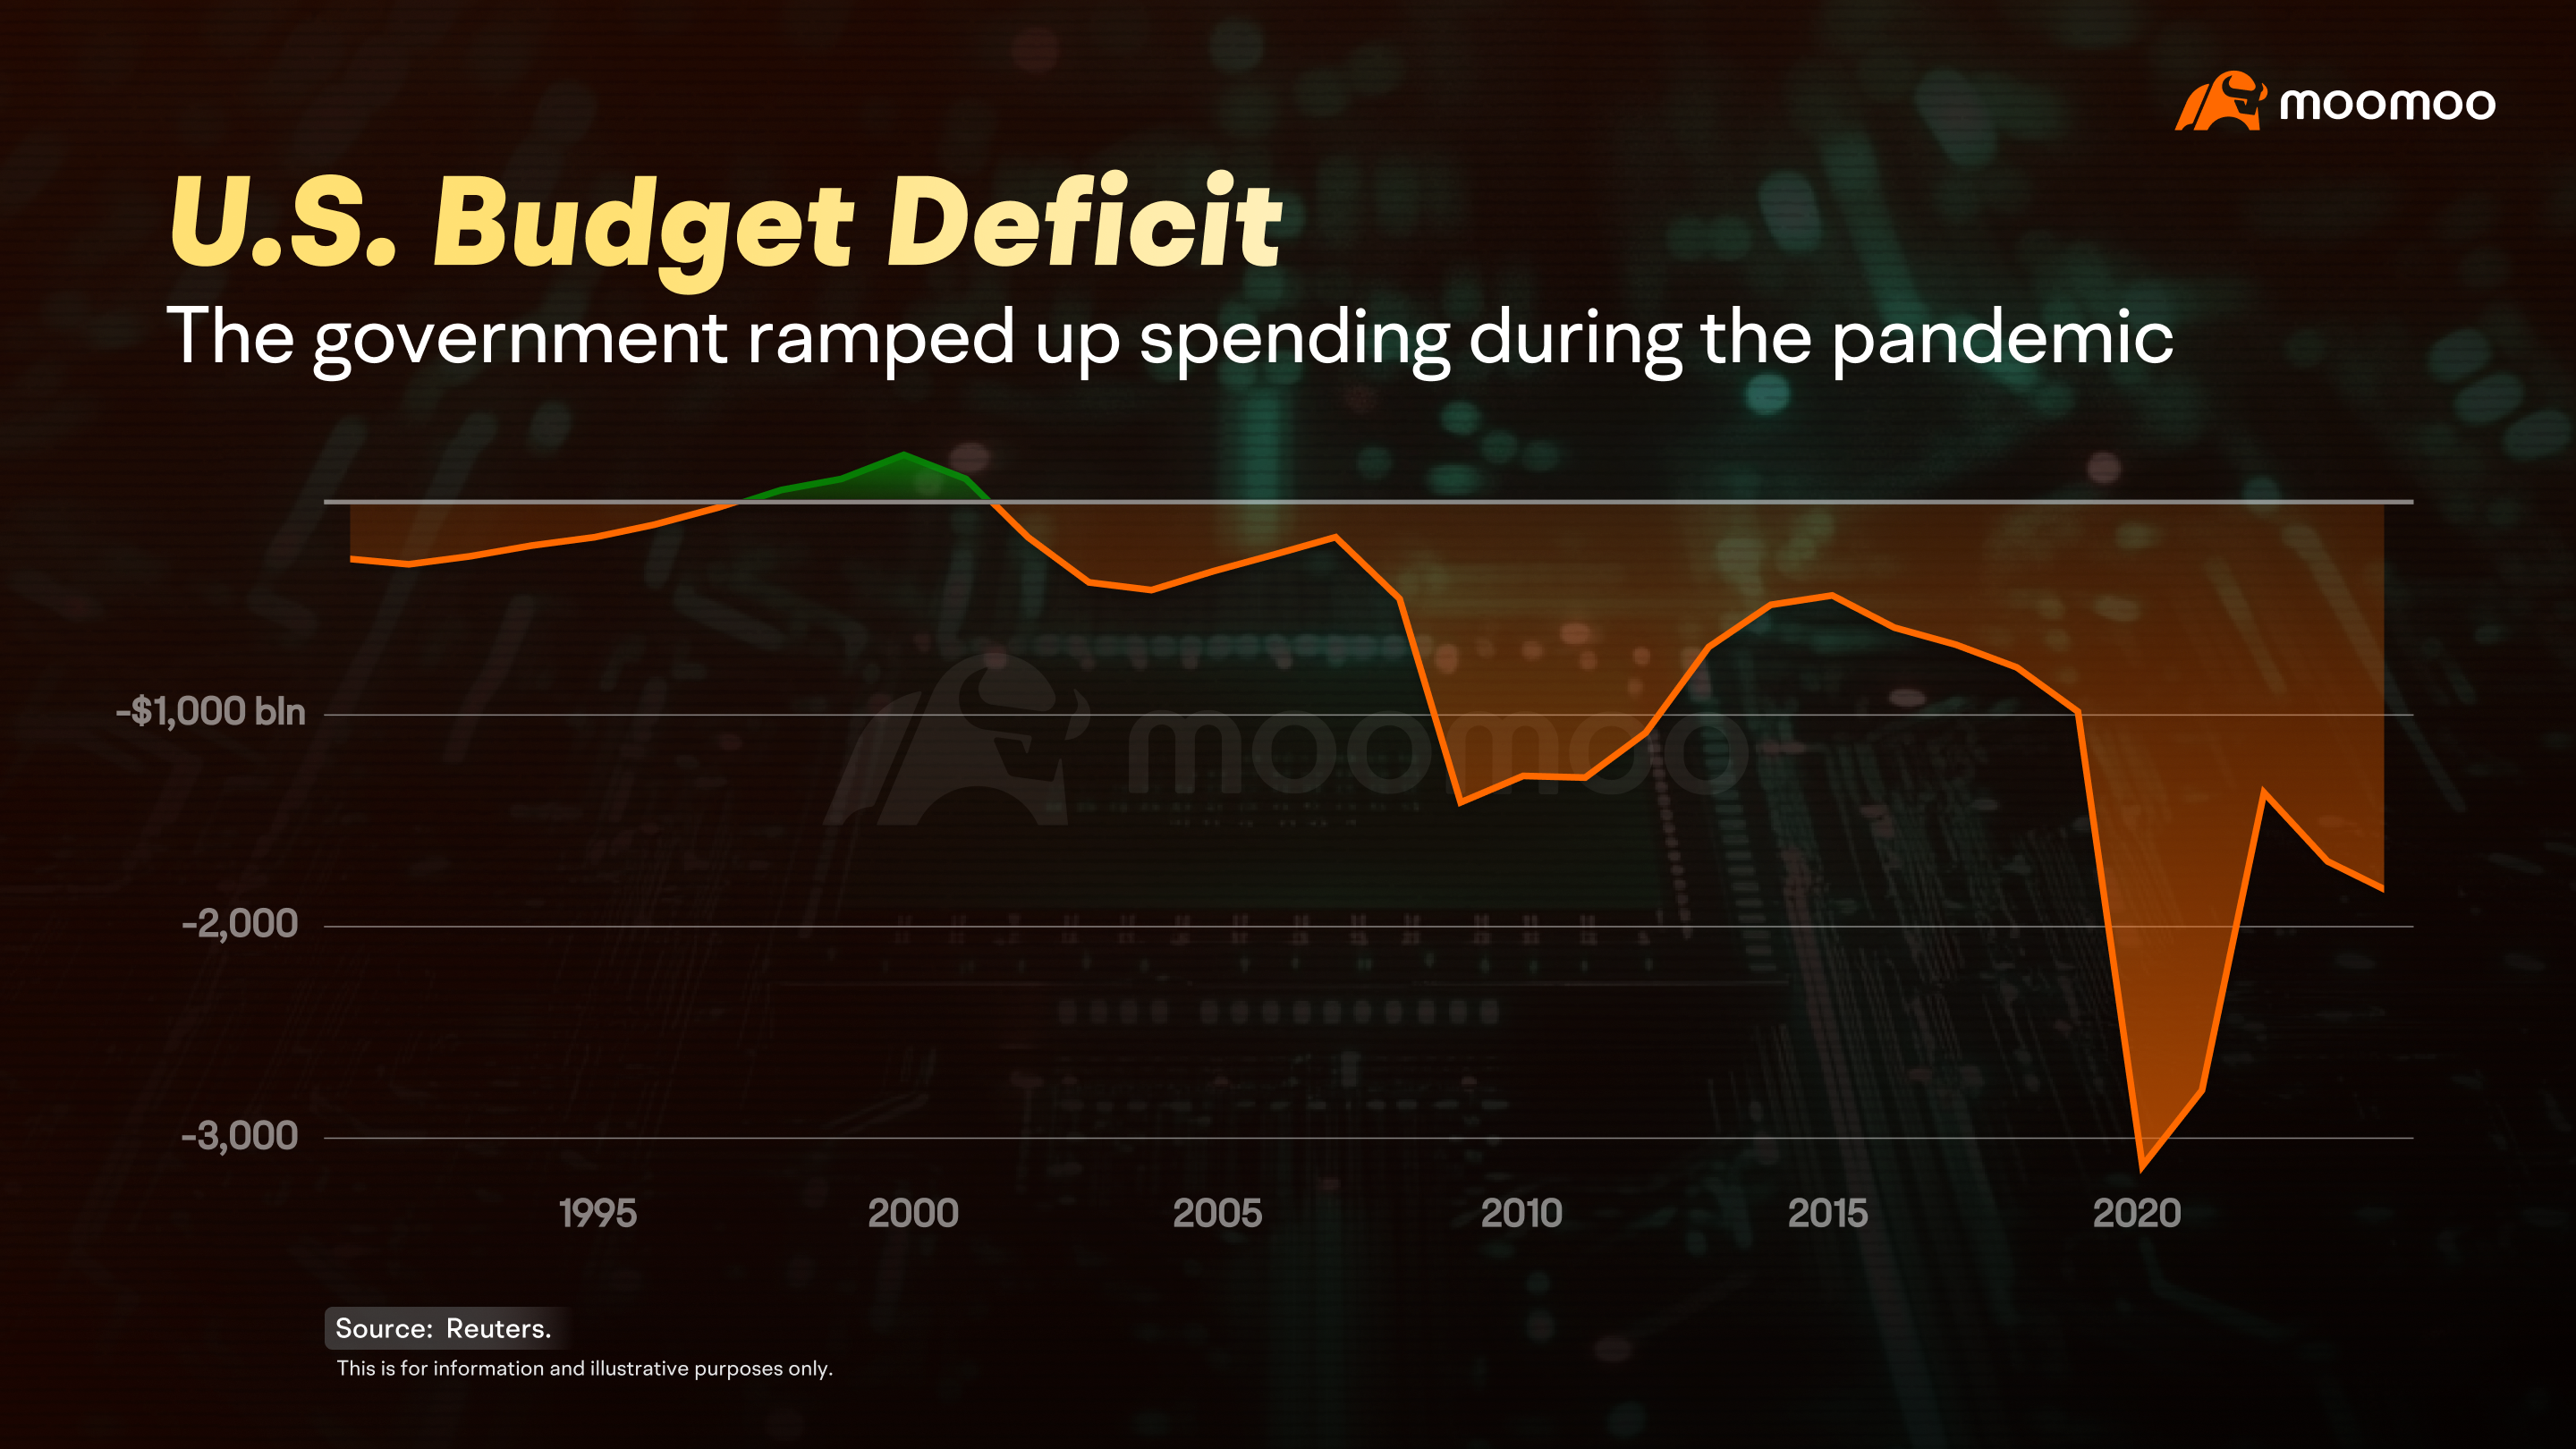
The U.S. government has been racking up debt like it’s on a shopping spree, with only four years of budget surpluses in the past three decades.
In 2020-2021, the government ramped up spending to tackle the economic fallout from the pandemic, ballooning the national debt to staggering levels— tens of trillions.
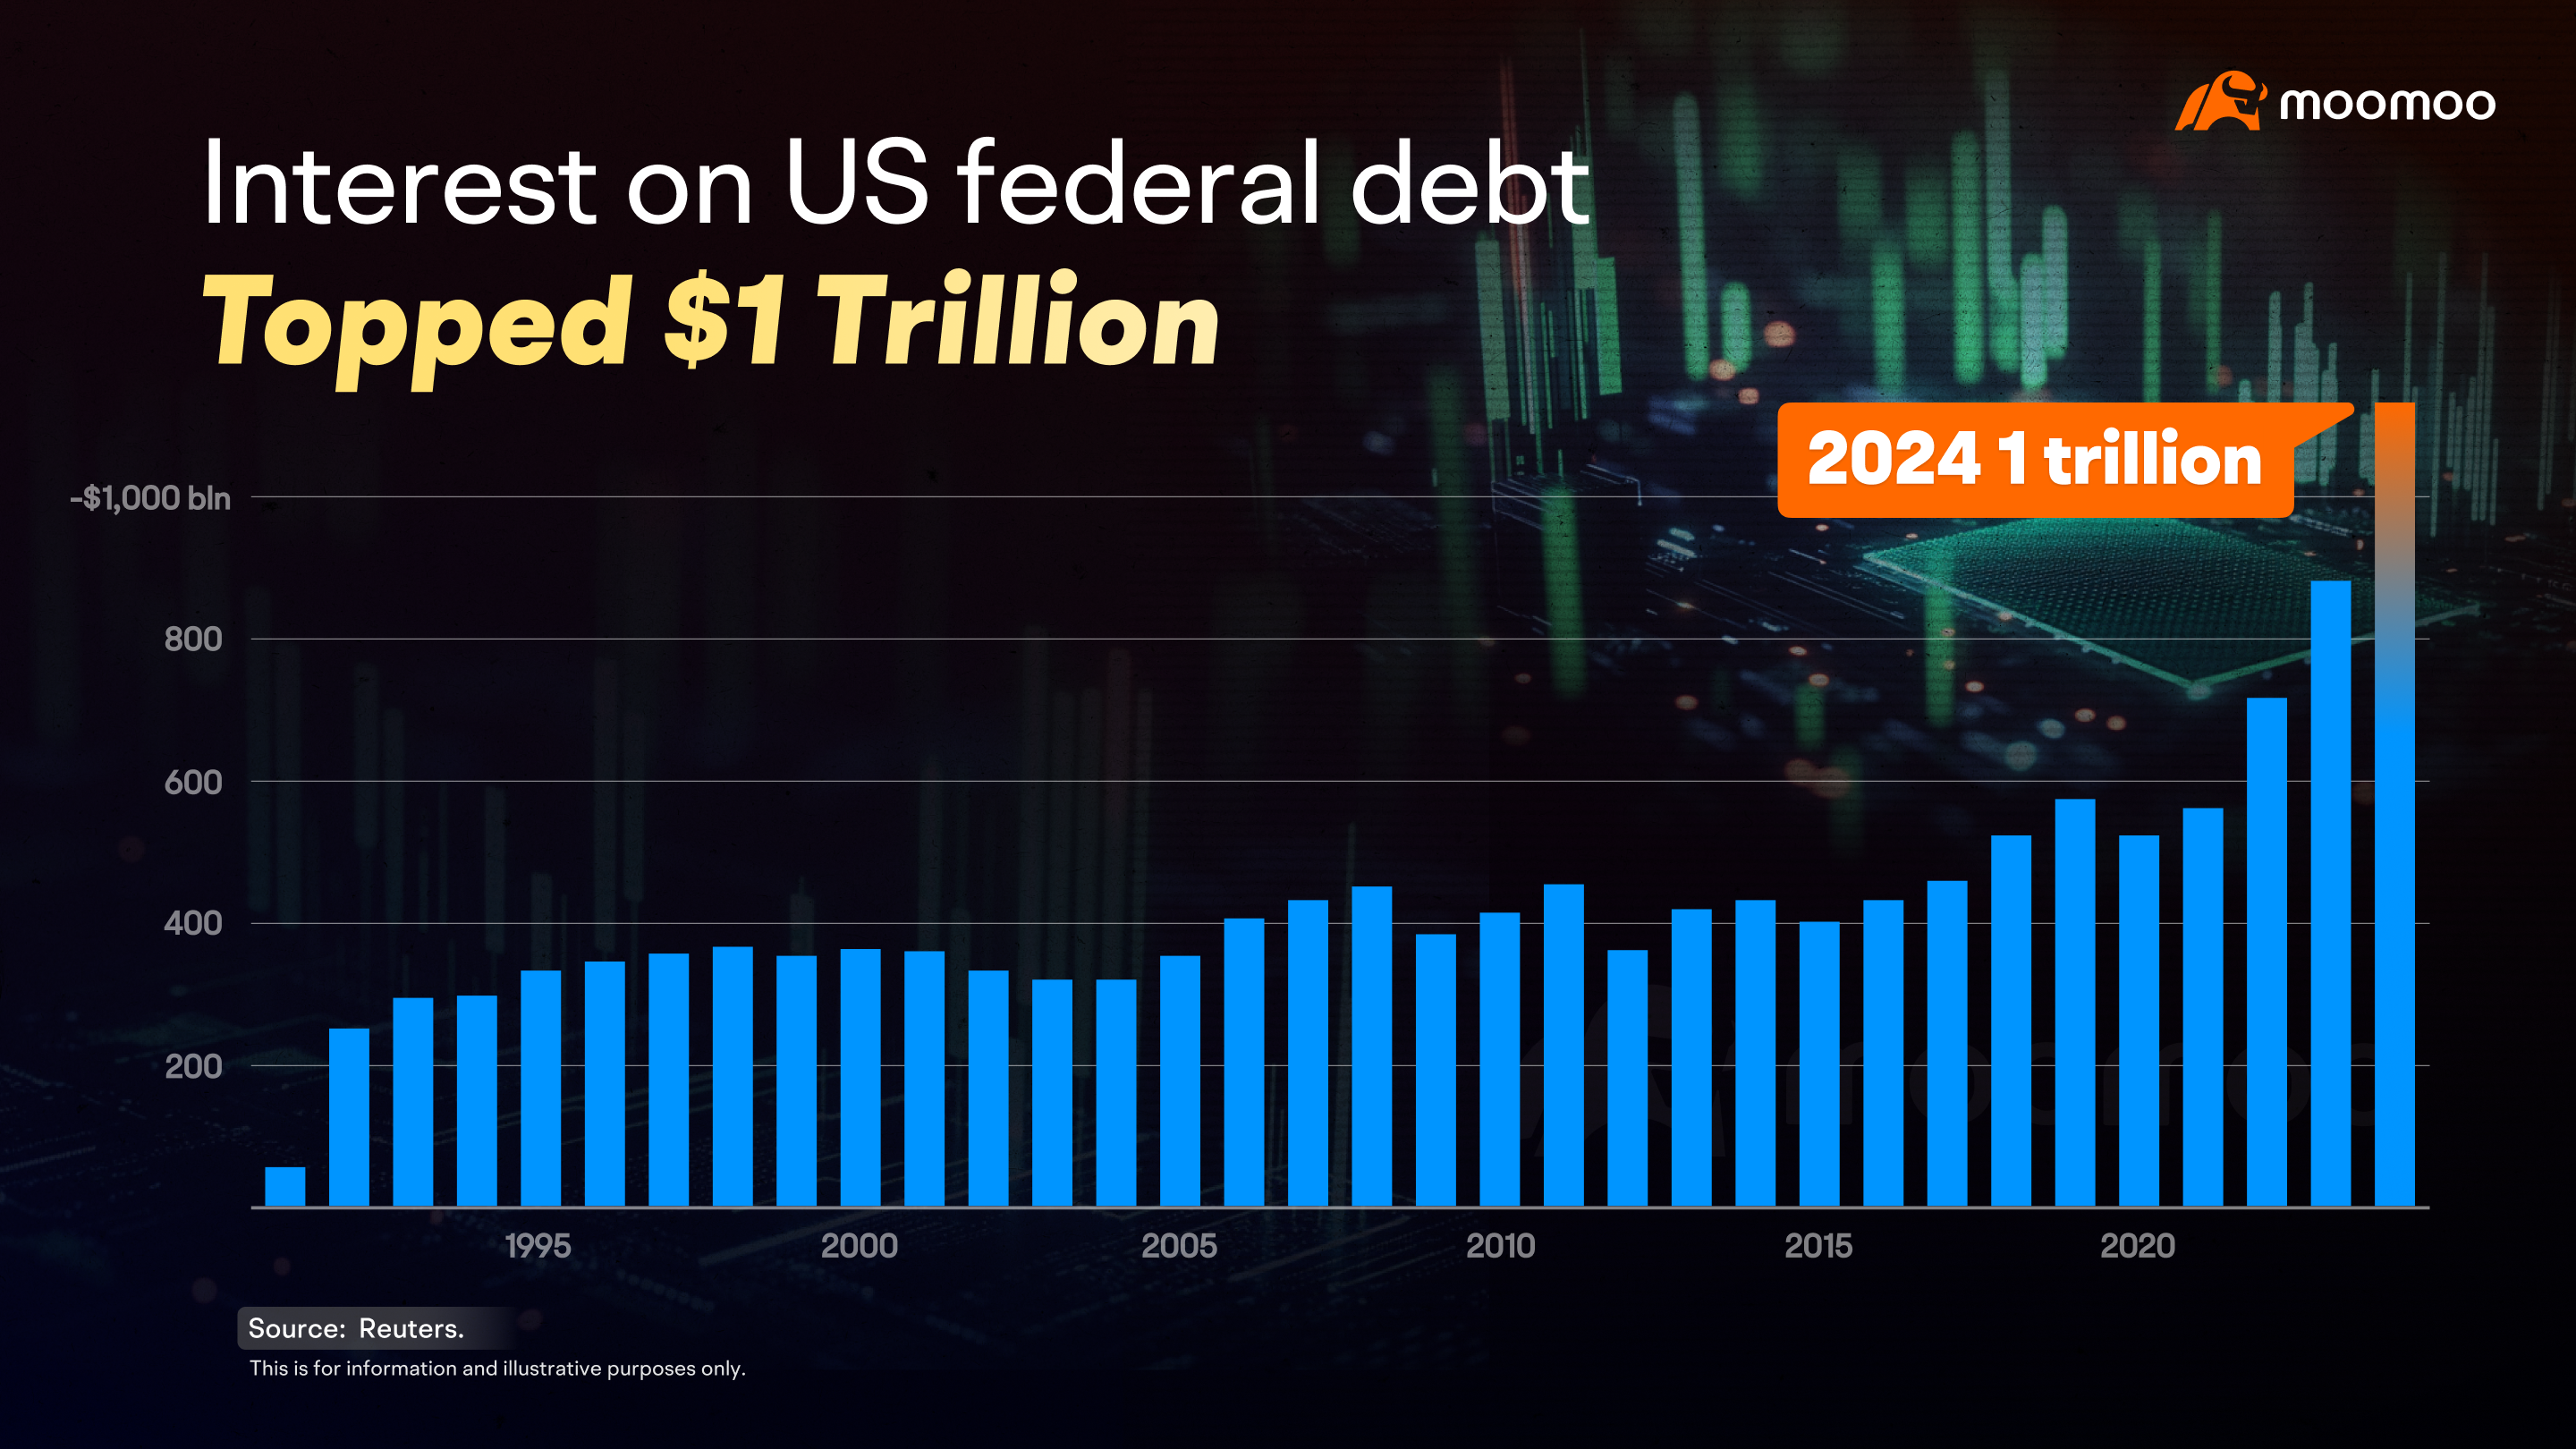
Just the interest payments on this debt hit several hundred billion dollars a year, breaking the $1 trillion mark for the first time in 2024.
The U.S. Constitution mandates that Congress must approve government spending. If Congress doesn’t pass a spending bill, many government departments have to shut down.
This has become a battleground for the two parties. Besides budget issues, hot topics like immigration and healthcare often get thrown into the mix as bargaining chips.
Back in 2013, the Republicans tried to slash the budget in exchange for repealing Obamacare, leading to a shutdown.
Then in 2018, the Democrats pushed back against Trump’s border wall plans, resulting in the longest shutdown yet—from late 2018 to early 2019, lasting 35 days!
You might think that, being one of the largest spenders in the global economy, the U.S. Government grinding to a halt would wreak havoc on the economy and the stock market.
But historically, that’s not the case. Data shows no significant link between government shutdowns and stock market performance since the 1970s.
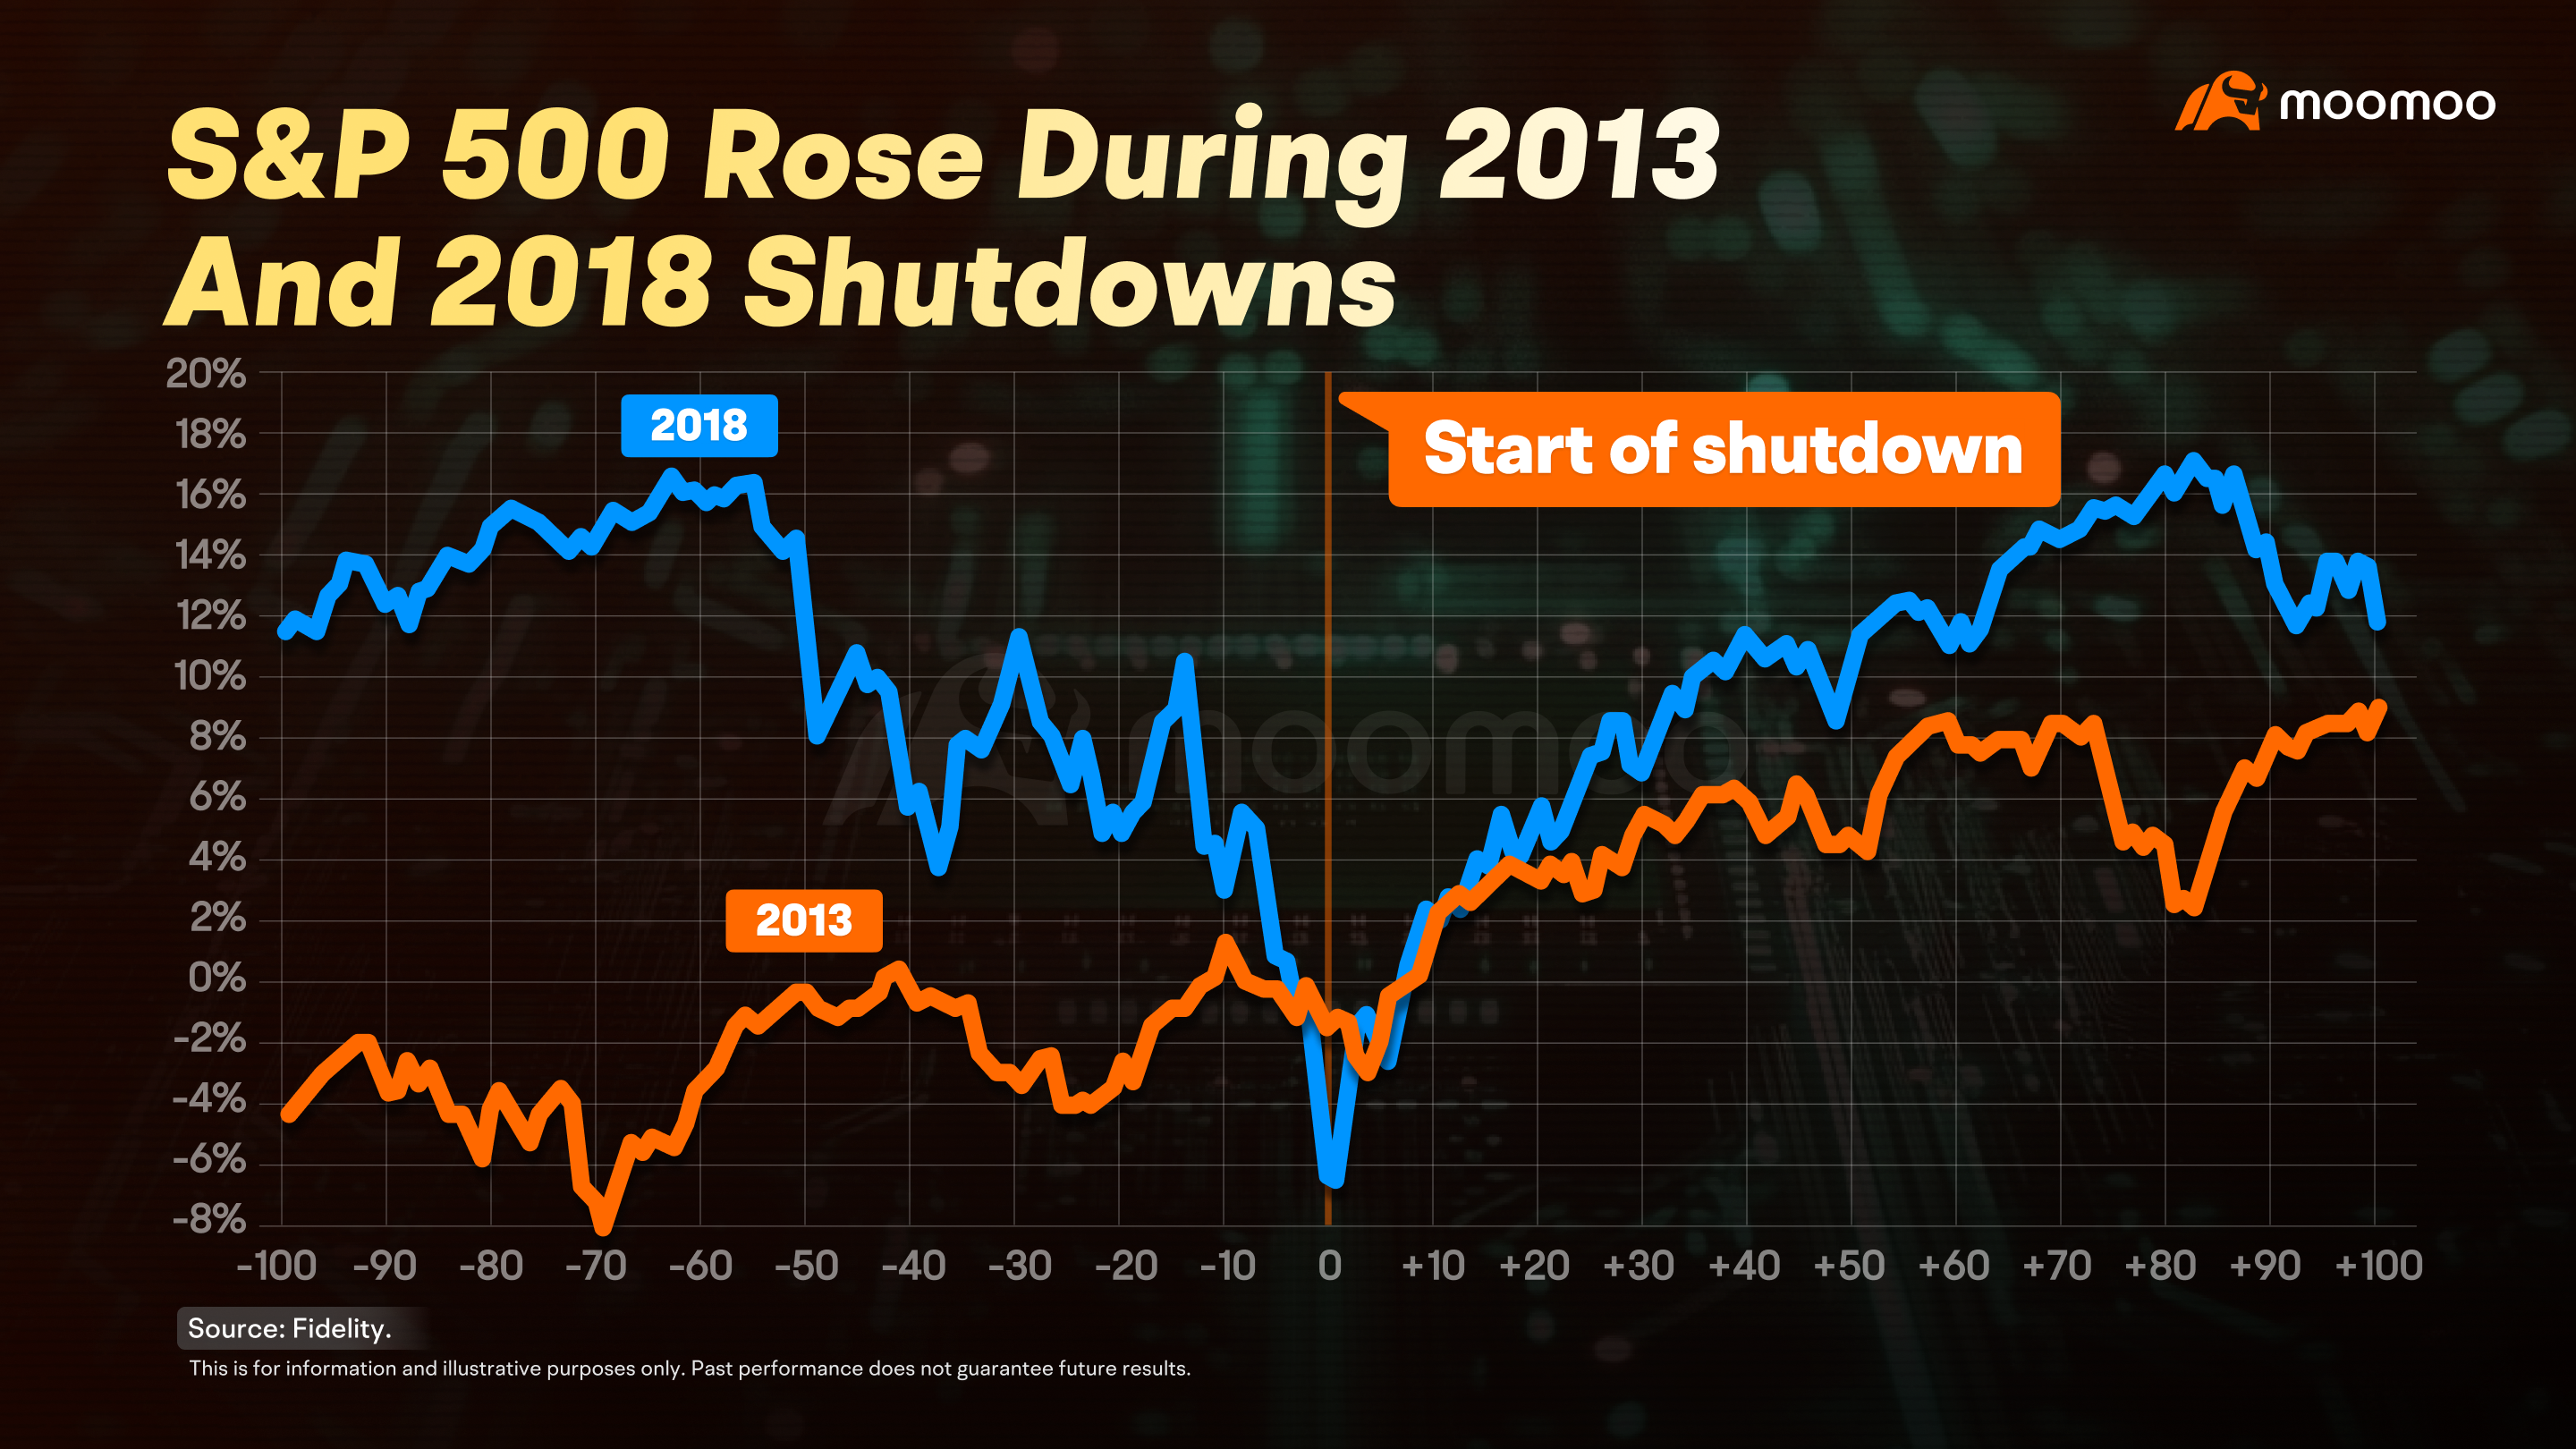
In fact, during the last two shutdowns in 2013 and 2018, the S&P 500 index rose.
Why? During a shutdown, both parties usually buckle under public pressure and reach a compromise, and the market often anticipates this outcome.
Most shutdowns last only a few days, the longest being around a month.
Once the government is back in action, economic output has quickly rebounded.
So, while shutdowns make for dramatic headlines, investors typically don’t lose sleep over them.
Congress set a debt ceiling to rein in government spending. The so-called "X Date" is when the U.S. Treasury runs out of money to pay its bills, unless the debt ceiling is raised.
If this happens, the government could default on its debts, which would have serious economic consequences.
But, spoiler alert, this is more of a guideline than a rule.
As long as the two parties agree, the ceiling can be raised. Since 1960, Congress has upped the debt limit nearly 80 times, making it nearly business as usual.
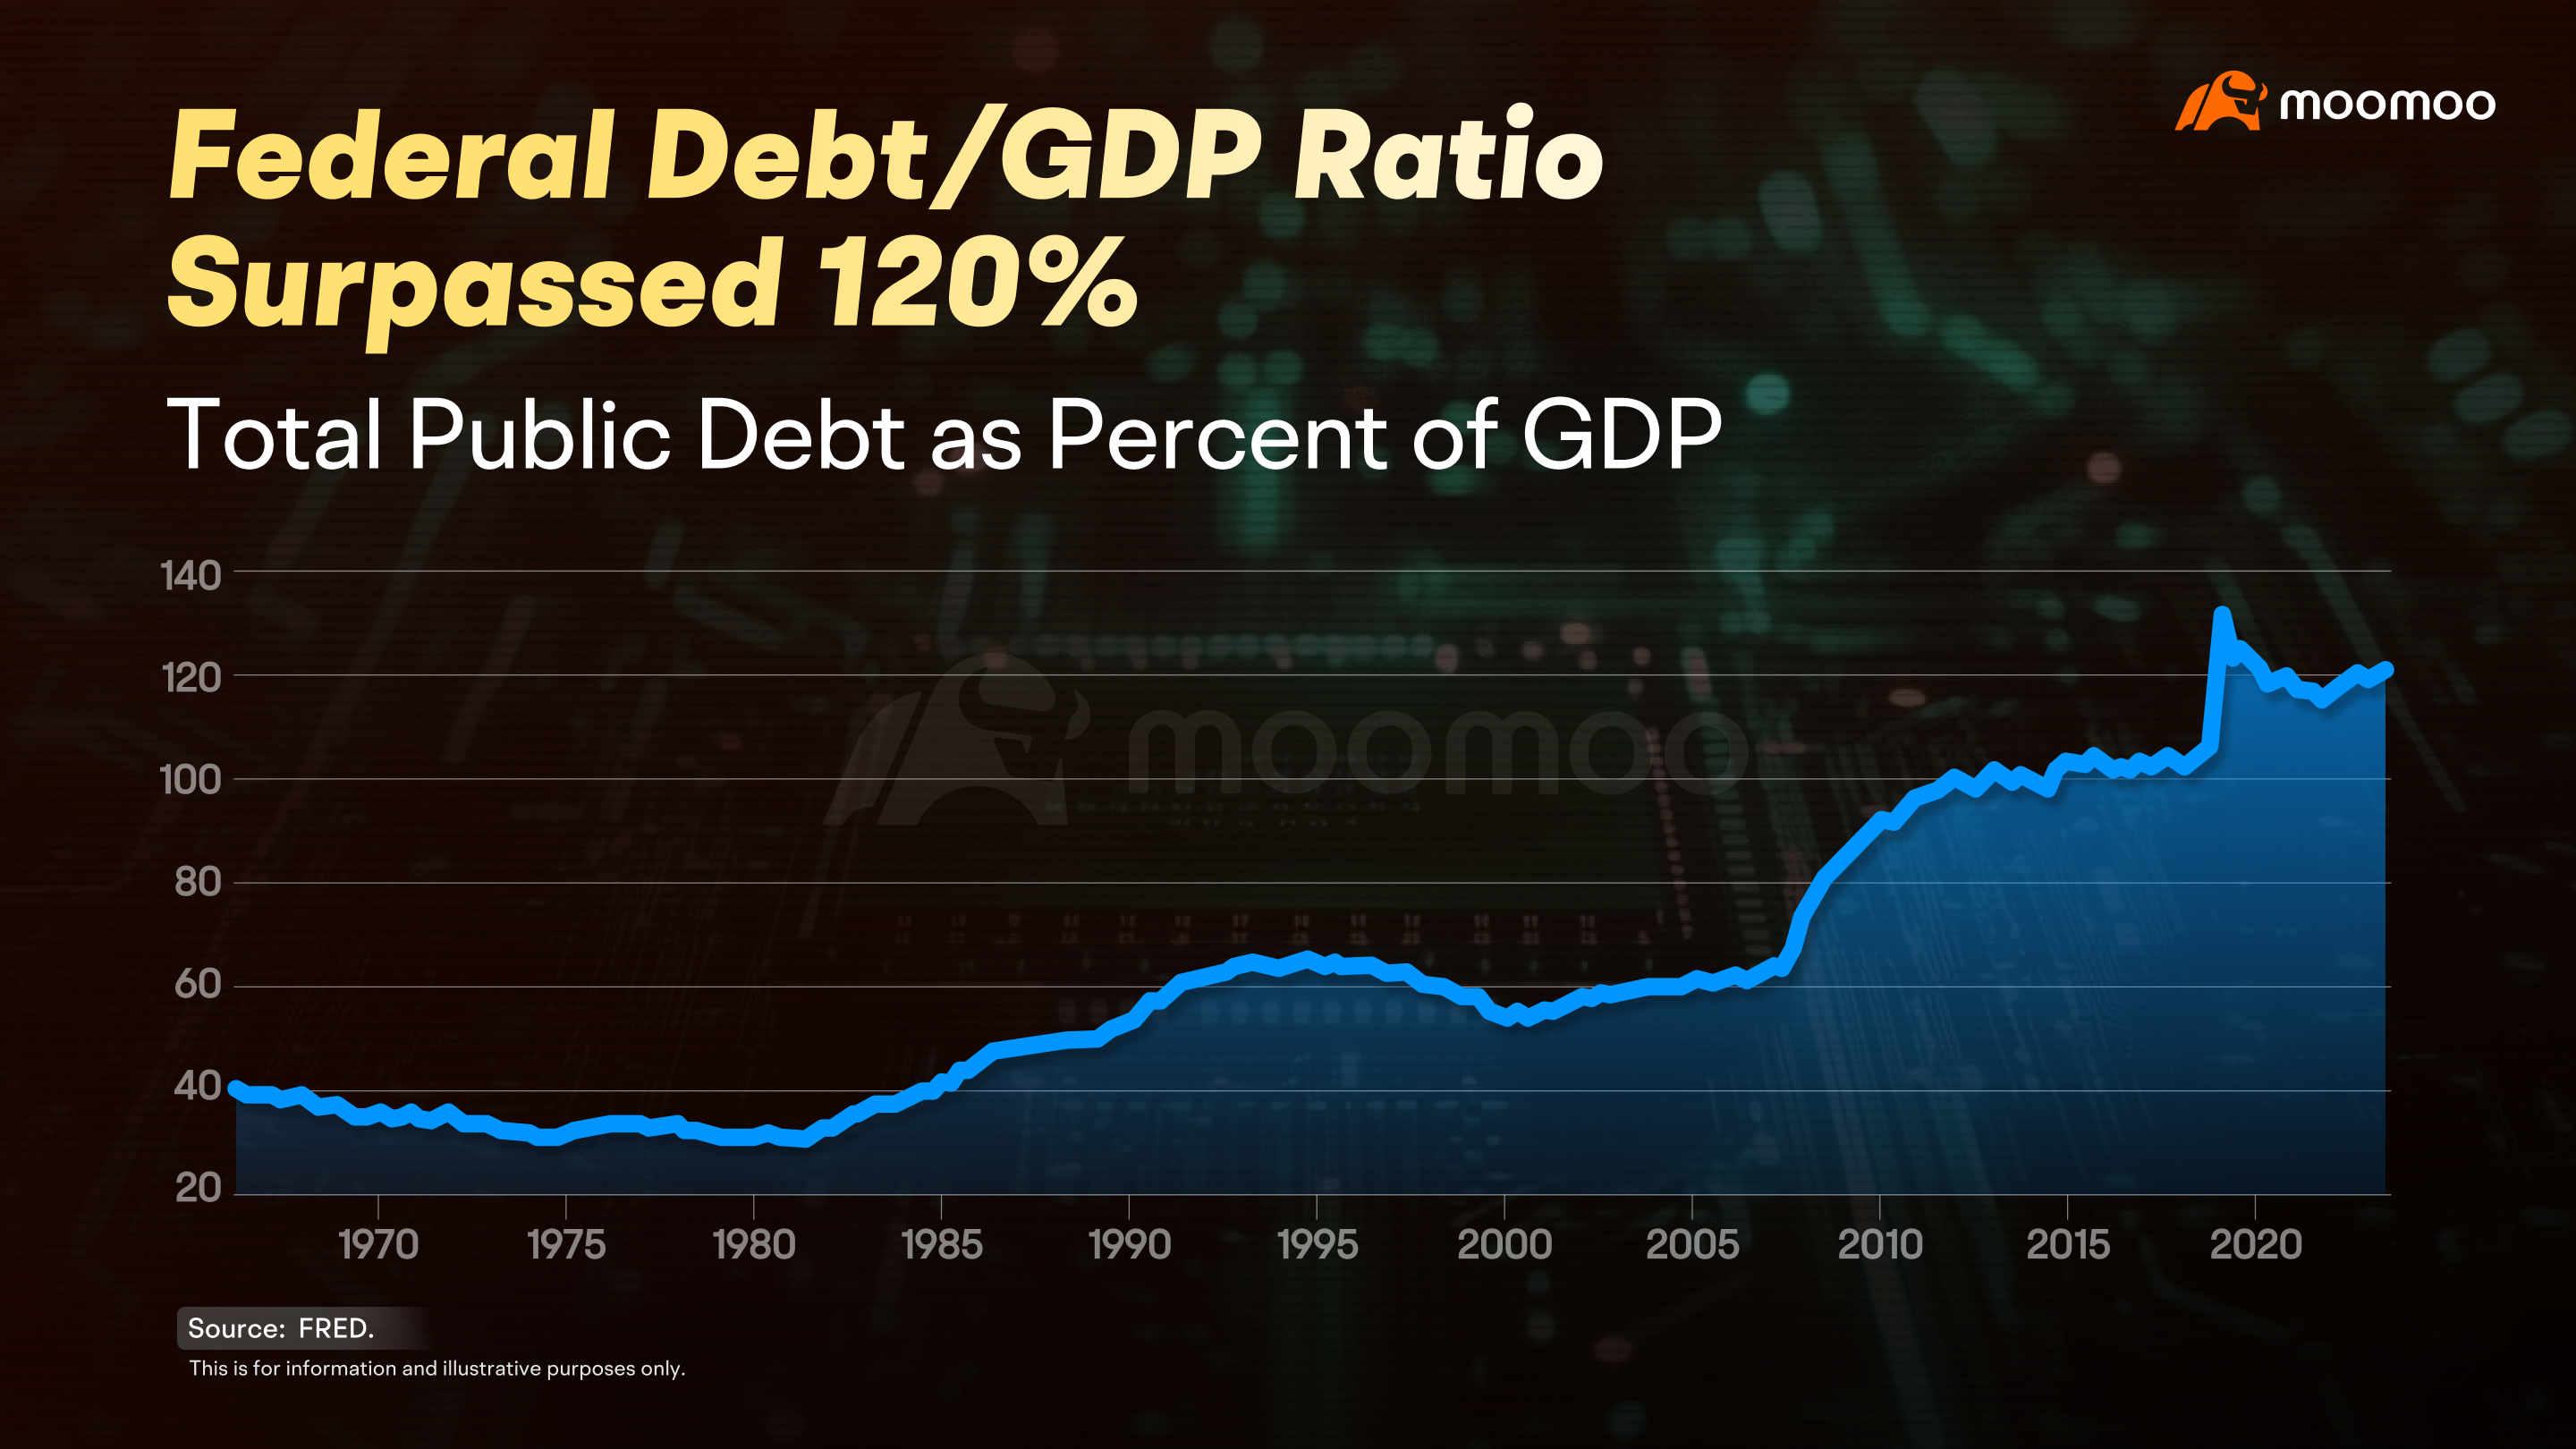
The U.S. government’s debt is now over 120% of GDP. Given America’s global economic might and the dollar hegemony, this hasn’t been a huge problem in the past.
But the rapid growth of government debt has raised eyebrows.
Soros' protégé, renowned hedge fund manager Stan Druckenmiller, warned that ignoring the long-term impact of massive debt is like "worrying about whether a 30-foot wave will damage the pier when you know there's a 200-foot tsunami just 10 miles out."
He cautions that America’s debt issue is nearing a critical state, and if the debt-to-GDP ratio crosses a key threshold, it could trigger systemic risks.
Warren Buffett, the Oracle of Omaha, said at the 2025 Berkshire Hathaway annual meeting:
"We’re operating at a fiscal deficit now that is unsustainable over a very long period of time. We don’t know whether that means two years or 20 years, because there’s never been a country like the United States. But you know, this is something that can’t go on forever... and it has the aspect to it that it gets uncontrollable at a certain point."
This presentation is for informational and educational use only and is not a recommendation or endorsement of any particular investment or investment strategy. Investment information provided in this content is general in nature, strictly for illustrative purposes, and may not be appropriate for all investors. Read more
Recommend
Why does Warren Buffett say don't piggyback on his trades?

How does nonfarm payroll impact the global market?
Unveiling Inflation: Why is Your Wallet Shrinking?

Mastering the Dollar Cycle: How to invest in a changing economy
Gold vs. Gold Miners: A Comparison
Are U.S. Treasuries still a safe haven?
Meet Dr. Copper: Understanding the Copper Market
Do Oil Price Swings Rock the Stock Market?
How Tariffs Could Impact the Copper Landscape?
Why do oil ETFs lag behind oil prices in the long run?
Why is the US dollar so powerful worldwide, and how can we tell?
A look at employment: what other indicators are there?
GDP: The Barometer of National Prosperity
Understanding Treasury Auctions: A Step-by-Step Guide
Unpacking the U.S. Debt Issue
Why is Oil Called the "Mother of All Commodities"?
How Inflation Affects the Market
How to interpret the Fed dot plot?
How to Decode Inflation: CPI, PCE, and PPI
Understanding Bessent's Fiscal Blueprint
The Rise of the Fed: Can Trump Dismiss Powell?
What's in the Fed's Toolbox?
'Oracle of Omaha' Warren Buffett:ROE>20% is preferable
'Father of value investing' Benjamin Graham: Ten Stock Selection Criteria
Strong Consumer Spending Despite Economic Slowdown: Here's Why
Analyzing the manufacturing industry may help you grasp economic trends
What is the Debt Ceiling? A Deep Dive into US Fiscal Policy
How to Preserve Your Wealth in a High Inflation Environment
How to analyze the Federal Reserve's monetary policy?
Rapidly Rising US Housing Prices: Opportunity or Risk?
How Will the US Dollar Perform in 2024? A Closer Look into the US Dollar Index
Discussing the driving forces behind rises in gold prices
Investing and Labor Market Indicators
Discover the bond market: A quick and easy guide
The Underlying Conflicts Surrounding Crude Oil Prices
Understanding the relationship between the stock market and the bond market
Understanding the US Non-Farm Payroll Data
Understanding the Federal Reserve Interest Rate Decision
Understanding the CCI
Understanding the PPI
Understanding the Retail Sales
Understanding the US Crude Oil Inventories
Understanding the Durable Goods Orders
Listen to the Fed's speakers: Hawks or doves?
Open the Fed's monetary policy toolbox
The Fed Dot Plot explained: What it says about US interest rates
How does monetary policy steer our lives and investment
What the Federal Reserve does?
Understanding the GDP
A brief history lesson on the Fed and U.S. economy
08 Carl Icahn & Icahn Enterprises
09 Seth Klarman & Baupost Group
07 Howard Marks & Oaktree Capital
01 Using 13F filings to learn from big investors
03 How to Read Form 13F
02 Identify a fund's investment strategy
04 Warren Buffett & Berkshire Hathaway
06 Ray Dalio & Bridgewater Associates
05 Bill Ackerman & Pershing Square Capital
Why does Warren Buffett say don't piggyback on his trades?
How does nonfarm payroll impact the global market?
Unveiling Inflation: Why is Your Wallet Shrinking?
Mastering the Dollar Cycle: How to invest in a changing economy
Gold vs. Gold Miners: A Comparison
Are U.S. Treasuries still a safe haven?
Meet Dr. Copper: Understanding the Copper Market
Do Oil Price Swings Rock the Stock Market?
How Tariffs Could Impact the Copper Landscape?
Why do oil ETFs lag behind oil prices in the long run?
Why is the US dollar so powerful worldwide, and how can we tell?
A look at employment: what other indicators are there?
GDP: The Barometer of National Prosperity
Understanding Treasury Auctions: A Step-by-Step Guide
Unpacking the U.S. Debt Issue
Why is Oil Called the "Mother of All Commodities"?
How Inflation Affects the Market
How to interpret the Fed dot plot?
How to Decode Inflation: CPI, PCE, and PPI
Understanding Bessent's Fiscal Blueprint
The Rise of the Fed: Can Trump Dismiss Powell?
What's in the Fed's Toolbox?
'Oracle of Omaha' Warren Buffett:ROE>20% is preferable
'Father of value investing' Benjamin Graham: Ten Stock Selection Criteria
Strong Consumer Spending Despite Economic Slowdown: Here's Why
Analyzing the manufacturing industry may help you grasp economic trends
What is the Debt Ceiling? A Deep Dive into US Fiscal Policy
How to Preserve Your Wealth in a High Inflation Environment
How to analyze the Federal Reserve's monetary policy?
Rapidly Rising US Housing Prices: Opportunity or Risk?
How Will the US Dollar Perform in 2024? A Closer Look into the US Dollar Index
Discussing the driving forces behind rises in gold prices
Investing and Labor Market Indicators
Discover the bond market: A quick and easy guide
The Underlying Conflicts Surrounding Crude Oil Prices
Understanding the relationship between the stock market and the bond market
Understanding the US Non-Farm Payroll Data
Understanding the Federal Reserve Interest Rate Decision
Understanding the CCI
Understanding the PPI
Understanding the Retail Sales
Understanding the US Crude Oil Inventories
Understanding the Durable Goods Orders
Listen to the Fed's speakers: Hawks or doves?
Open the Fed's monetary policy toolbox
The Fed Dot Plot explained: What it says about US interest rates
How does monetary policy steer our lives and investment
What the Federal Reserve does?
Understanding the GDP
A brief history lesson on the Fed and U.S. economy
08 Carl Icahn & Icahn Enterprises
09 Seth Klarman & Baupost Group
07 Howard Marks & Oaktree Capital
01 Using 13F filings to learn from big investors
03 How to Read Form 13F
02 Identify a fund's investment strategy
04 Warren Buffett & Berkshire Hathaway
06 Ray Dalio & Bridgewater Associates
05 Bill Ackerman & Pershing Square Capital

