
Moomoo Insights
Jul 16 15:38
TSMC Earnings: AI Demand Is Stronger Than the Chip Selloff Suggests
Moomoo Insights
Sep 30 05:04
Live Take | Anthropic’s $518B Compute Bet: Who Wins From the AI Buildout?
We often see art auctions, but you might not know that the way the U.S. issues Treasury bonds is quite similar.
Imagine buyers and sellers haggling over prices, only this time, we're talking about billions of dollars in government bonds, not artwork.
The U.S. Treasury regularly holds these auctions, and the outcomes can shake up the bond market and even rattle the stock market.
In this macro session, we'll explore the ins and outs of Treasury auctions, what to watch for, and how these events can send ripples across the financial landscape.
Takeaways:
Treasury auctions use a "Dutch auction" system, which differs from the typical auction format used in art sales.
Key indicators, such as the yield and bid-to-cover ratio, reveal the strength of demand for Treasuries.
A weak auction can not only stir up the bond market but also impact stock performance.
Art auctions are straightforward—one masterpiece, multiple bidders, and the highest offer takes it home.
Treasury auctions, however, are a bit different: they use a "Dutch auction" method.
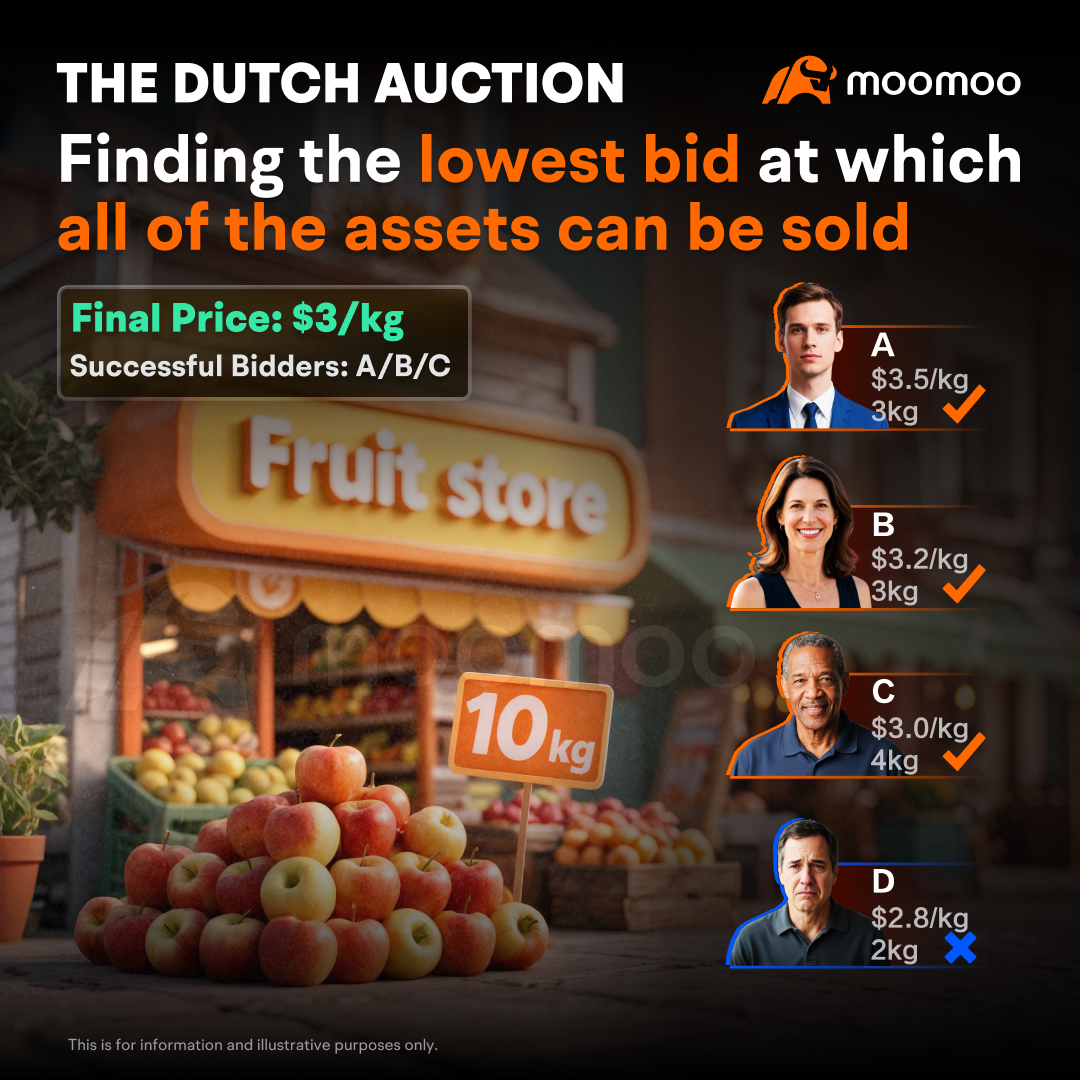
Picture this: a fruit shop has 10kg of apples for sale. Four customers want in.
Customer A bids $3.50/kg for 3kg, Customer B offers $3.20/kg for 3kg, Customer C goes for $3/kg for 4kg, and Customer D is in at $2.80/kg for 2kg.
The shop satisfies A, B, and C at the lowest price that meets the 10kg supply, at $3/kg. D misses out.
Additionally, if C wanted more than 4kg during the bidding process, he/she would only be allocated 4kg, because the store prioritizes fulfilling the quantities of those who bid higher.
This Dutch method efficiently handles massive bids, with a single price simplifying settlement. It is ideal for those multi-billion-dollar Treasury issuances.
Now let's review bond basics.
In bonds, price and yield are like a seesaw—when one goes up, the other goes down. Suppose you've got a bond with a 3% coupon.
If new bonds hit the market at 4%, yours needs a price cut so its yield matches the new ones.
Treasury Auction results list yields, where the Treasury sets a rate that clears all bonds at the highest yield (lowest price) to bidders.
Back to our apple sale: if the price hits $4/kg or all buyers want 20kg or more, that's a hot commodity.
For Treasuries, demand is determined by institutional investors, foreign central banks, and everyday investors.
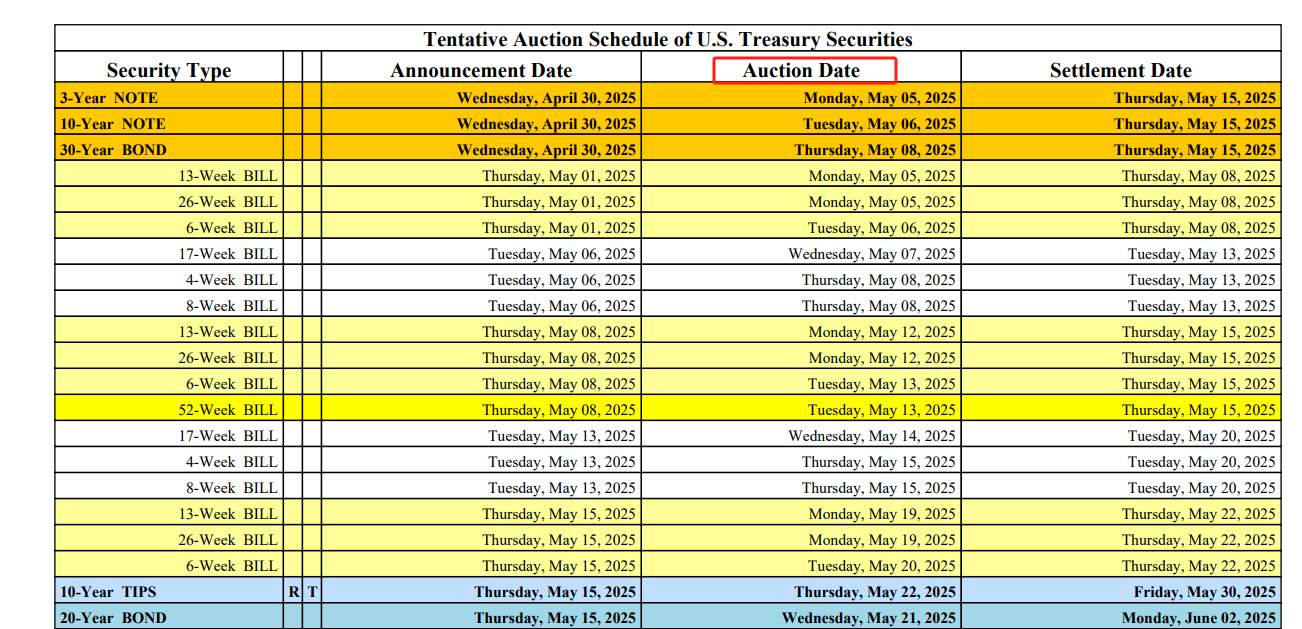
The Treasury posts auction schedules, and results are public. You can check them out on the TreasuryDirect website.
Source: TreasuryDirect. This is for information and illustrative purposes only.
Tentative Auction Schedule:
Short-term Treasury bills, which fund short-term government needs, auction weekly and barely nudge the market.
Longer-term Treasuries, auctioned monthly or quarterly, draw more attention.
The schedule includes three dates: announcement date, auction date, and settlement date.
On the announcement date, the Treasury reveals the total amount of Treasuries to be auctioned; higher amounts for the same maturity can have a greater market impact.
On the auction date, the winning interest rates and allocation results are announced.
On the settlement date, bidders pay for their bonds, which are added to their accounts and begin accruing interest.
The auction date is the most crucial.
Auction Results:
Around 1:00 PM Eastern Time on auction day, the results drop.
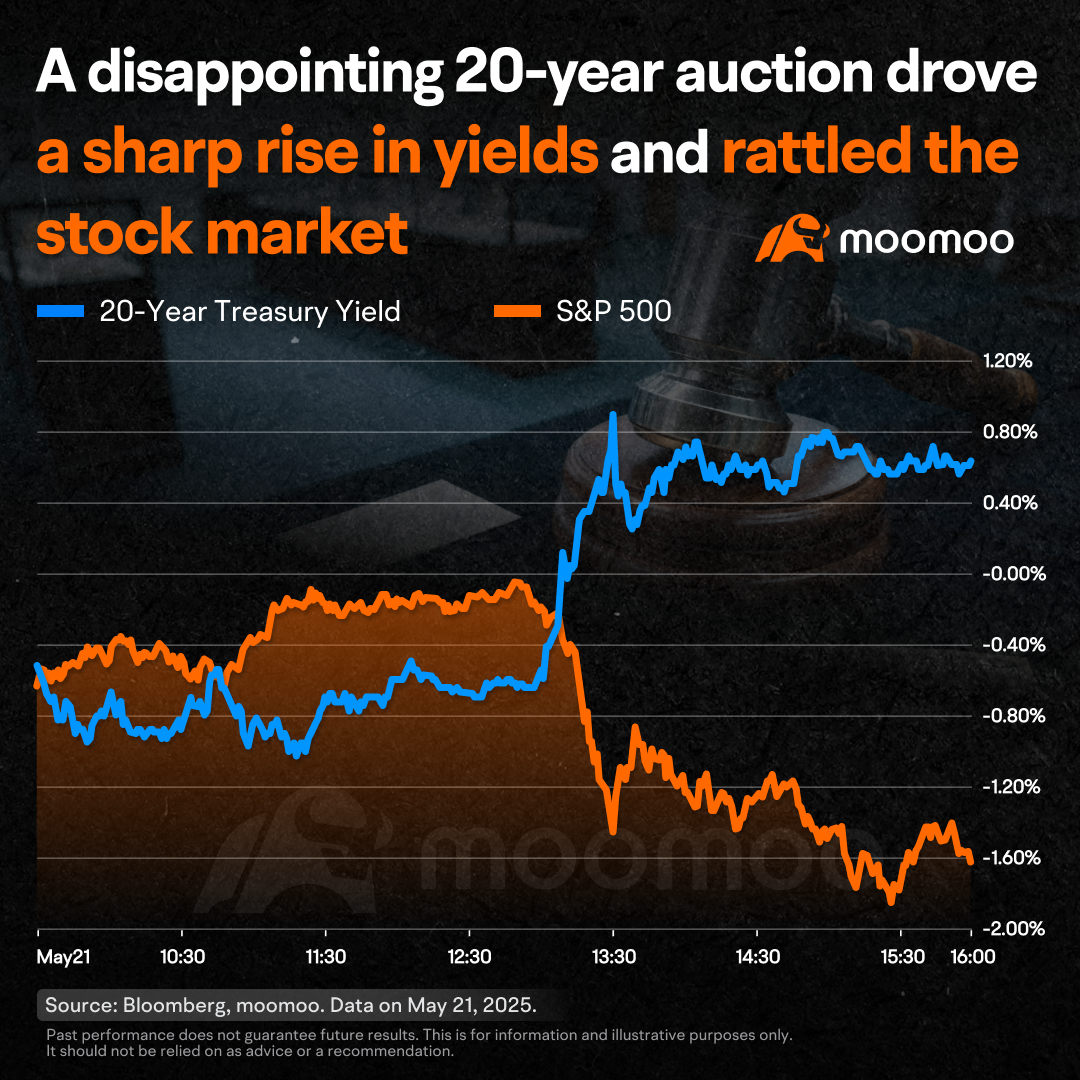
Take the May 21, 2025, auction of $16 billion in 20-year bonds: it fetched a 5.047% yield, surpassing 5% and topping pre-auction yields.
The bid-to-cover ratio of 2.46 was the lowest since February, down from 2.63.
The ratio provides insight into the interest from investors compared to the treasuries offered for sale.
This auction totaled $16 billion, and the bid-to-cover ratio was 2.46, which means that all participants collectively submitted $39.36 billion in purchase requests.
The higher this ratio, the stronger the demand would be for the auction, whereas a lower ratio could indicate lukewarm interest.
Overall, this indicated softened demand.
Once the result came in, the 20-year Treasury yield spiked, lifting yields across the board and sending stocks south—the S&P 500 dipped 1.6%.
Why the spillover?
Treasuries are highly liquid, backed by the world's largest economy, and often viewed as the global "risk-free rate" of returns. An increase in the risk-free rate means that future cash flows are worth less in today's money, lowering stock valuations.
Higher rates also raise corporate borrowing costs, impacting profits. Additionally, this Treasury auction highlighted investor concerns about U.S. fiscal conditions, amplifying market volatility.
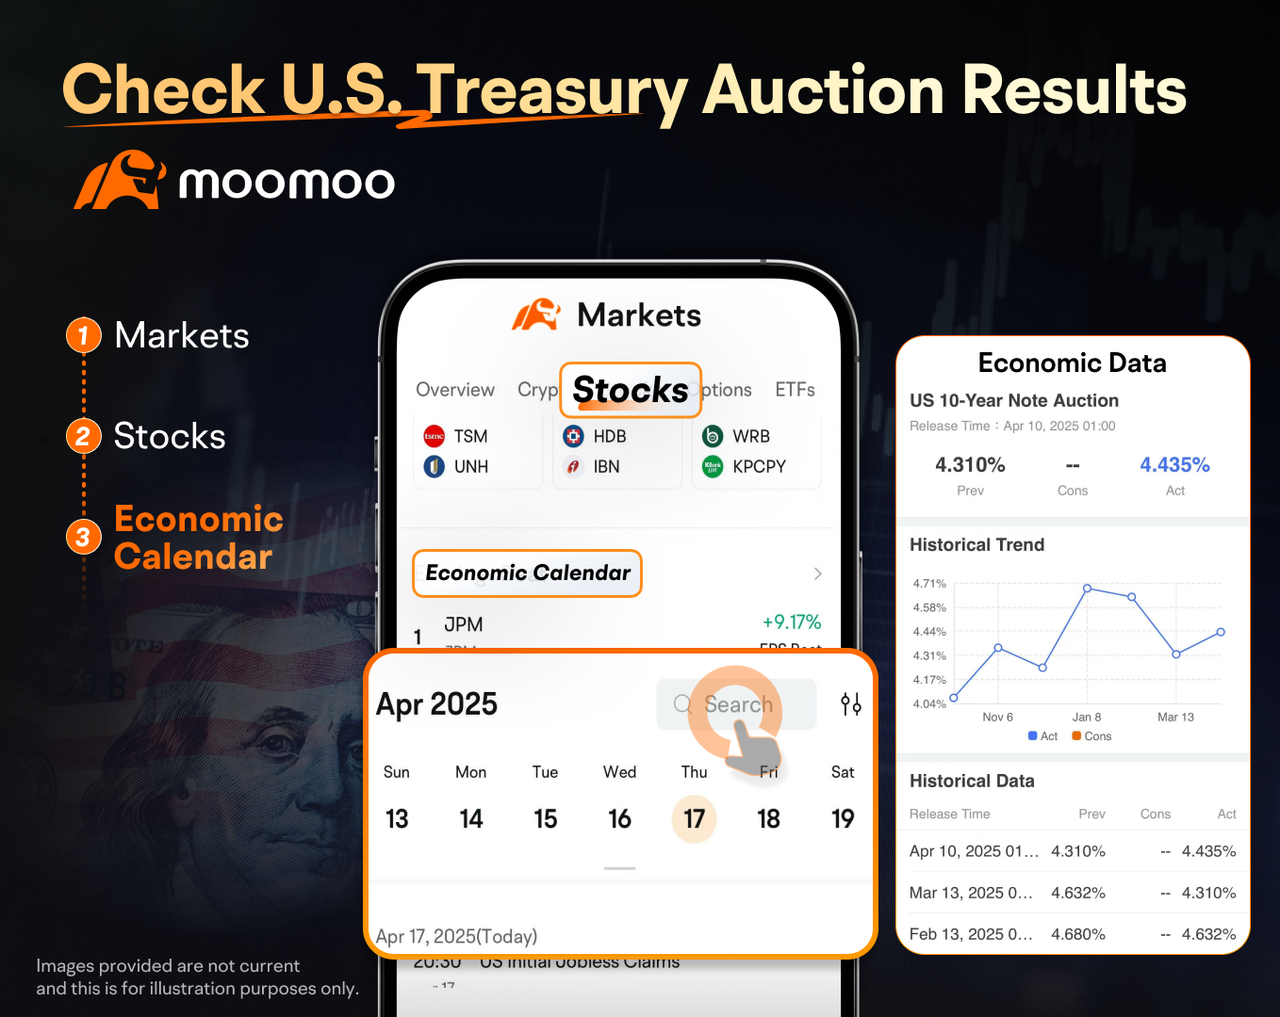
In addition to the U.S. Treasury's website, you can also check Treasury auction results directly on moomoo.
This presentation is for informational and educational use only and is not a recommendation or endorsement of any particular investment or investment strategy. Investment information provided in this content is general in nature, strictly for illustrative purposes, and may not be appropriate for all investors. Read more
Recommend
Why does Warren Buffett say don't piggyback on his trades?

How does nonfarm payroll impact the global market?
Unveiling Inflation: Why is Your Wallet Shrinking?

Mastering the Dollar Cycle: How to invest in a changing economy
Gold vs. Gold Miners: A Comparison
Are U.S. Treasuries still a safe haven?
Meet Dr. Copper: Understanding the Copper Market
Do Oil Price Swings Rock the Stock Market?
How Tariffs Could Impact the Copper Landscape?
Why do oil ETFs lag behind oil prices in the long run?
Why is the US dollar so powerful worldwide, and how can we tell?
A look at employment: what other indicators are there?
GDP: The Barometer of National Prosperity
Understanding Treasury Auctions: A Step-by-Step Guide
Unpacking the U.S. Debt Issue
Why is Oil Called the "Mother of All Commodities"?
How Inflation Affects the Market
How to interpret the Fed dot plot?
How to Decode Inflation: CPI, PCE, and PPI
Understanding Bessent's Fiscal Blueprint
The Rise of the Fed: Can Trump Dismiss Powell?
What's in the Fed's Toolbox?
'Oracle of Omaha' Warren Buffett:ROE>20% is preferable
'Father of value investing' Benjamin Graham: Ten Stock Selection Criteria
Strong Consumer Spending Despite Economic Slowdown: Here's Why
Analyzing the manufacturing industry may help you grasp economic trends
What is the Debt Ceiling? A Deep Dive into US Fiscal Policy
How to Preserve Your Wealth in a High Inflation Environment
How to analyze the Federal Reserve's monetary policy?
Rapidly Rising US Housing Prices: Opportunity or Risk?
How Will the US Dollar Perform in 2024? A Closer Look into the US Dollar Index
Discussing the driving forces behind rises in gold prices
Investing and Labor Market Indicators
Discover the bond market: A quick and easy guide
The Underlying Conflicts Surrounding Crude Oil Prices
Understanding the relationship between the stock market and the bond market
Understanding the US Non-Farm Payroll Data
Understanding the Federal Reserve Interest Rate Decision
Understanding the CCI
Understanding the PPI
Understanding the Retail Sales
Understanding the US Crude Oil Inventories
Understanding the Durable Goods Orders
Listen to the Fed's speakers: Hawks or doves?
Open the Fed's monetary policy toolbox
The Fed Dot Plot explained: What it says about US interest rates
How does monetary policy steer our lives and investment
What the Federal Reserve does?
Understanding the GDP
A brief history lesson on the Fed and U.S. economy
08 Carl Icahn & Icahn Enterprises
09 Seth Klarman & Baupost Group
07 Howard Marks & Oaktree Capital
01 Using 13F filings to learn from big investors
03 How to Read Form 13F
02 Identify a fund's investment strategy
04 Warren Buffett & Berkshire Hathaway
06 Ray Dalio & Bridgewater Associates
05 Bill Ackerman & Pershing Square Capital
Why does Warren Buffett say don't piggyback on his trades?
How does nonfarm payroll impact the global market?
Unveiling Inflation: Why is Your Wallet Shrinking?
Mastering the Dollar Cycle: How to invest in a changing economy
Gold vs. Gold Miners: A Comparison
Are U.S. Treasuries still a safe haven?
Meet Dr. Copper: Understanding the Copper Market
Do Oil Price Swings Rock the Stock Market?
How Tariffs Could Impact the Copper Landscape?
Why do oil ETFs lag behind oil prices in the long run?
Why is the US dollar so powerful worldwide, and how can we tell?
A look at employment: what other indicators are there?
GDP: The Barometer of National Prosperity
Understanding Treasury Auctions: A Step-by-Step Guide
Unpacking the U.S. Debt Issue
Why is Oil Called the "Mother of All Commodities"?
How Inflation Affects the Market
How to interpret the Fed dot plot?
How to Decode Inflation: CPI, PCE, and PPI
Understanding Bessent's Fiscal Blueprint
The Rise of the Fed: Can Trump Dismiss Powell?
What's in the Fed's Toolbox?
'Oracle of Omaha' Warren Buffett:ROE>20% is preferable
'Father of value investing' Benjamin Graham: Ten Stock Selection Criteria
Strong Consumer Spending Despite Economic Slowdown: Here's Why
Analyzing the manufacturing industry may help you grasp economic trends
What is the Debt Ceiling? A Deep Dive into US Fiscal Policy
How to Preserve Your Wealth in a High Inflation Environment
How to analyze the Federal Reserve's monetary policy?
Rapidly Rising US Housing Prices: Opportunity or Risk?
How Will the US Dollar Perform in 2024? A Closer Look into the US Dollar Index
Discussing the driving forces behind rises in gold prices
Investing and Labor Market Indicators
Discover the bond market: A quick and easy guide
The Underlying Conflicts Surrounding Crude Oil Prices
Understanding the relationship between the stock market and the bond market
Understanding the US Non-Farm Payroll Data
Understanding the Federal Reserve Interest Rate Decision
Understanding the CCI
Understanding the PPI
Understanding the Retail Sales
Understanding the US Crude Oil Inventories
Understanding the Durable Goods Orders
Listen to the Fed's speakers: Hawks or doves?
Open the Fed's monetary policy toolbox
The Fed Dot Plot explained: What it says about US interest rates
How does monetary policy steer our lives and investment
What the Federal Reserve does?
Understanding the GDP
A brief history lesson on the Fed and U.S. economy
08 Carl Icahn & Icahn Enterprises
09 Seth Klarman & Baupost Group
07 Howard Marks & Oaktree Capital
01 Using 13F filings to learn from big investors
03 How to Read Form 13F
02 Identify a fund's investment strategy
04 Warren Buffett & Berkshire Hathaway
06 Ray Dalio & Bridgewater Associates
05 Bill Ackerman & Pershing Square Capital

