




Moomoo Insights
Jul 16 15:38
TSMC Earnings: AI Demand Is Stronger Than the Chip Selloff Suggests
Moomoo Insights
Sep 30 05:04
Live Take | Anthropic’s $518B Compute Bet: Who Wins From the AI Buildout?
In 2023, the US bond market is expected to face significant challenges as the yield on US Treasury bonds has reached a 16-year high. Investors appear to become increasingly worried about future economic prospects. According to CNBC, Giant hedge funds like Bill Ackman's have closed short positions in long-term US government bonds.
Investors may be wondering why the stock market generally falls when bond yields rise and whether the bond market becomes more attractive when the 10-year US Treasury yield remains high. In this article, we will delve into the relationship between the stock market and the bond market.

1. Are the bond market and stock market positively or negatively correlated?
2. With Treasury yields remaining high, has the bond market become more attractive?
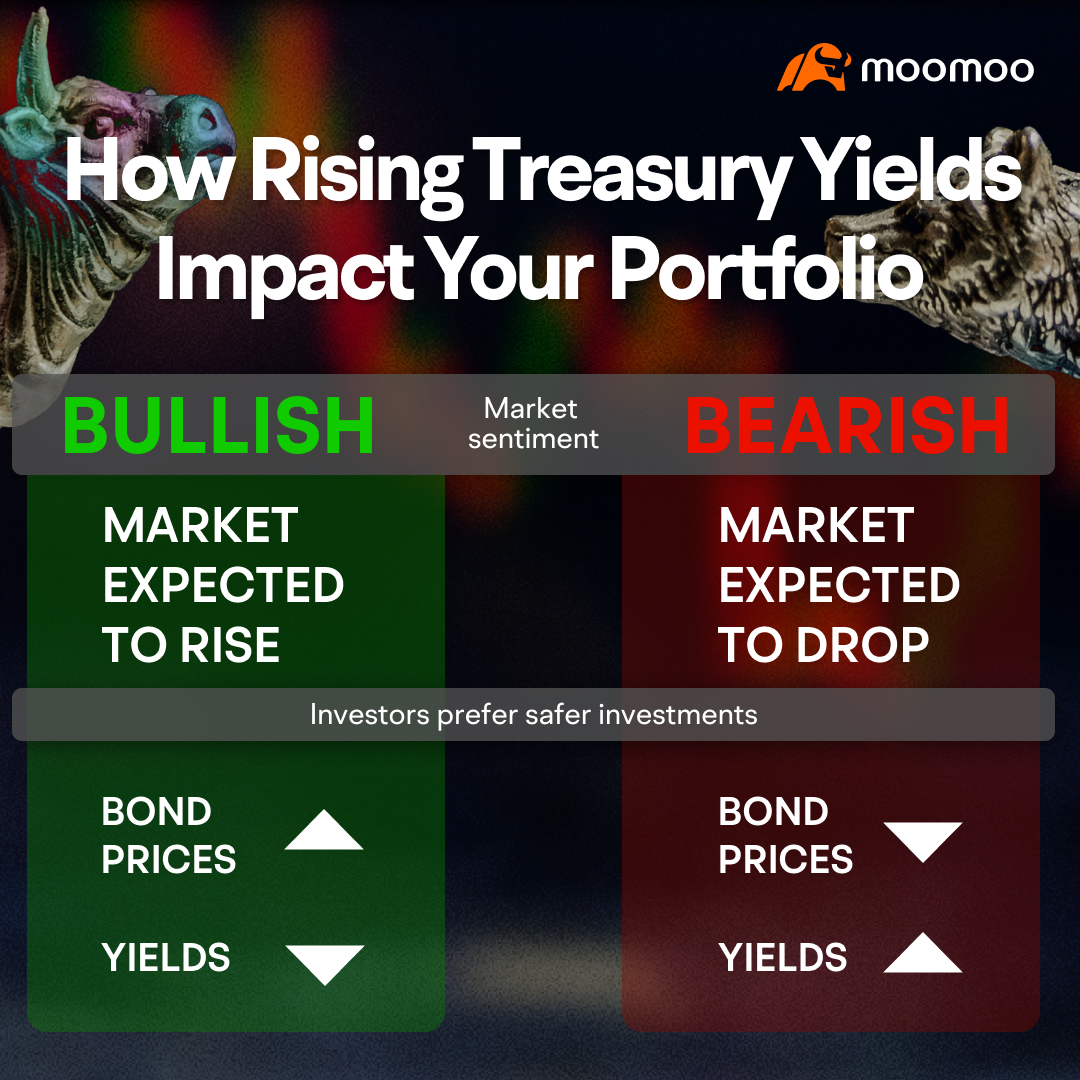
It is important to understand that the price and yield of bonds determine their value in the secondary market, and they have an inverse relationship. This means that when bond prices rise, yields fall, and vice versa.
Investors should always pay attention to whether they are looking at price indicators or yield indicators when monitoring the bond market. Misinterpreting these indicators can lead to opposite analyses. For instance, when the yield of the US 10-year Treasury note exceeds 5%, investors should keep in mind that the futures price of the 10-year Treasury note is currently extremely low compared to recent history.
Furthermore, investors' behavior can significantly impact the correlation between the stock and bond markets. Due to investors' risk preferences in different markets, when long-term government bond yields rise, the stock market tends to fall.
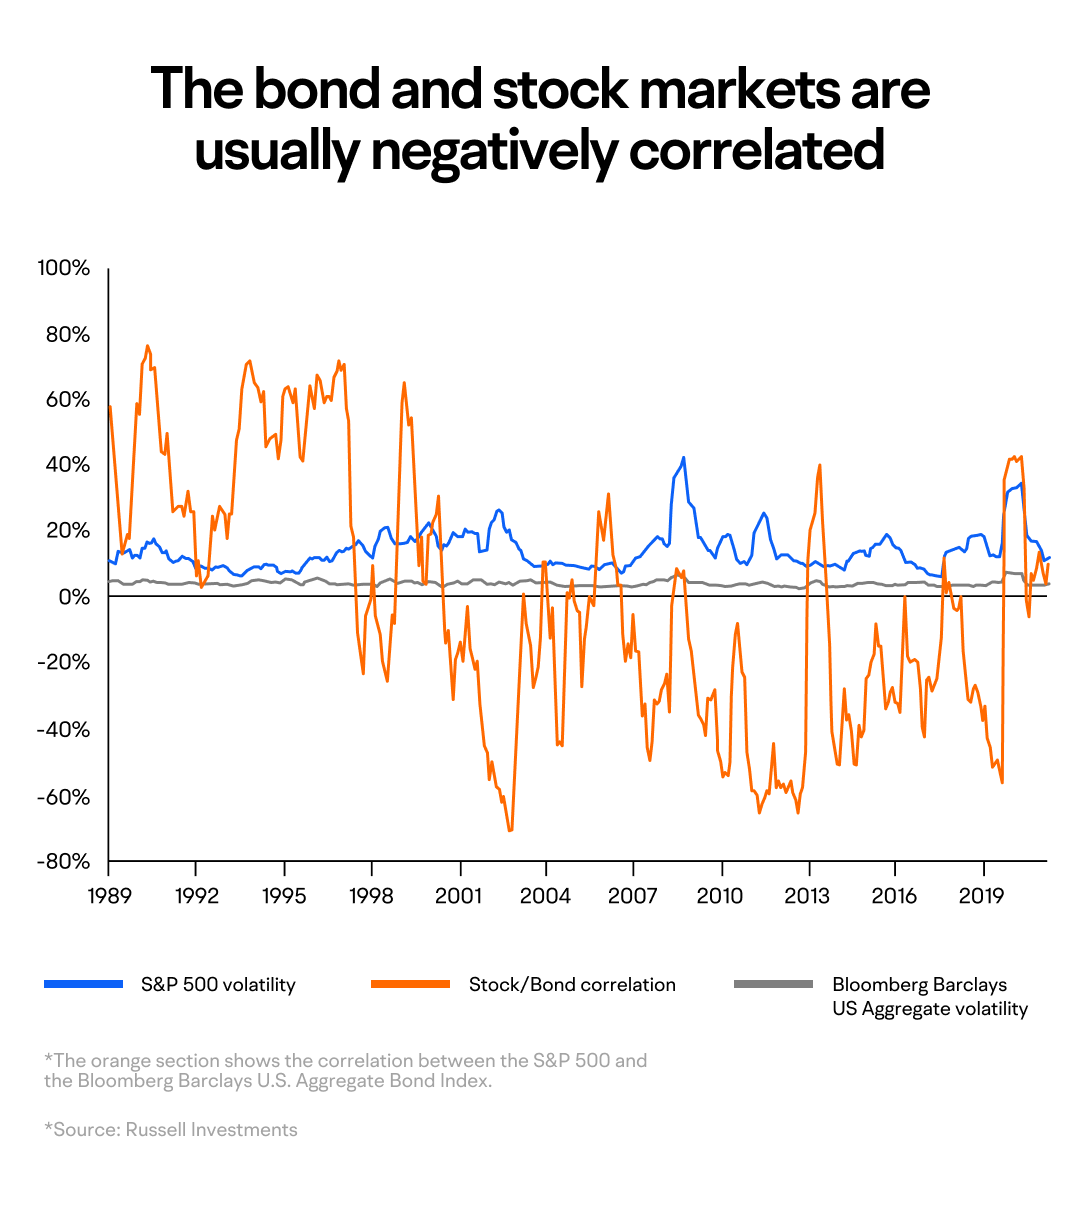
The bond market and stock market typically display a negative correlation. Stocks are considered high-risk, high-return securities, while government bonds are viewed as low-risk, low-return assets. When investors' preferences for high-risk investments decline, their preference for nearly risk-free or low-risk investments like government bonds may increase.
As more people sell high-risk assets, the prices of these assets naturally decrease. Conversely, an increased demand for low-risk assets causes their prices to rise. For instance, during economic downturns or market instability, many investors tend to move funds from the stock market to the safer bond market as a hedge against loss. This usually increases bond demand and causes prices to rise, leading to a decline in bond yields. Meanwhile, the demand for stocks declines, ultimately leading to lower stock prices.
The negative correlation also can be shown during periods of high inflation. Bonds suffer from rising inflation, leading to a decrease in the value of their fixed interest payments and compensation through an increase in yields and a decrease in prices. Conversely, inflation is generally favorable for the stock market, resulting in rising prices and increasing nominal income growth that pushes up stock prices.
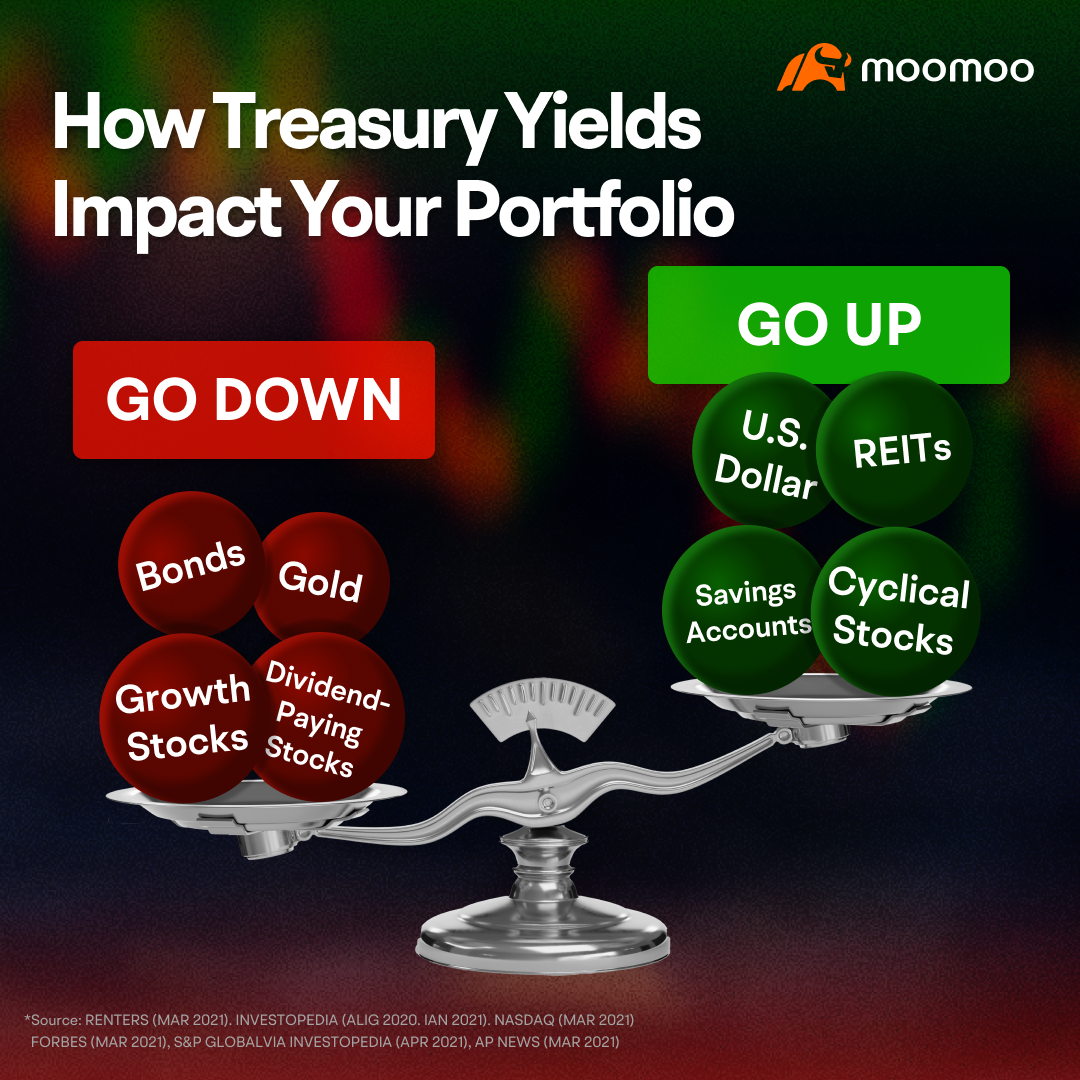
Moreover, if bond yields rise, investors may move out of the stock market and into the high-yield bond market, causing a decline in the stock market.
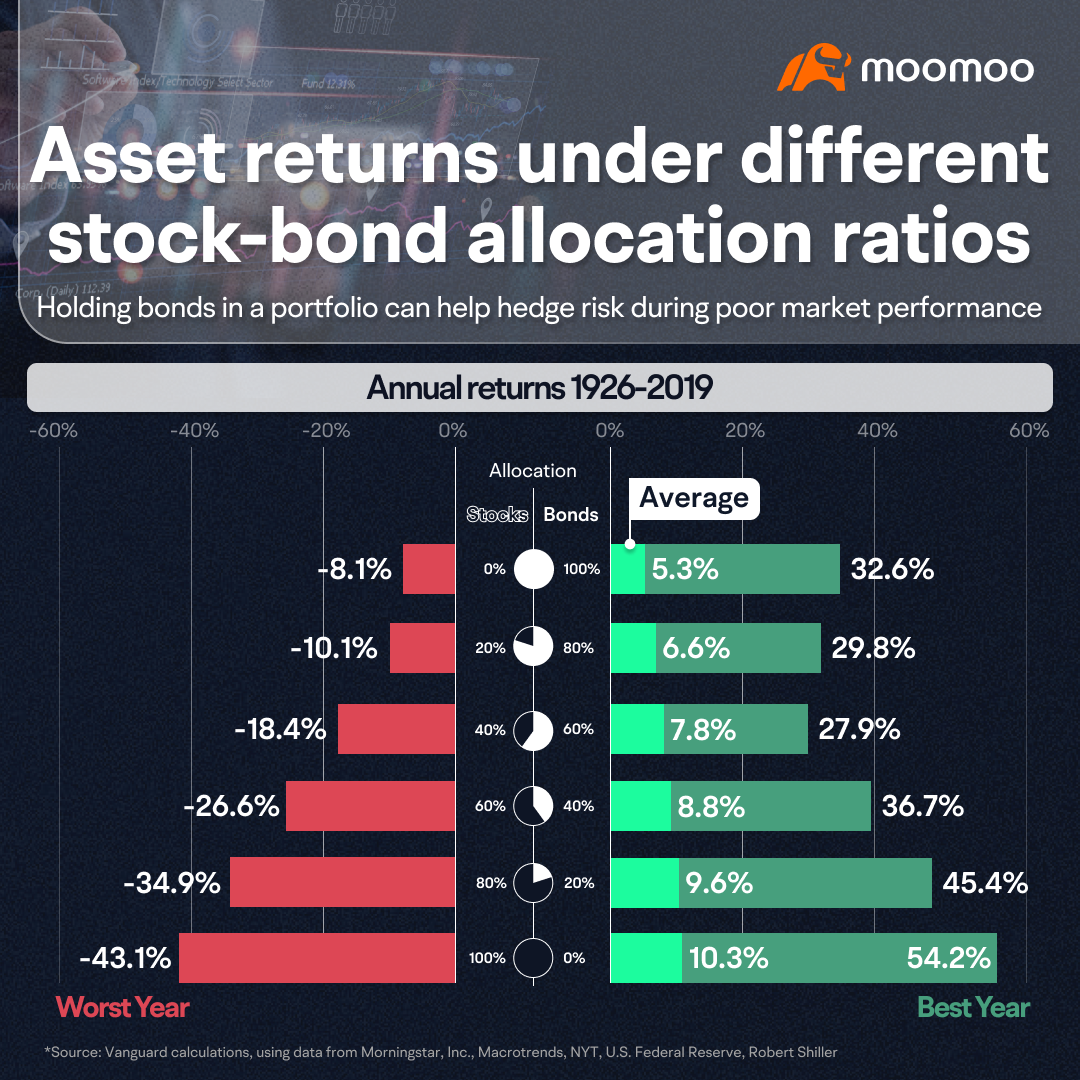
Because of the "see-saw effect" between the stock market and the bond market, portfolio theory suggests that investors should hold a mix of stocks and bonds to balance risks in their portfolio. Doing so helps hedge against potential losses and promotes greater overall stability.
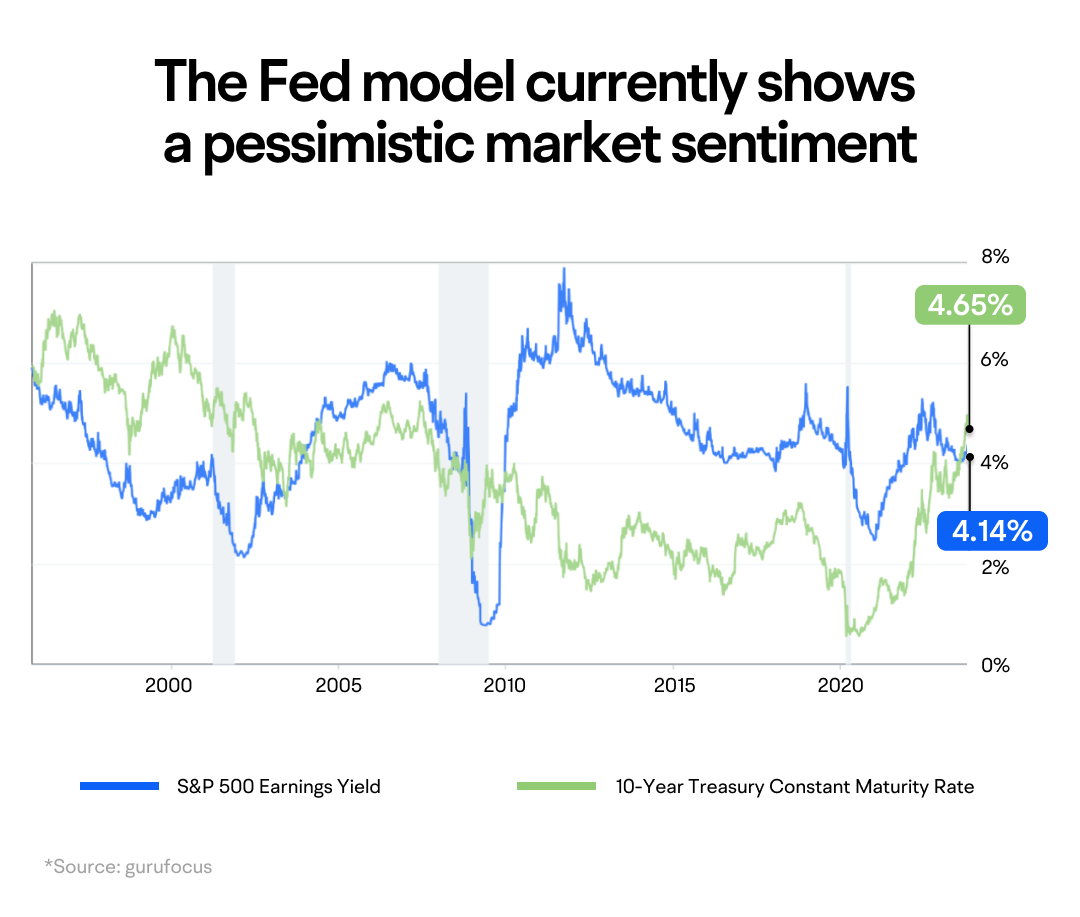
The negative correlation between the stock and bond markets is also used for timing models in the market, such as the Fed model, which compares the S&P 500 index's earnings yield rate with the 10-year US Treasury note yield. A large difference between the two indicates that stocks are relatively cheaper than bonds, and vice versa.
However, it is worth noting that the relationship between the bond and stock markets does not always follow this opposite trend, and sometimes they may move in sync. For instance, when the Federal Reserve began raising interest rates in 2022, both stocks and bonds experienced sell-offs simultaneously.
According to Russell Investments' correlation graphic for the bond and stock markets, they are typically negatively correlated, but more complex economic conditions can break this negative correlation. According to Peter Moesen, an analyst at Russell Investments, mixed economic variables can interfere with the correlation between the bond and stock markets. For instance, sometimes good news for the economy may be good news for bonds from one perspective, but bad news from another. This can result in increased volatility.
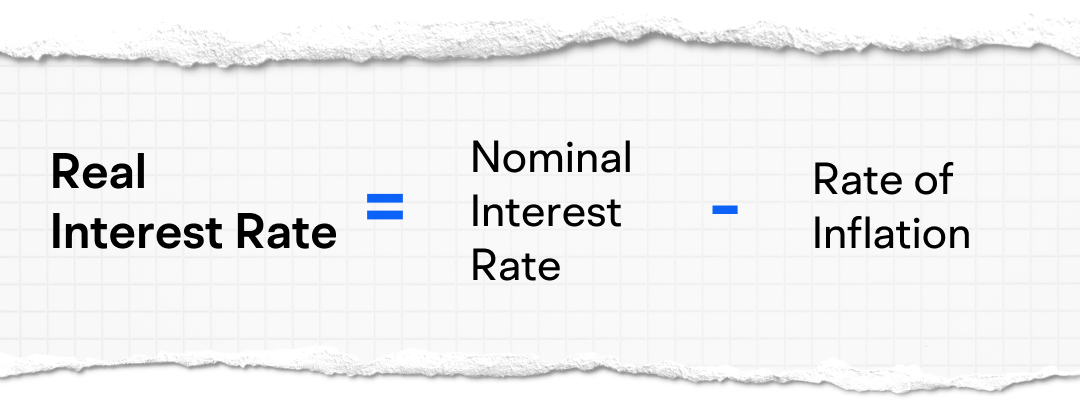
Bond yields are determined by real interest rates and reaction to inflation expectations. A significant increase in real interest rates is negative for both bonds and stocks.
For bonds, an increase in real interest rates leads to an increase in bond yields and a decrease in prices. For stocks, increased borrowing costs can impact corporate profits and cash flows, leading to decreased demand from investors, and potentially causing stock prices to fall.
During quantitative easing, policies could reduce interest rates, which increases bond prices and drives down bond yields. This usually results in reduced demand for bonds and increased demand for higher-return investments like stocks, leading to rising stock prices.
Interest rate fluctuations can create a positive correlation between the bond and stock markets, as discussed previously. However, it's important to note that financial markets are highly complex and influenced by numerous factors beyond interest rates. Therefore, it is difficult to definitively say whether the bond and stock markets positively or negatively correlate with one another.
The 2022 Federal Reserve interest rate hike caused chaos in the bond market, with Bloomberg's U.S. Composite Bond Index falling by 13%, marking it as the worst bond performance in decades. However, as the Fed hints at ending its tightening policies, some investors see an opportunity for bond investments.
Ryan Linenger, a financial advisor with Plante Moran, suggests that rising interest rates make bonds more attractive than they have been in over a decade.
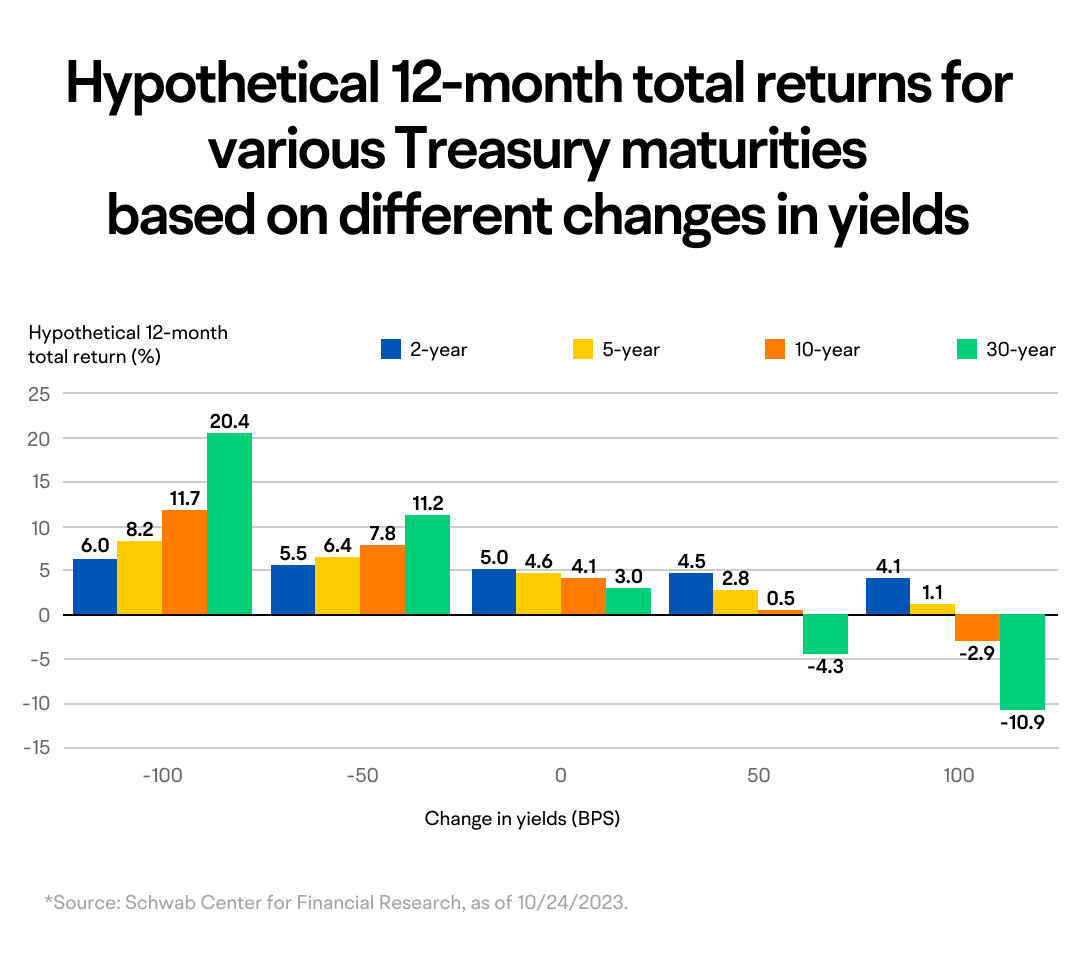
According to Schwab analysts, typically, the Fed has paused hiking rates when it believed that economic growth was about to contract and inflation would slow. As shown in the chart below, longer-term Treasuries usually decline in the weeks before and after the Fed hikes rates to the peak level for that cycle.
Due to the inverted yield curve of US Treasuries where long-term yields are lower than short-term yields, some investors may find short-term yields more attractive and become confused about why most analysts advocate buying long-term Treasuries.
It's vital to consider that potential risks come with investment opportunities. In this case, investing in short-term bonds primarily exposes investors to reinvestment risk.
Although short-term yields may be high, short-term rates are more sensitive to the Fed's policy than longer-term rates. If the Fed begins cutting rates in 2024, it may lead to lower short-term rates. As a result, short-term investors may face the prospect of renewing their investments at rates significantly lower than the original rate. In contrast, long-term investors would continue to earn high interest.
To address this concern, Collin Martin, a fixed-income strategist at Charles Schwab Investment Management, suggests locking in high yields with certainty instead of risking reinvestment at lower rates after the Fed begins cutting rates.
Evaluating bond risks is also crucial, especially since many investors hold high-yield bonds to increase returns in low-interest-rate environments. However, these higher-yielding bonds often come with significant debt and weak balance sheets, exposing them to significant risks.
Bond investors must be cautious of changing economic environments and potential risks. High-quality bonds may be a more robust choice than low-rated, high-yield bonds.
Check out the macro analysis in the "Advanced" section to learn more about the US bond market. Update yourself with the latest data and market trends to make more informed investment decisions!
This presentation is for informational and educational use only and is not a recommendation or endorsement of any particular investment or investment strategy. Investment information provided in this content is general in nature, strictly for illustrative purposes, and may not be appropriate for all investors. Read more
Recommend
Why does Warren Buffett say don't piggyback on his trades?

How does nonfarm payroll impact the global market?
Unveiling Inflation: Why is Your Wallet Shrinking?

Mastering the Dollar Cycle: How to invest in a changing economy
Gold vs. Gold Miners: A Comparison
Are U.S. Treasuries still a safe haven?
Meet Dr. Copper: Understanding the Copper Market
Do Oil Price Swings Rock the Stock Market?
How Tariffs Could Impact the Copper Landscape?
Why do oil ETFs lag behind oil prices in the long run?
Why is the US dollar so powerful worldwide, and how can we tell?
A look at employment: what other indicators are there?
GDP: The Barometer of National Prosperity
Understanding Treasury Auctions: A Step-by-Step Guide
Unpacking the U.S. Debt Issue
Why is Oil Called the "Mother of All Commodities"?
How Inflation Affects the Market
How to interpret the Fed dot plot?
How to Decode Inflation: CPI, PCE, and PPI
Understanding Bessent's Fiscal Blueprint
The Rise of the Fed: Can Trump Dismiss Powell?
What's in the Fed's Toolbox?
'Oracle of Omaha' Warren Buffett:ROE>20% is preferable
'Father of value investing' Benjamin Graham: Ten Stock Selection Criteria
Strong Consumer Spending Despite Economic Slowdown: Here's Why
Analyzing the manufacturing industry may help you grasp economic trends
What is the Debt Ceiling? A Deep Dive into US Fiscal Policy
How to Preserve Your Wealth in a High Inflation Environment
How to analyze the Federal Reserve's monetary policy?
Rapidly Rising US Housing Prices: Opportunity or Risk?
How Will the US Dollar Perform in 2024? A Closer Look into the US Dollar Index
Discussing the driving forces behind rises in gold prices
Investing and Labor Market Indicators
Discover the bond market: A quick and easy guide
The Underlying Conflicts Surrounding Crude Oil Prices
Understanding the relationship between the stock market and the bond market
Understanding the US Non-Farm Payroll Data
Understanding the Federal Reserve Interest Rate Decision
Understanding the CCI
Understanding the PPI
Understanding the Retail Sales
Understanding the US Crude Oil Inventories
Understanding the Durable Goods Orders
Listen to the Fed's speakers: Hawks or doves?
Open the Fed's monetary policy toolbox
The Fed Dot Plot explained: What it says about US interest rates
How does monetary policy steer our lives and investment
What the Federal Reserve does?
Understanding the GDP
A brief history lesson on the Fed and U.S. economy
08 Carl Icahn & Icahn Enterprises
09 Seth Klarman & Baupost Group
07 Howard Marks & Oaktree Capital
01 Using 13F filings to learn from big investors
03 How to Read Form 13F
02 Identify a fund's investment strategy
04 Warren Buffett & Berkshire Hathaway
06 Ray Dalio & Bridgewater Associates
05 Bill Ackerman & Pershing Square Capital
Why does Warren Buffett say don't piggyback on his trades?
How does nonfarm payroll impact the global market?
Unveiling Inflation: Why is Your Wallet Shrinking?
Mastering the Dollar Cycle: How to invest in a changing economy
Gold vs. Gold Miners: A Comparison
Are U.S. Treasuries still a safe haven?
Meet Dr. Copper: Understanding the Copper Market
Do Oil Price Swings Rock the Stock Market?
How Tariffs Could Impact the Copper Landscape?
Why do oil ETFs lag behind oil prices in the long run?
Why is the US dollar so powerful worldwide, and how can we tell?
A look at employment: what other indicators are there?
GDP: The Barometer of National Prosperity
Understanding Treasury Auctions: A Step-by-Step Guide
Unpacking the U.S. Debt Issue
Why is Oil Called the "Mother of All Commodities"?
How Inflation Affects the Market
How to interpret the Fed dot plot?
How to Decode Inflation: CPI, PCE, and PPI
Understanding Bessent's Fiscal Blueprint
The Rise of the Fed: Can Trump Dismiss Powell?
What's in the Fed's Toolbox?
'Oracle of Omaha' Warren Buffett:ROE>20% is preferable
'Father of value investing' Benjamin Graham: Ten Stock Selection Criteria
Strong Consumer Spending Despite Economic Slowdown: Here's Why
Analyzing the manufacturing industry may help you grasp economic trends
What is the Debt Ceiling? A Deep Dive into US Fiscal Policy
How to Preserve Your Wealth in a High Inflation Environment
How to analyze the Federal Reserve's monetary policy?
Rapidly Rising US Housing Prices: Opportunity or Risk?
How Will the US Dollar Perform in 2024? A Closer Look into the US Dollar Index
Discussing the driving forces behind rises in gold prices
Investing and Labor Market Indicators
Discover the bond market: A quick and easy guide
The Underlying Conflicts Surrounding Crude Oil Prices
Understanding the relationship between the stock market and the bond market
Understanding the US Non-Farm Payroll Data
Understanding the Federal Reserve Interest Rate Decision
Understanding the CCI
Understanding the PPI
Understanding the Retail Sales
Understanding the US Crude Oil Inventories
Understanding the Durable Goods Orders
Listen to the Fed's speakers: Hawks or doves?
Open the Fed's monetary policy toolbox
The Fed Dot Plot explained: What it says about US interest rates
How does monetary policy steer our lives and investment
What the Federal Reserve does?
Understanding the GDP
A brief history lesson on the Fed and U.S. economy
08 Carl Icahn & Icahn Enterprises
09 Seth Klarman & Baupost Group
07 Howard Marks & Oaktree Capital
01 Using 13F filings to learn from big investors
03 How to Read Form 13F
02 Identify a fund's investment strategy
04 Warren Buffett & Berkshire Hathaway
06 Ray Dalio & Bridgewater Associates
05 Bill Ackerman & Pershing Square Capital

