





Moomoo Insights
Jul 16 15:38
TSMC Earnings: AI Demand Is Stronger Than the Chip Selloff Suggests
Moomoo Insights
Sep 30 05:04
Live Take | Anthropic’s $518B Compute Bet: Who Wins From the AI Buildout?
The remainder of 2023 could be a difficult time for Americans. First, the cost of borrowing money may go up because of fast interest rate hikes by the Fed. Second, people are concerned that unemployment rates will increase as the economy declines.
Some may ask, why rate hikes influence the labor market? How important is employment data? After finishing this course, you may have several answers to these questions.

● Why is the labor market important? What are some of the indicators?
● How can investors interpret indicators to assist in establishing an analysis framework?
● What are the potential impacts of employment rates on the stock market?
● Let's put our knowledge into practice!
● Summary
Is analyzing the labor market important? - The answer is, it can be very important.
This is because employment provides productivity and services that affect many aspects of our lives. For example, if workers go on strike, cities could come to a standstill; if farmers stop planting, vegetable prices in grocery stores will usually increase.
Moreover, labor market indicators often affect investment in US stocks. By learning these indicators, we can know more about the Fed's possible next steps and use our knowledge to help adjust our positions appropriately.
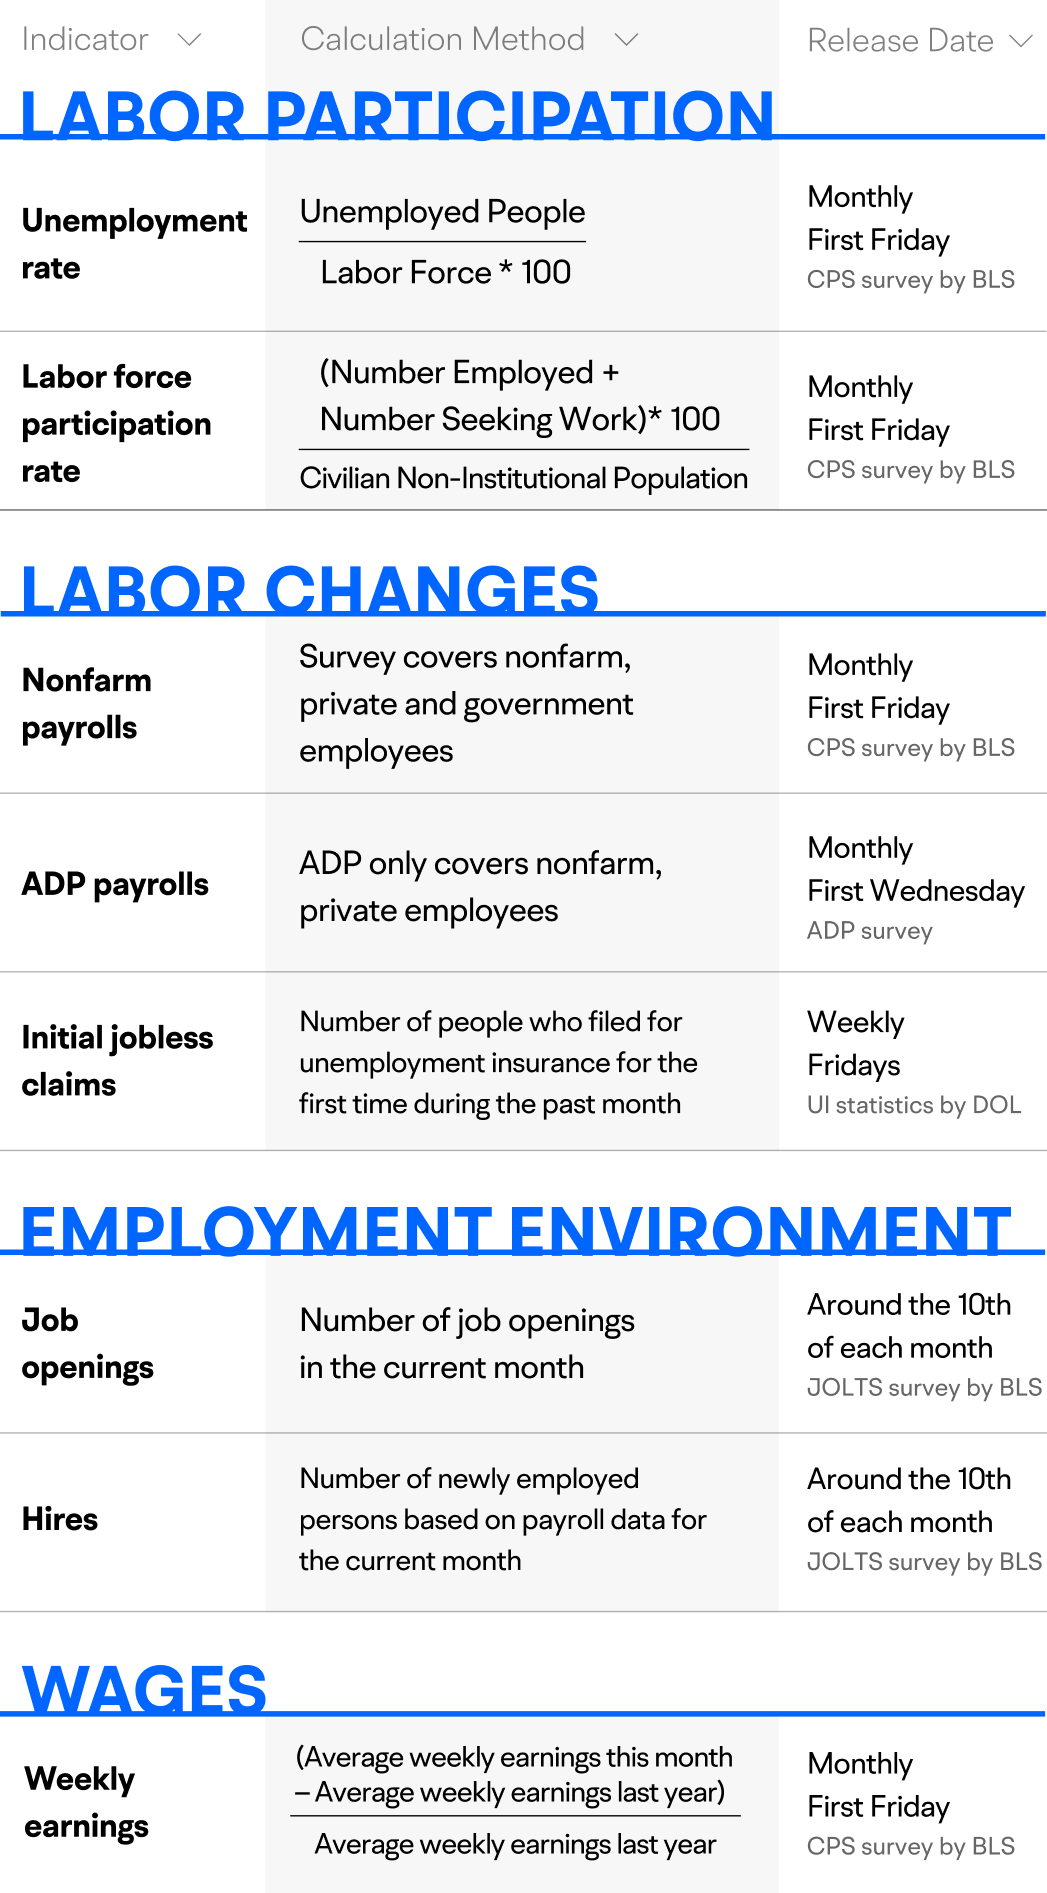
Understanding the entire labor market requires consideration of multiple factors.
(1) Unemployment rate
(2) Labor force participation rate
(3) Nonfarm payrolls
(4) Initial jobless claims
(5) Job openings
(6) Hires
(7) Weekly earnings
When analyzing labor market data, many investors may come across two nonfarm employment indicators. So, what are the differences between them, and which one generally serves as a more reliable reference?
● Coverage difference: Nonfarm payrolls (NFP) is a survey conducted by the Bureau of Labor Statistics for US businesses and government agencies, while government employees are excluded from the ADP report.
● Release time difference: The NFP report typically arrives on the first Friday of each month, while the ADP report typically arrives on the Wednesday prior. ADP payrolls can offer an excellent guide to the NFP numbers that follow.
● Trend difference: NFP and ADP payrolls share roughly the same trend in the long term, but in the short run, they often deviate. The greater the turbulence in the labor market, the easier it is for the two survey results to diverge.
● Conclusion: Market participants and federal officials tend to pay more attention to the NFP figures.
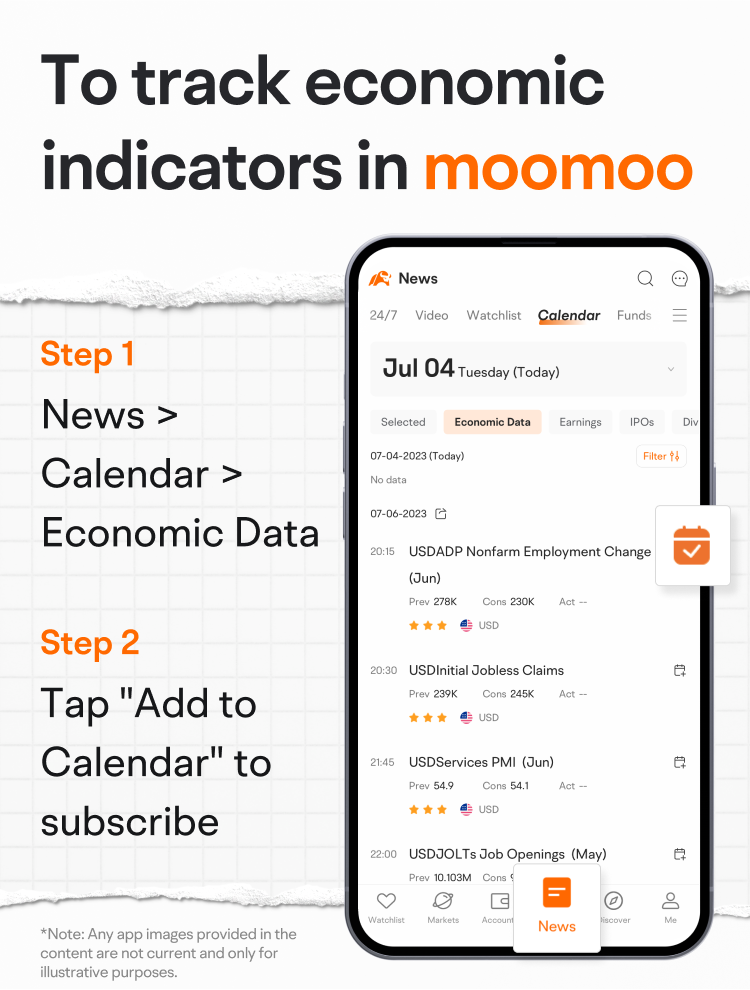
To better understand the labor market, a key element is to know when indicators are released.
The timing matters since the market tends to experience fluctuations before and after the release of key indicators. Knowing when a particular indicator is about to be released, investors can make early arrangements based on market expectations.
Here are the detailed definitions of the 7 key indicators that the Fed is very concerned about:
Once we know the release timing, we can officially begin the analysis!
We follow these steps:
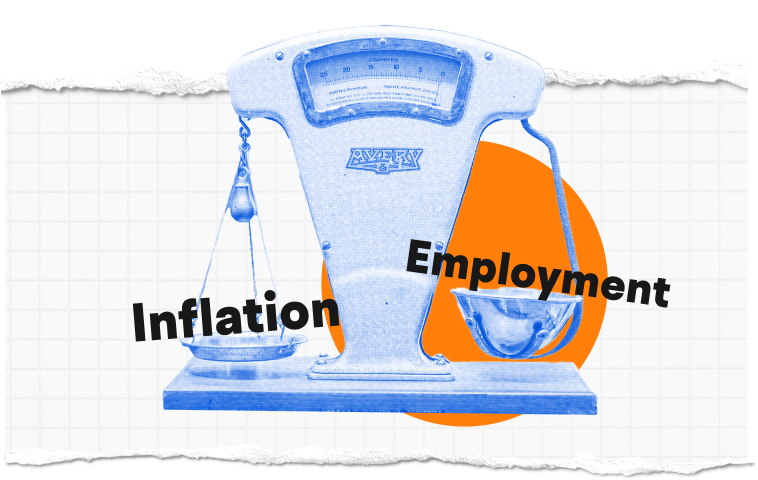
Firstly, you can attempt to determine the current phase of the US economic cycle in an effort to forecast the direction of the Federal Reserve's monetary policy, which it uses to achieve its dual mandate–pursuing the economic goals of maximum employment and price stability.
Based on the current economic condition, the Fed typically takes measures such as adjusting interest rates, monitoring macroeconomic indicators, and implementing quantitative easing policies to balance the goals of price stability and maximum employment.
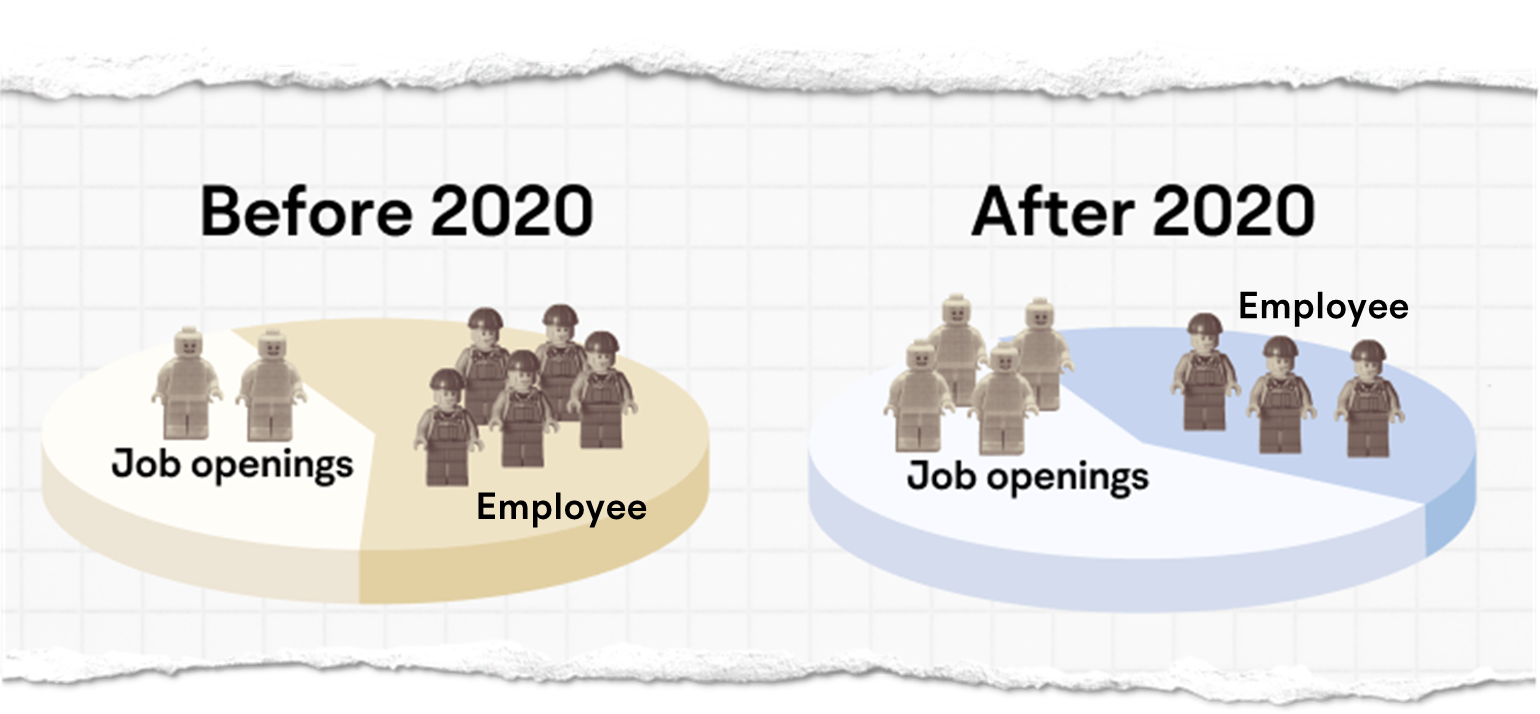
Secondly, as an investor, you may have already realized that COVID-19 has also changed the structure of the labor market. After the pandemic, some people "fired" their bosses to seek higher salaries, and even if they could not find a new employer immediately, they could possibly still maintain their livelihoods for a period of time if they received subsidies.
According to US News & World Report, “Many workplace norms were upended during the pandemic, some permanently”.
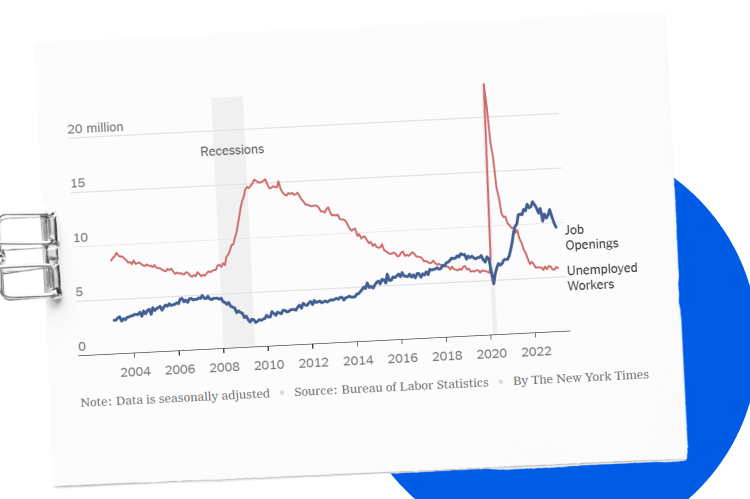
As of the end of 2022, even if every unemployed person found a job, there would be approximately 4 million job openings in the United States, indicating a very "hot" job market. However, a closer look at this hot job market reveals that millions of experienced employees are choosing to retire early.
After discovering more about the current labor market, it would be beneficial to slightly change the way we analyze it.
Previously, we could compare and analyze similar types of indicators. For example, in the past, a significant decrease in job openings was usually accompanied by layoffs and an increase in the unemployment rate. When this situation occurred, economists could be more confident that the US economy would experience a "hard landing".
However, this "fixed rule" may no longer exist, as since 2023, although job openings have decreased significantly, the unemployment rate has remained low.
To interpret data in the current climate, we may be able to "ignore history" by using trend analysis to focus more on month-on-month changes. For example, we can compare the nonfarm payroll data for this month to that of last month and see if it meets Wall Street estimates.
It's also important to comprehensively evaluate employment changes with other indicators, such as the wage growth rate and inflation.
Lastly, neglecting market forecasts can be detrimental because the stock market tends to fluctuate more wildly with changes in expectations.
The correlation between employment and the stock market cannot be simply interpreted as positive or negative. To answer this rather complex problem, the first step is to gain a better understanding of the US macroeconomic cycle.
For example, in normal times, strong job growth and wage increases are considered good news. However, during periods when the Federal Reserve is tightening monetary policy to control inflation, a strong job market can potentially lead to a crash in the stock market because it's generally believed that strong employment will lead to more aggressive interest rate hikes, which probably means lower stock prices. This was seen in October 2022, when the market reacted negatively after the release of the September nonfarm payroll report.
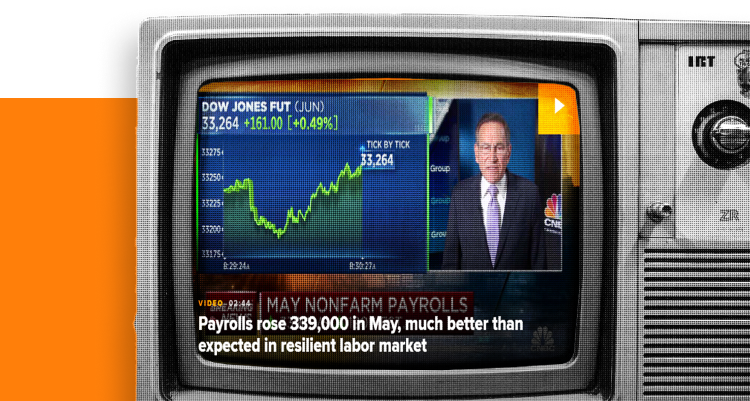
Conversely, when Wall Street predicts an impending recession for the US economy, employment and the equity market are more positively correlated. Such was the case in June 2023 when the May nonfarm payroll report came out. One contributing factor to the rise in the US stock market seems to be "confidence brought about by a strong job market," as data helped ease concerns about a recession and investors appeared to believe that the US economy continued to maintain its strong momentum and growth potential.
(Source: CNBC; Note: Images provided in the content are not current and any securities shown are for illustrative purposes only and are not a recommendation.)
How could we go about analyzing the employment data for January 2023?
1. First of all, we can find out the current phase of the US economic cycle: January 2023 was still in the interest rate hike cycle that began in 2022.
2. Secondly, analyzing the direction of the Fed: Fed officials wanted the labor market to cool down to help curb inflation. This means that if the labor market cooled down, there was a high probability that the Fed would stop raising interest rates, and the US stock market might rise on that day.
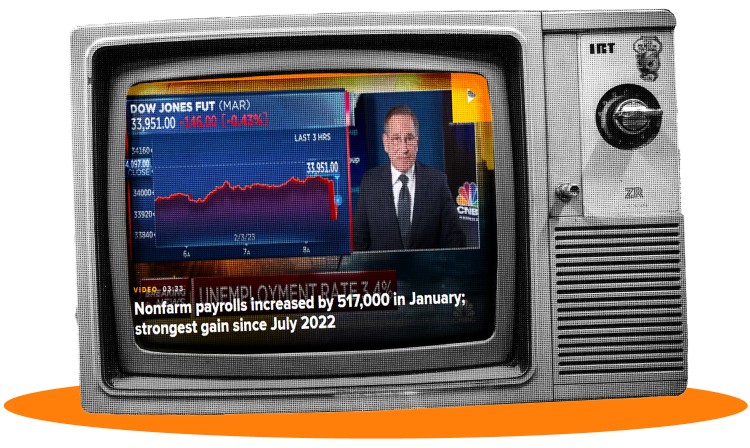
3. However, in reality, the NFP report surprised investors with a gain of 517K jobs in January, far above the 223K market consensus. A tight job market meant a go-ahead for the US central bank to remain hawkish, which was detrimental to stocks.
(Source: CNBC; Note: Images provided in the content are not current and any securities shown are for illustrative purposes only and are not a recommendation.)
Returning to the issue of "labor market analysis," we can consider the following steps:
● Figuring out which stage the US economy is in
Different stages of the economic cycle generally have different impacts on employment and the stock market.
● Analyzing the Federal Reserve's monetary policies
If the employment market data is considered good, the Fed may adopt certain policies to try to control inflation or stimulate economic growth.
● Evaluating the latest employment market data
This can help us better understand how the stock market may react to the data.
● Considering potential changes in the future labor market
For example, changes in demographics may significantly impact employment rates.
● Re-examining stock investment strategies based on the above analysis
We can adjust our investment strategies to better align with the current economic conditions.
If you now feel confident in analyzing the labor market after this lesson, consider checking out our "advanced" section of macro analysis! Keep up with the latest employment data to better interpret market trends and stay ahead of the game!
This presentation is for informational and educational use only and is not a recommendation or endorsement of any particular investment or investment strategy. Investment information provided in this content is general in nature, strictly for illustrative purposes, and may not be appropriate for all investors. Read more
Recommend
Why does Warren Buffett say don't piggyback on his trades?

How does nonfarm payroll impact the global market?
Unveiling Inflation: Why is Your Wallet Shrinking?

Mastering the Dollar Cycle: How to invest in a changing economy
Gold vs. Gold Miners: A Comparison
Are U.S. Treasuries still a safe haven?
Meet Dr. Copper: Understanding the Copper Market
Do Oil Price Swings Rock the Stock Market?
How Tariffs Could Impact the Copper Landscape?
Why do oil ETFs lag behind oil prices in the long run?
Why is the US dollar so powerful worldwide, and how can we tell?
A look at employment: what other indicators are there?
GDP: The Barometer of National Prosperity
Understanding Treasury Auctions: A Step-by-Step Guide
Unpacking the U.S. Debt Issue
Why is Oil Called the "Mother of All Commodities"?
How Inflation Affects the Market
How to interpret the Fed dot plot?
How to Decode Inflation: CPI, PCE, and PPI
Understanding Bessent's Fiscal Blueprint
The Rise of the Fed: Can Trump Dismiss Powell?
What's in the Fed's Toolbox?
'Oracle of Omaha' Warren Buffett:ROE>20% is preferable
'Father of value investing' Benjamin Graham: Ten Stock Selection Criteria
Strong Consumer Spending Despite Economic Slowdown: Here's Why
Analyzing the manufacturing industry may help you grasp economic trends
What is the Debt Ceiling? A Deep Dive into US Fiscal Policy
How to Preserve Your Wealth in a High Inflation Environment
How to analyze the Federal Reserve's monetary policy?
Rapidly Rising US Housing Prices: Opportunity or Risk?
How Will the US Dollar Perform in 2024? A Closer Look into the US Dollar Index
Discussing the driving forces behind rises in gold prices
Investing and Labor Market Indicators
Discover the bond market: A quick and easy guide
The Underlying Conflicts Surrounding Crude Oil Prices
Understanding the relationship between the stock market and the bond market
Understanding the US Non-Farm Payroll Data
Understanding the Federal Reserve Interest Rate Decision
Understanding the CCI
Understanding the PPI
Understanding the Retail Sales
Understanding the US Crude Oil Inventories
Understanding the Durable Goods Orders
Listen to the Fed's speakers: Hawks or doves?
Open the Fed's monetary policy toolbox
The Fed Dot Plot explained: What it says about US interest rates
How does monetary policy steer our lives and investment
What the Federal Reserve does?
Understanding the GDP
A brief history lesson on the Fed and U.S. economy
08 Carl Icahn & Icahn Enterprises
09 Seth Klarman & Baupost Group
07 Howard Marks & Oaktree Capital
01 Using 13F filings to learn from big investors
03 How to Read Form 13F
02 Identify a fund's investment strategy
04 Warren Buffett & Berkshire Hathaway
06 Ray Dalio & Bridgewater Associates
05 Bill Ackerman & Pershing Square Capital
Why does Warren Buffett say don't piggyback on his trades?
How does nonfarm payroll impact the global market?
Unveiling Inflation: Why is Your Wallet Shrinking?
Mastering the Dollar Cycle: How to invest in a changing economy
Gold vs. Gold Miners: A Comparison
Are U.S. Treasuries still a safe haven?
Meet Dr. Copper: Understanding the Copper Market
Do Oil Price Swings Rock the Stock Market?
How Tariffs Could Impact the Copper Landscape?
Why do oil ETFs lag behind oil prices in the long run?
Why is the US dollar so powerful worldwide, and how can we tell?
A look at employment: what other indicators are there?
GDP: The Barometer of National Prosperity
Understanding Treasury Auctions: A Step-by-Step Guide
Unpacking the U.S. Debt Issue
Why is Oil Called the "Mother of All Commodities"?
How Inflation Affects the Market
How to interpret the Fed dot plot?
How to Decode Inflation: CPI, PCE, and PPI
Understanding Bessent's Fiscal Blueprint
The Rise of the Fed: Can Trump Dismiss Powell?
What's in the Fed's Toolbox?
'Oracle of Omaha' Warren Buffett:ROE>20% is preferable
'Father of value investing' Benjamin Graham: Ten Stock Selection Criteria
Strong Consumer Spending Despite Economic Slowdown: Here's Why
Analyzing the manufacturing industry may help you grasp economic trends
What is the Debt Ceiling? A Deep Dive into US Fiscal Policy
How to Preserve Your Wealth in a High Inflation Environment
How to analyze the Federal Reserve's monetary policy?
Rapidly Rising US Housing Prices: Opportunity or Risk?
How Will the US Dollar Perform in 2024? A Closer Look into the US Dollar Index
Discussing the driving forces behind rises in gold prices
Investing and Labor Market Indicators
Discover the bond market: A quick and easy guide
The Underlying Conflicts Surrounding Crude Oil Prices
Understanding the relationship between the stock market and the bond market
Understanding the US Non-Farm Payroll Data
Understanding the Federal Reserve Interest Rate Decision
Understanding the CCI
Understanding the PPI
Understanding the Retail Sales
Understanding the US Crude Oil Inventories
Understanding the Durable Goods Orders
Listen to the Fed's speakers: Hawks or doves?
Open the Fed's monetary policy toolbox
The Fed Dot Plot explained: What it says about US interest rates
How does monetary policy steer our lives and investment
What the Federal Reserve does?
Understanding the GDP
A brief history lesson on the Fed and U.S. economy
08 Carl Icahn & Icahn Enterprises
09 Seth Klarman & Baupost Group
07 Howard Marks & Oaktree Capital
01 Using 13F filings to learn from big investors
03 How to Read Form 13F
02 Identify a fund's investment strategy
04 Warren Buffett & Berkshire Hathaway
06 Ray Dalio & Bridgewater Associates
05 Bill Ackerman & Pershing Square Capital

