
Moomoo Insights
Jul 16 15:38
TSMC Earnings: AI Demand Is Stronger Than the Chip Selloff Suggests
Moomoo Insights
Sep 30 05:04
Live Take | Anthropic’s $518B Compute Bet: Who Wins From the AI Buildout?
If you've been around the financial block a few times, you probably have vivid memories of the wild ride in the oil market over the past few years.
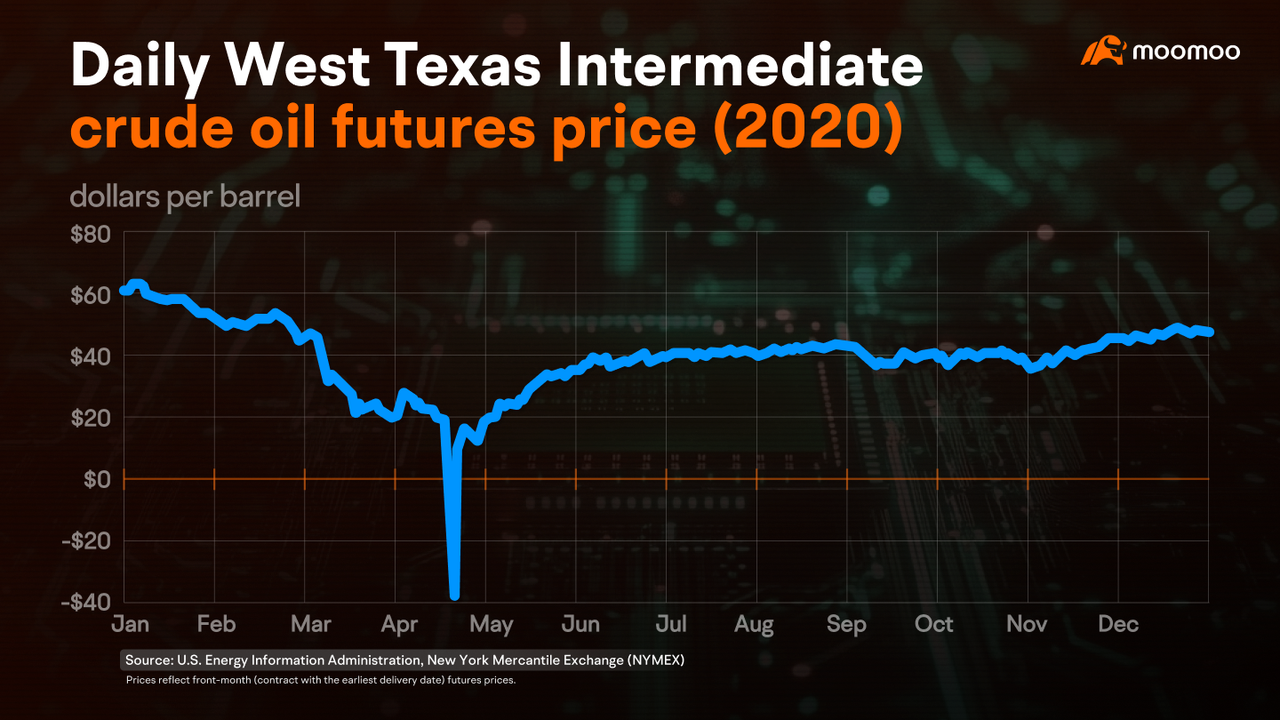
Remember the jaw-dropping moment in early 2020 when WTI crude futures dipped into negative territory because of the pandemic? Or how about the oil price surge to $130 a barrel after the 2022 Russia-Ukraine conflict kicked off?
Meanwhile, the stock market followed a similar trend, with the S&P 500 experiencing a decline during both periods.

So, what's the deal between oil prices and the stock market? Let's dig into the mechanics behind it.
Takeaways:
Global events such as the 2020 pandemic and the 2022 Russia-Ukraine conflict can cause dramatic swings in oil prices and impact the stock market.
Generally, there is no consistent relationship between oil prices and the S&P 500.
In March and April 2020, COVID-19 was spreading across the globe. Countries were shutting borders, enforcing social distancing, and halting transportation and production.
Oil demand plummeted like a lead balloon.
As if that wasn't enough, OPEC+ members had a spat. Saudi Arabia and Russia failed to reach an agreement on production cuts, prompting Saudi Arabia to initiate a retaliatory increase in production.
The storage capacity at Cushing, the primary delivery point for U.S. WTI crude futures, rapidly decreased, leaving physical crude oil with nowhere to be stored.
As futures approached expiration, long positions without the ability for physical delivery were forced to close. Panic selling led to an unprecedented negative value for that month's crude futures price.
This meant that, in addition to the steep drop in the intrinsic value of oil, sellers had to subsidize substantial storage costs to offload their oil.
Alongside this oil price crash, the stock market was having a meltdown of its own.
The S&P 500 hit the circuit breaker a few times, signaling recession fears and sending investors running for the hills.
After the initial COVID shock, as life returned to normal, oil prices climbed back to pre-pandemic levels by 2021.
Then came the 2022 Russia-Ukraine war, catapulting oil prices to new heights.
At the time, Russia was the world's second-largest oil exporter, exporting five million barrels of crude oil per day, roughly 5% of the global supply.
Following the onset of war, Western countries imposed severe sanctions on Russia, including an embargo on Russian oil. As the conflict escalated, expectations of supply disruptions intensified.
To make matters worse, U.S. shale oil companies faced setbacks in 2020, with low oil prices causing a wave of bankruptcies and forced production cuts.
Moreover, as the post-pandemic economy recovered, global oil inventories were at relatively low levels. Growing demand and limited supply sent oil prices surging.
However, the S&P 500 faced a challenging year, declining nearly 20% throughout 2022, marking its worst performance since the 2008 financial crisis.
We've talked before about how oil prices can fuel inflation.
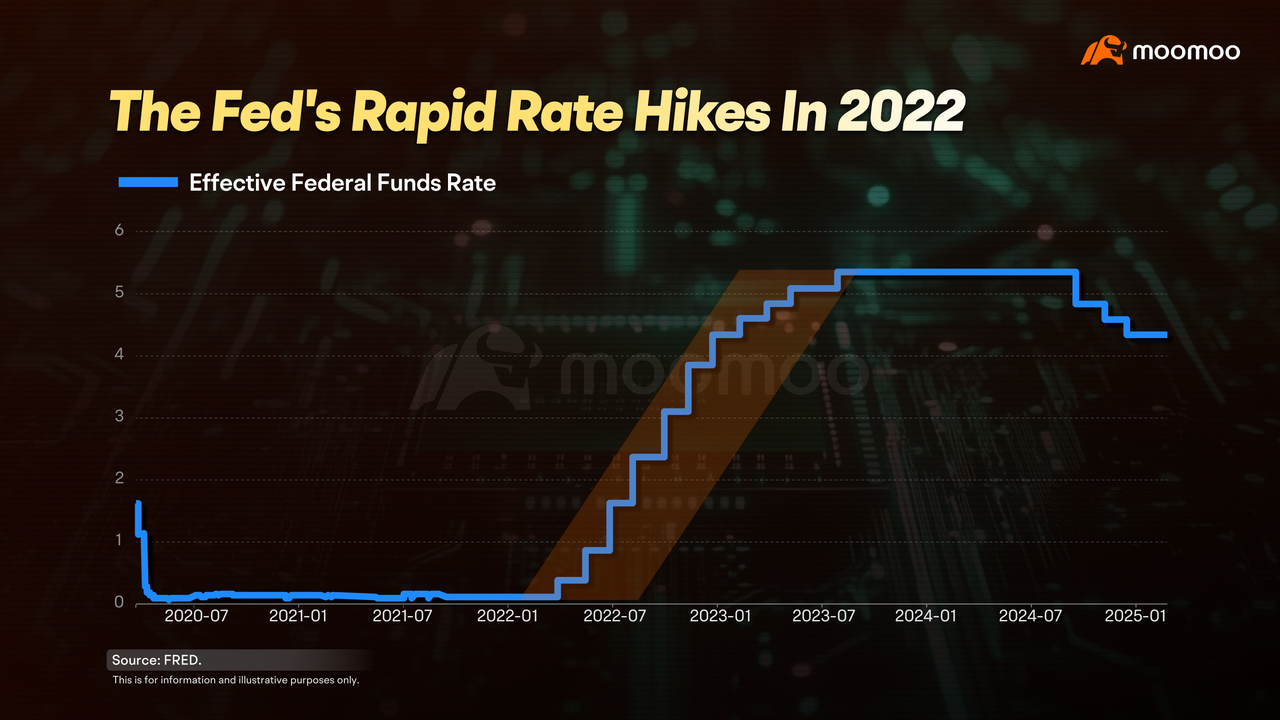
With inflation soaring, the Fed had no choice but to hike interest rates, squeezing corporate profits and stock valuations.
Now you might wonder, does the movement in oil prices always spell trouble for stocks? Not exactly!
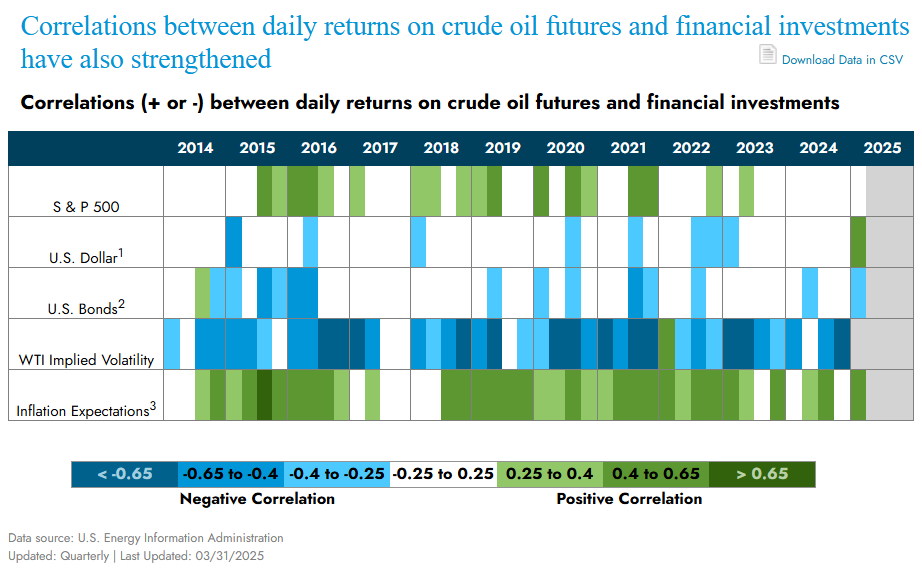
Historically, oil prices and the stock market don't have a consistent relationship. Since the second quarter of 2023, there's been little to no correlation between the two.
Past performance does not guarantee future results. This is for information and illustrative purposes only.
Oil prices tend to have a weak negative correlation with the dollar and bonds.
The key factors here are oil's implied volatility, which has a negative correlation, and inflation expectations, which have a positive correlation.
The economy is a complex system, with multiple factors influencing oil, stocks, and other assets.
The global events of 2020 and 2022 were extreme cases of oil price volatility, resulting in significant risk resonance. Most of the time, shifts in the oil market don't significantly sway U.S. stocks, so just be prepared for the next major global event.
This presentation is for informational and educational use only and is not a recommendation or endorsement of any particular investment or investment strategy. Investment information provided in this content is general in nature, strictly for illustrative purposes, and may not be appropriate for all investors. Read more
Recommend
Why does Warren Buffett say don't piggyback on his trades?

How does nonfarm payroll impact the global market?
Unveiling Inflation: Why is Your Wallet Shrinking?

Mastering the Dollar Cycle: How to invest in a changing economy
Gold vs. Gold Miners: A Comparison
Are U.S. Treasuries still a safe haven?
Meet Dr. Copper: Understanding the Copper Market
Do Oil Price Swings Rock the Stock Market?
How Tariffs Could Impact the Copper Landscape?
Why do oil ETFs lag behind oil prices in the long run?
Why is the US dollar so powerful worldwide, and how can we tell?
A look at employment: what other indicators are there?
GDP: The Barometer of National Prosperity
Understanding Treasury Auctions: A Step-by-Step Guide
Unpacking the U.S. Debt Issue
Why is Oil Called the "Mother of All Commodities"?
How Inflation Affects the Market
How to interpret the Fed dot plot?
How to Decode Inflation: CPI, PCE, and PPI
Understanding Bessent's Fiscal Blueprint
The Rise of the Fed: Can Trump Dismiss Powell?
What's in the Fed's Toolbox?
'Oracle of Omaha' Warren Buffett:ROE>20% is preferable
'Father of value investing' Benjamin Graham: Ten Stock Selection Criteria
Strong Consumer Spending Despite Economic Slowdown: Here's Why
Analyzing the manufacturing industry may help you grasp economic trends
What is the Debt Ceiling? A Deep Dive into US Fiscal Policy
How to Preserve Your Wealth in a High Inflation Environment
How to analyze the Federal Reserve's monetary policy?
Rapidly Rising US Housing Prices: Opportunity or Risk?
How Will the US Dollar Perform in 2024? A Closer Look into the US Dollar Index
Discussing the driving forces behind rises in gold prices
Investing and Labor Market Indicators
Discover the bond market: A quick and easy guide
The Underlying Conflicts Surrounding Crude Oil Prices
Understanding the relationship between the stock market and the bond market
Understanding the US Non-Farm Payroll Data
Understanding the Federal Reserve Interest Rate Decision
Understanding the CCI
Understanding the PPI
Understanding the Retail Sales
Understanding the US Crude Oil Inventories
Understanding the Durable Goods Orders
Listen to the Fed's speakers: Hawks or doves?
Open the Fed's monetary policy toolbox
The Fed Dot Plot explained: What it says about US interest rates
How does monetary policy steer our lives and investment
What the Federal Reserve does?
Understanding the GDP
A brief history lesson on the Fed and U.S. economy
08 Carl Icahn & Icahn Enterprises
09 Seth Klarman & Baupost Group
07 Howard Marks & Oaktree Capital
01 Using 13F filings to learn from big investors
03 How to Read Form 13F
02 Identify a fund's investment strategy
04 Warren Buffett & Berkshire Hathaway
06 Ray Dalio & Bridgewater Associates
05 Bill Ackerman & Pershing Square Capital
Why does Warren Buffett say don't piggyback on his trades?
How does nonfarm payroll impact the global market?
Unveiling Inflation: Why is Your Wallet Shrinking?
Mastering the Dollar Cycle: How to invest in a changing economy
Gold vs. Gold Miners: A Comparison
Are U.S. Treasuries still a safe haven?
Meet Dr. Copper: Understanding the Copper Market
Do Oil Price Swings Rock the Stock Market?
How Tariffs Could Impact the Copper Landscape?
Why do oil ETFs lag behind oil prices in the long run?
Why is the US dollar so powerful worldwide, and how can we tell?
A look at employment: what other indicators are there?
GDP: The Barometer of National Prosperity
Understanding Treasury Auctions: A Step-by-Step Guide
Unpacking the U.S. Debt Issue
Why is Oil Called the "Mother of All Commodities"?
How Inflation Affects the Market
How to interpret the Fed dot plot?
How to Decode Inflation: CPI, PCE, and PPI
Understanding Bessent's Fiscal Blueprint
The Rise of the Fed: Can Trump Dismiss Powell?
What's in the Fed's Toolbox?
'Oracle of Omaha' Warren Buffett:ROE>20% is preferable
'Father of value investing' Benjamin Graham: Ten Stock Selection Criteria
Strong Consumer Spending Despite Economic Slowdown: Here's Why
Analyzing the manufacturing industry may help you grasp economic trends
What is the Debt Ceiling? A Deep Dive into US Fiscal Policy
How to Preserve Your Wealth in a High Inflation Environment
How to analyze the Federal Reserve's monetary policy?
Rapidly Rising US Housing Prices: Opportunity or Risk?
How Will the US Dollar Perform in 2024? A Closer Look into the US Dollar Index
Discussing the driving forces behind rises in gold prices
Investing and Labor Market Indicators
Discover the bond market: A quick and easy guide
The Underlying Conflicts Surrounding Crude Oil Prices
Understanding the relationship between the stock market and the bond market
Understanding the US Non-Farm Payroll Data
Understanding the Federal Reserve Interest Rate Decision
Understanding the CCI
Understanding the PPI
Understanding the Retail Sales
Understanding the US Crude Oil Inventories
Understanding the Durable Goods Orders
Listen to the Fed's speakers: Hawks or doves?
Open the Fed's monetary policy toolbox
The Fed Dot Plot explained: What it says about US interest rates
How does monetary policy steer our lives and investment
What the Federal Reserve does?
Understanding the GDP
A brief history lesson on the Fed and U.S. economy
08 Carl Icahn & Icahn Enterprises
09 Seth Klarman & Baupost Group
07 Howard Marks & Oaktree Capital
01 Using 13F filings to learn from big investors
03 How to Read Form 13F
02 Identify a fund's investment strategy
04 Warren Buffett & Berkshire Hathaway
06 Ray Dalio & Bridgewater Associates
05 Bill Ackerman & Pershing Square Capital

