






Moomoo Insights
Jul 16 15:38
TSMC Earnings: AI Demand Is Stronger Than the Chip Selloff Suggests
Moomoo Insights
Sep 30 05:04
Live Take | Anthropic’s $518B Compute Bet: Who Wins From the AI Buildout?

In the previous sections, we've learned that 13F filings allow investors to track the holdings of star Wall Street funds.
However, not all filings offer valuable information, so you'd better first analyze their investment strategies before referring to their reports.
Assume you have a 13F report. What to look for then?
Before we dive into details, let's first take a look at the report's contents.
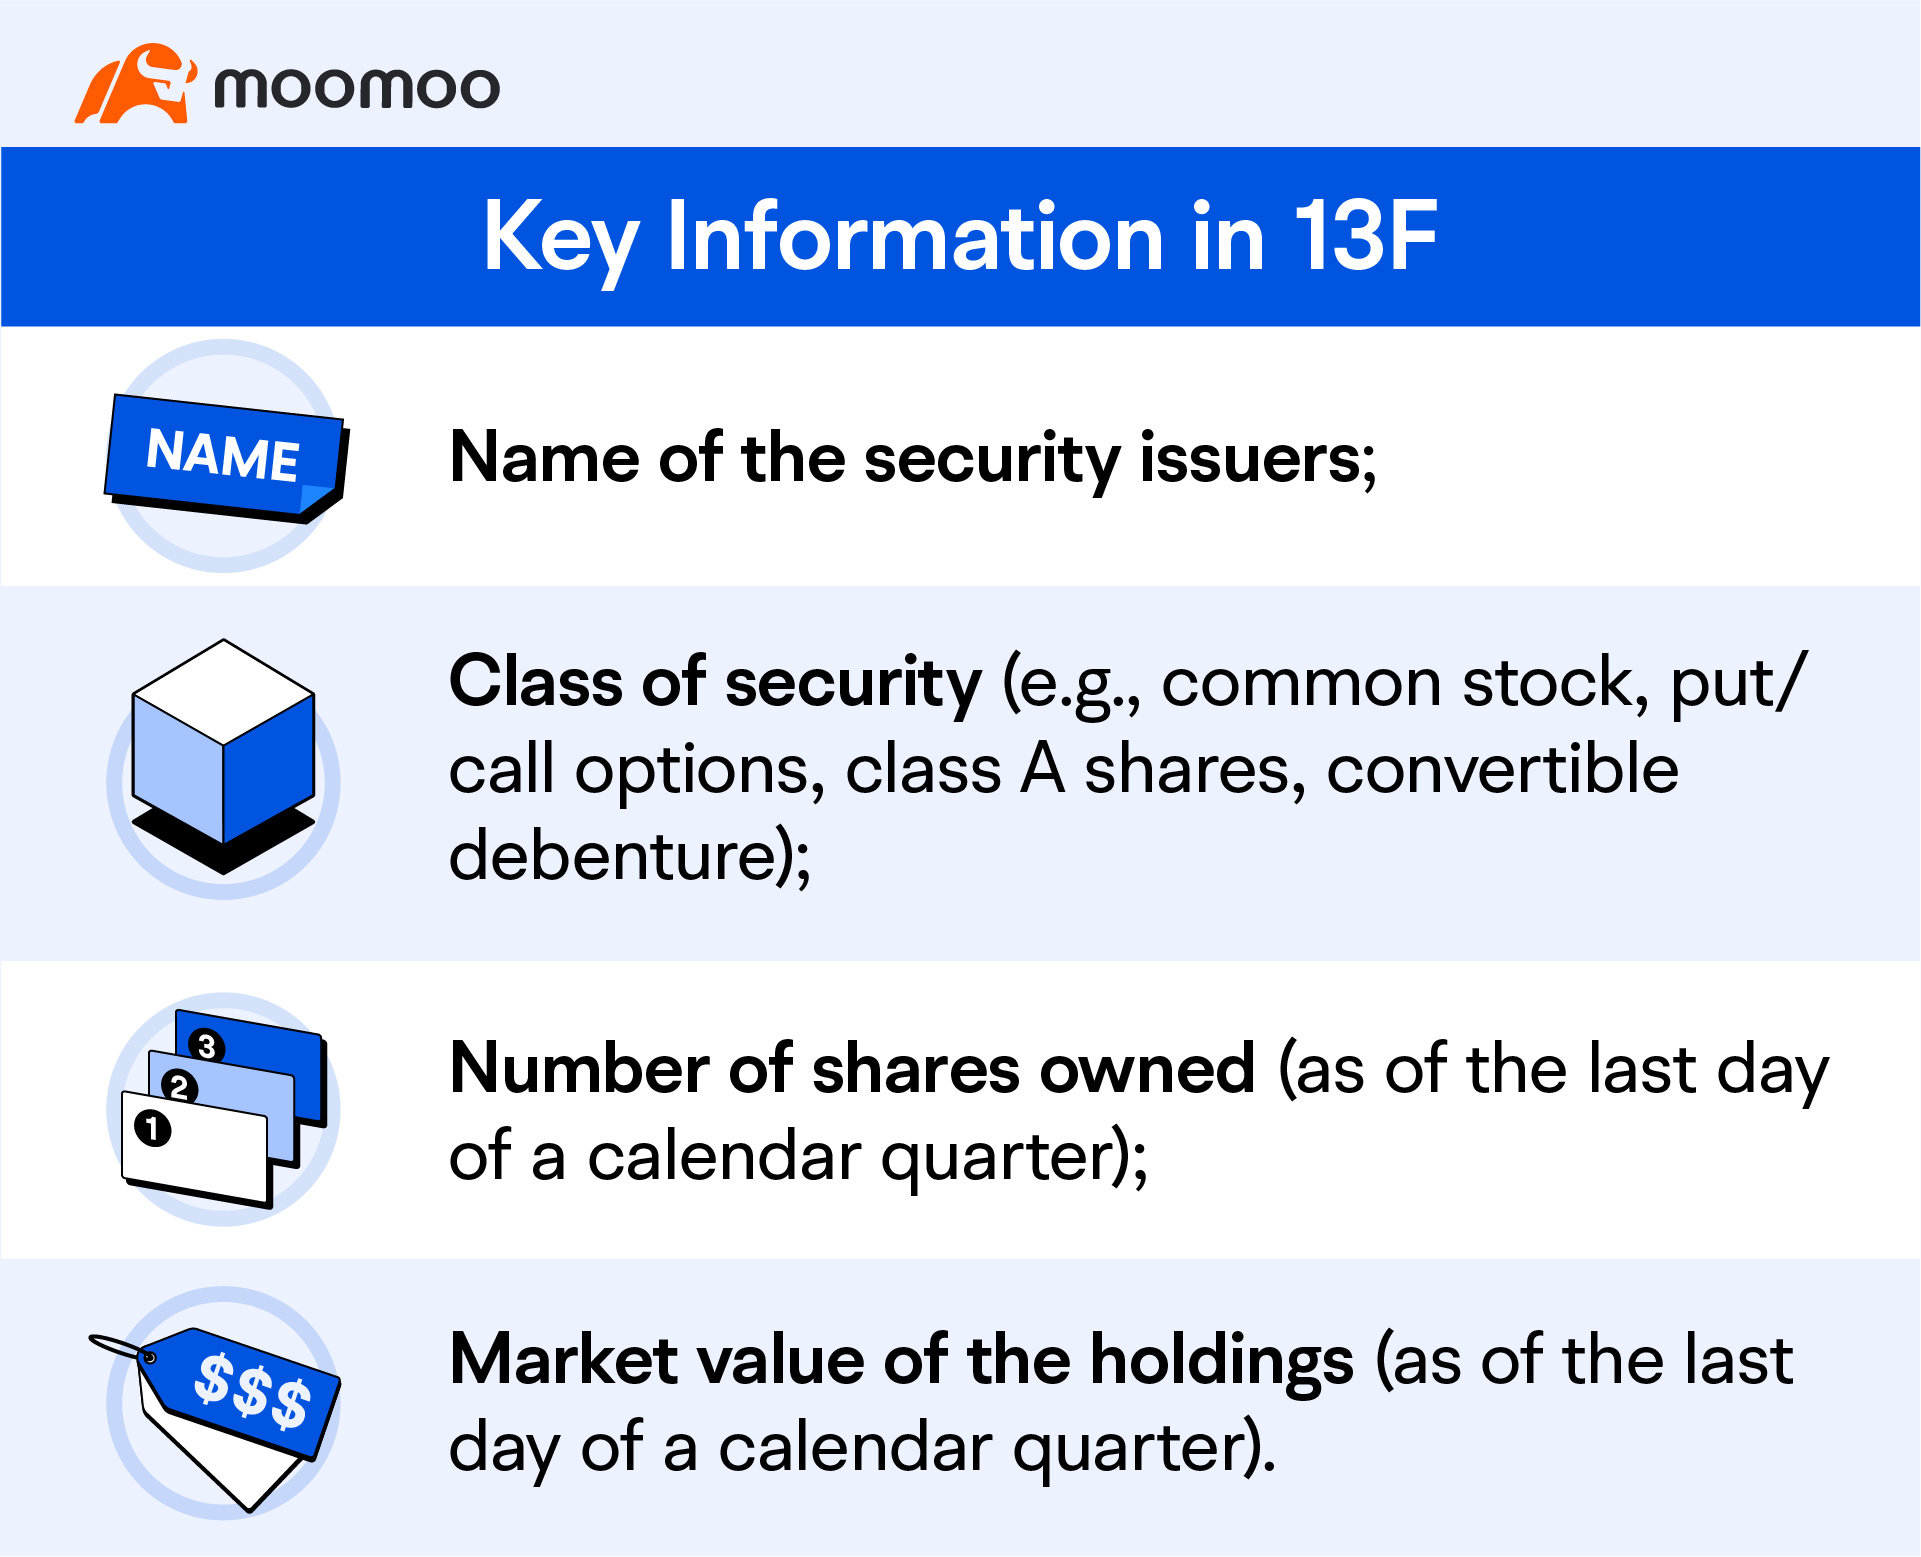
The report contains a lot of information, but the most important ones include:
● Name of the security issuers;
● Class of security (e.g., common stock, put/call options, class A shares, convertible debenture);
● Number of shares owned (as of the last day of a calendar quarter);
● Market value of the holdings (as of the last day of a calendar quarter).
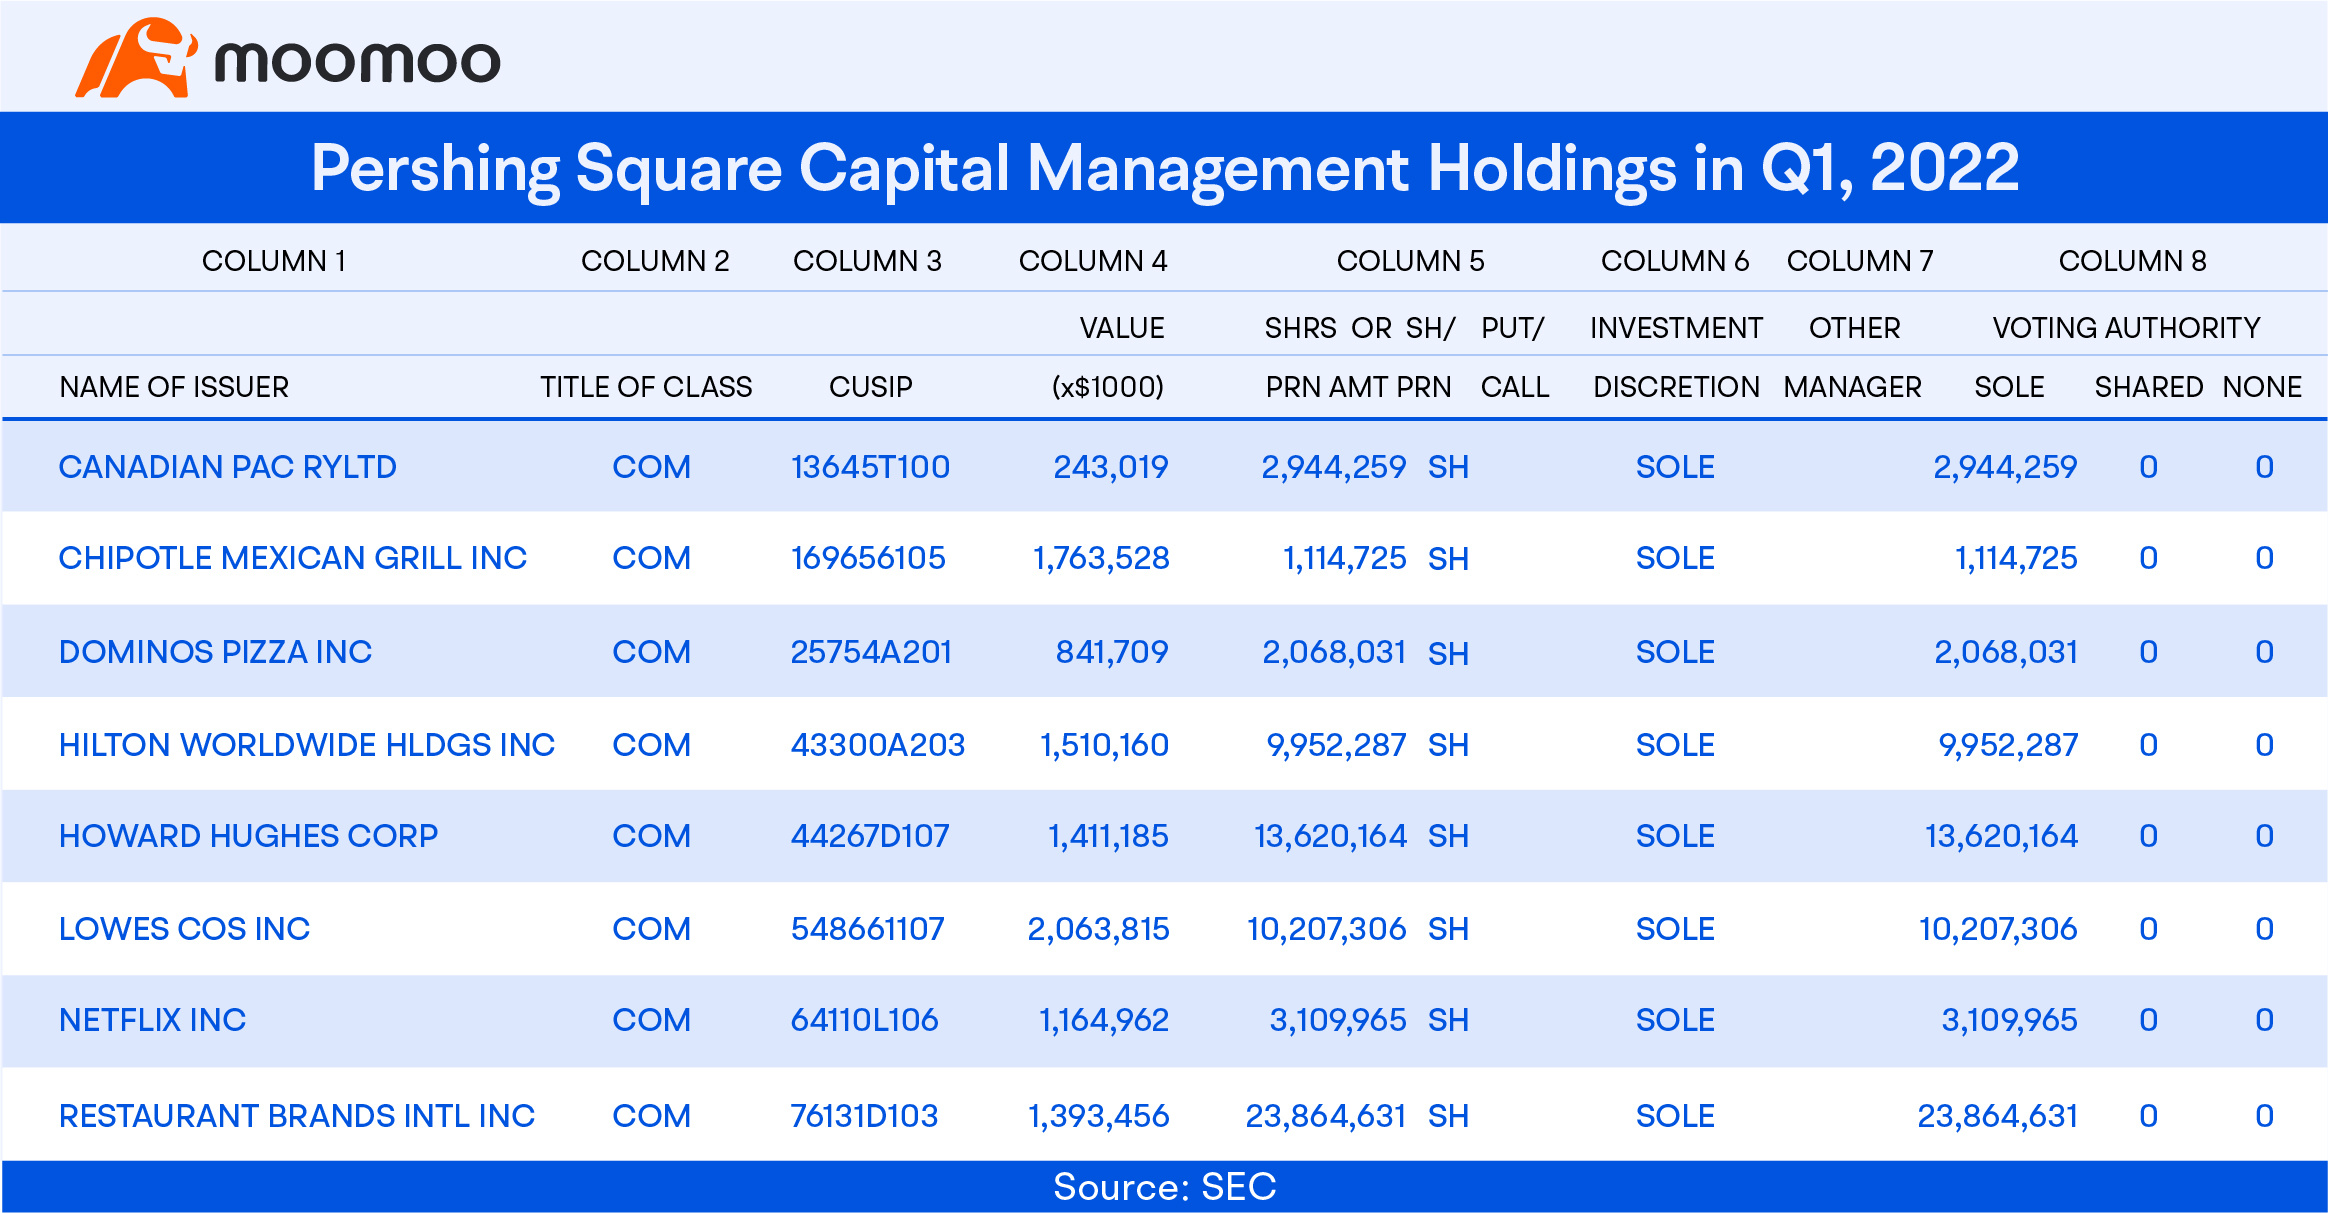
The above picture is a snapshot of the 13F report in Q1 2022 of Pershing Square Capital Management led by Bill Ackman. Column 1 shows the name of the securities the fund held, while Column 2 is the class of security. The market value of each security and the number of shares are listed in Column 4 and Column 5, respectively.
The report reveals that Pershing Square held eight stocks in its portfolio as of the end of the first quarter of 2022. The top 5 holdings by market value are Lowe's Companies Inc., Chipotle, Hilton, The Howard Hughes, and Restaurant Brands International.
However, the data itself only tells part of the story as it is yet to be sorted. To get a deeper understanding of the report, you also need to look at changes in institutional holdings.
How the holdings changes of a fund matter even more than its portfolio in 13F analysis.
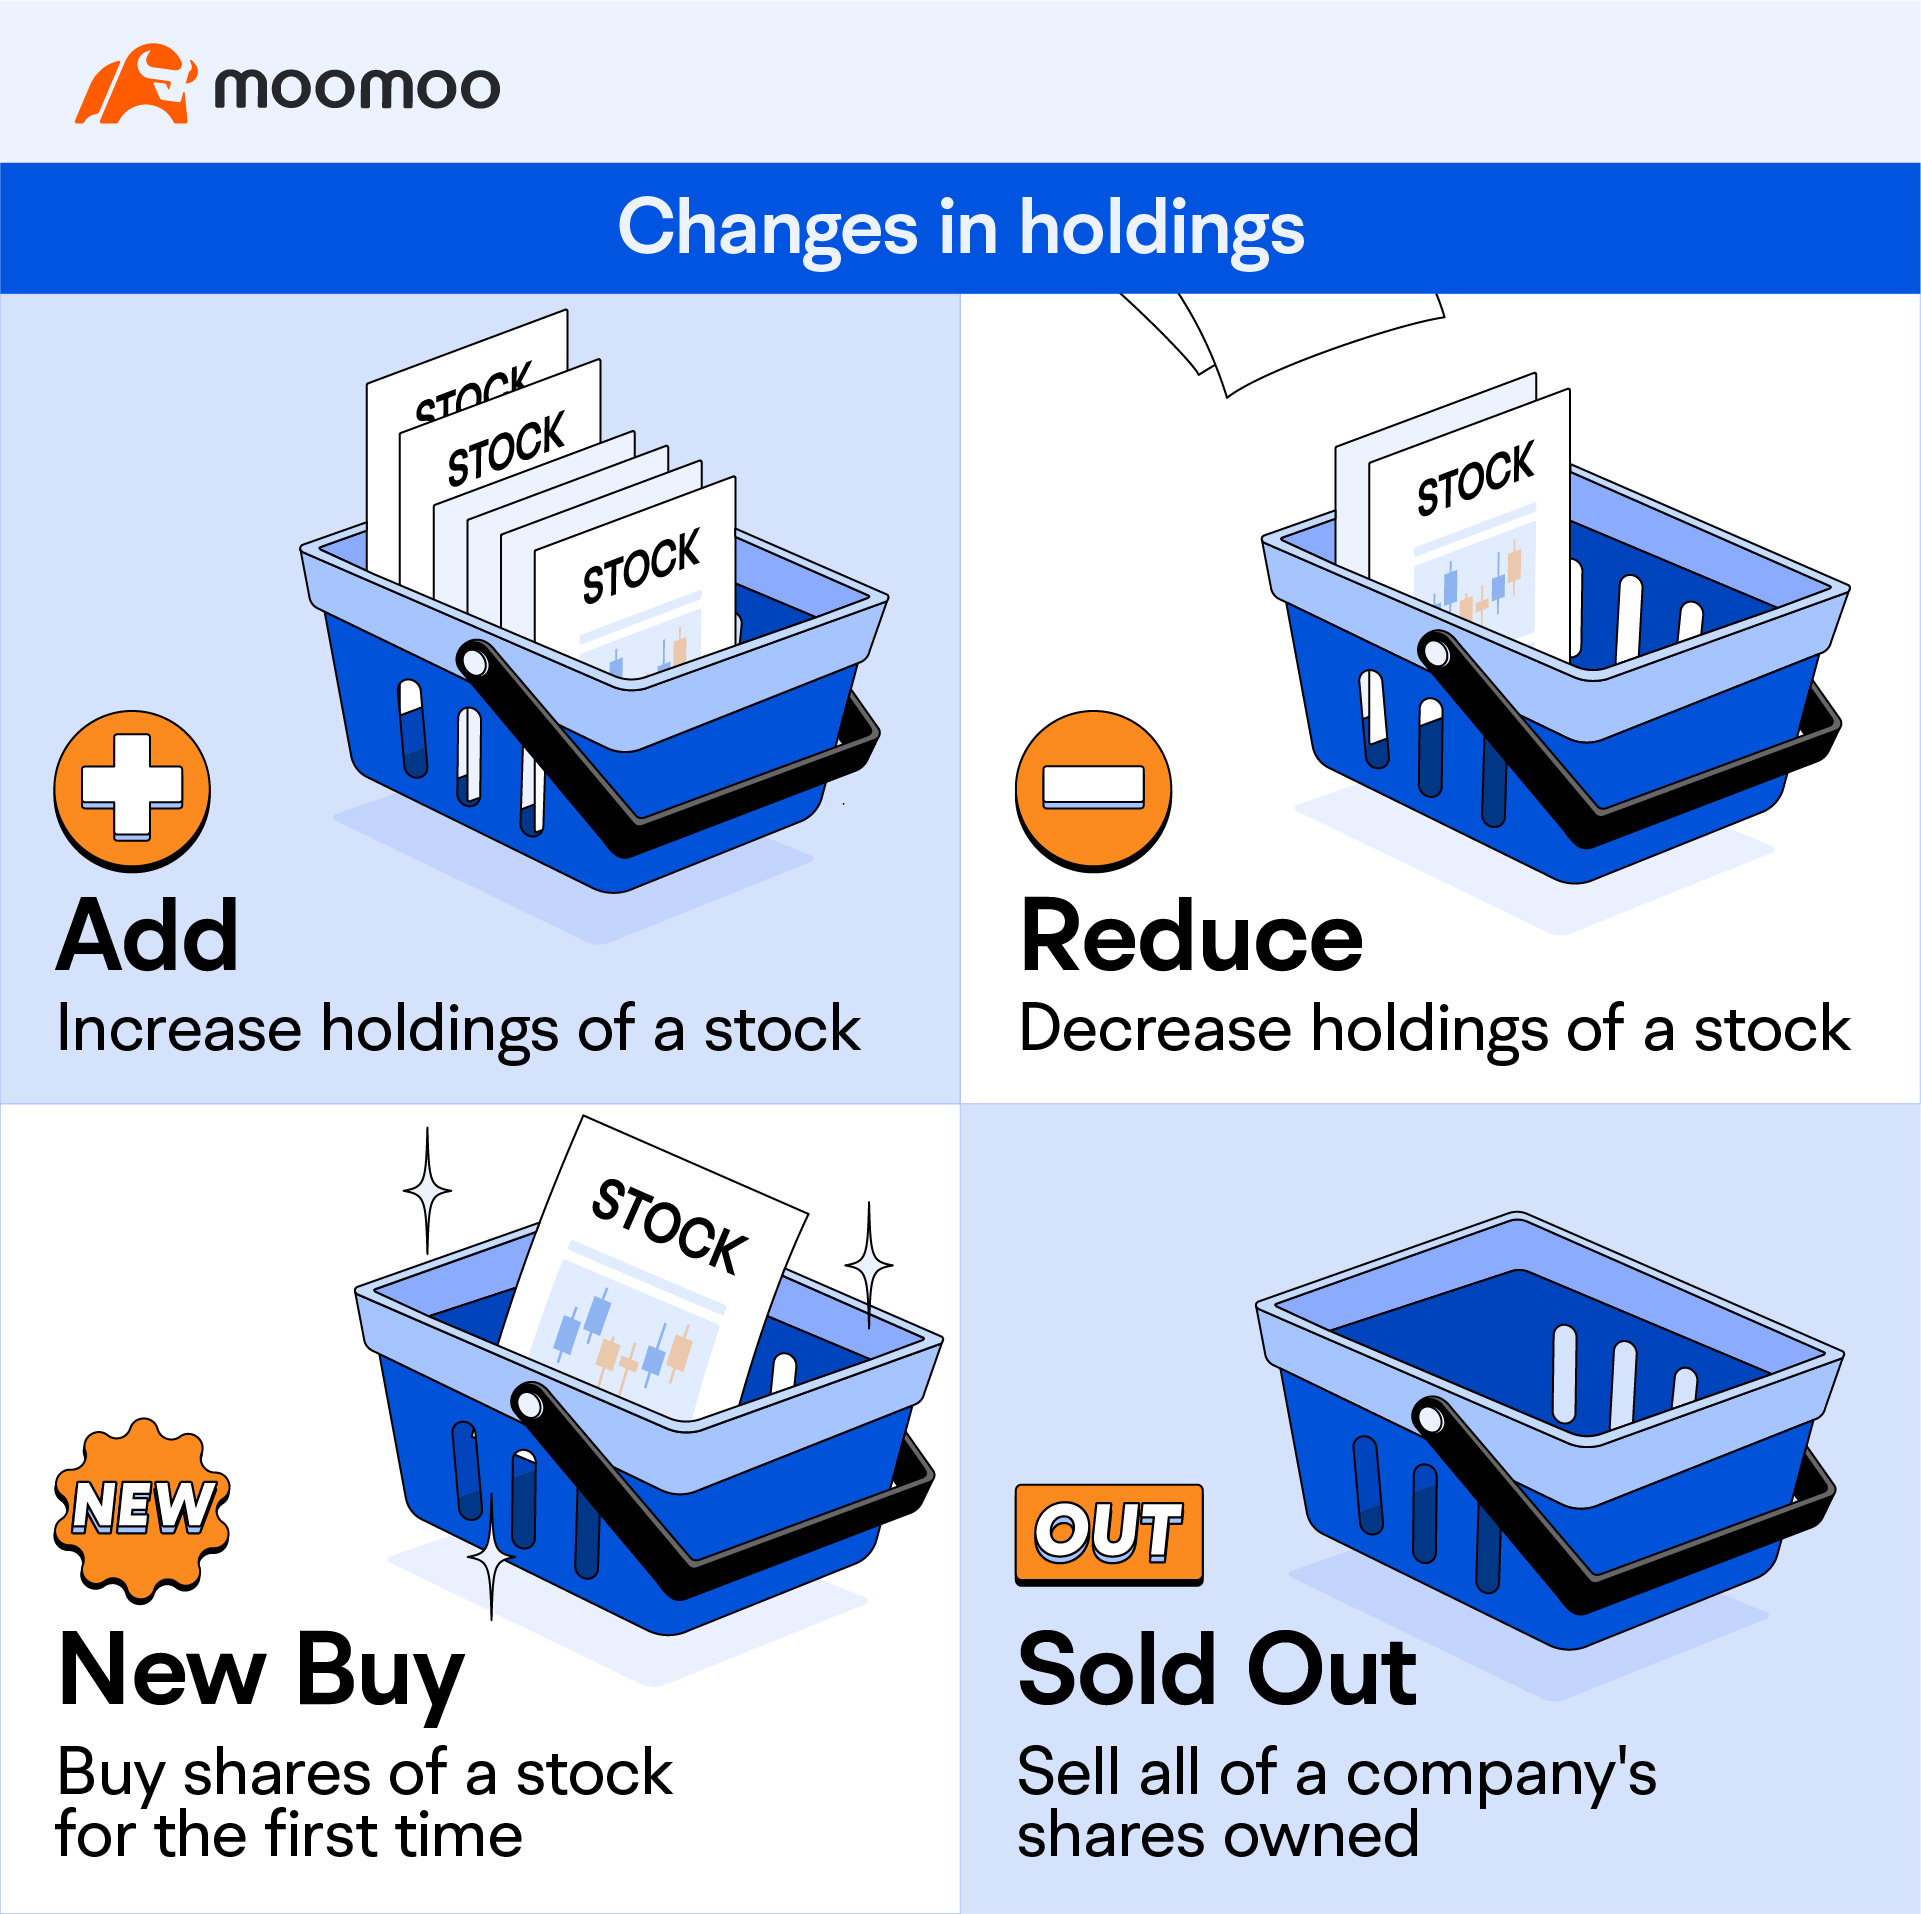
Changes in holdings refer to whether a fund manager increases or decreases holdings of a given stock, buys shares of a new company, or sells out a stock in a particular quarter. This information might help you see through the actions of a fund manager.
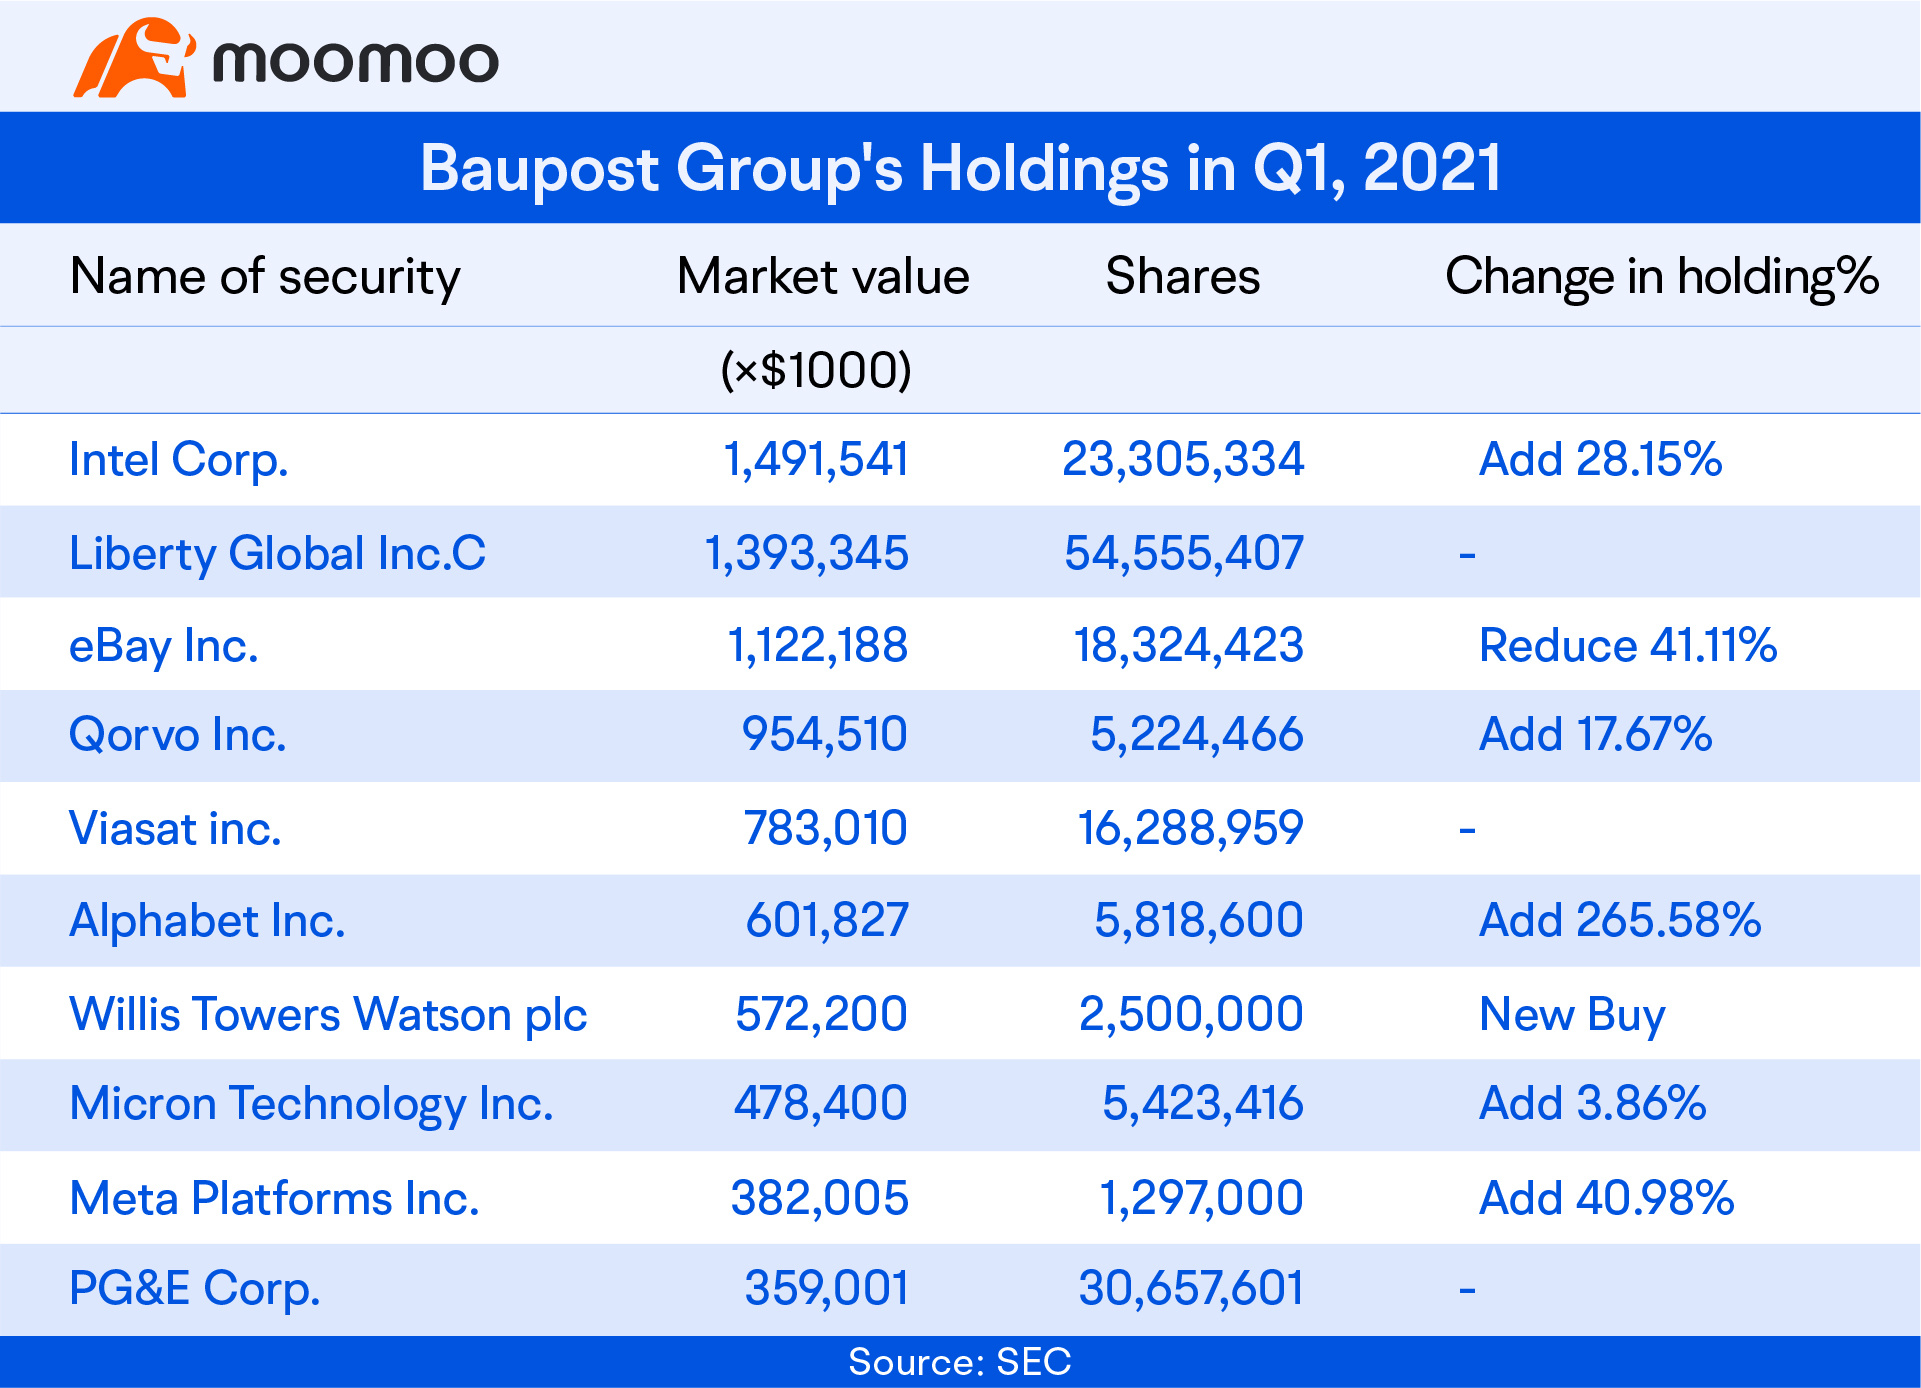
Take Baupost Group's 13F report in Q1 2021 as an example. This fund is managed by Seth Klarman, a renowned value investor.
If looking at the top 10 holdings in his portfolio only, you'll find eBay was the third-largest holding by market value for the quarter. So you may think Baupost Group was bullish on eBay.
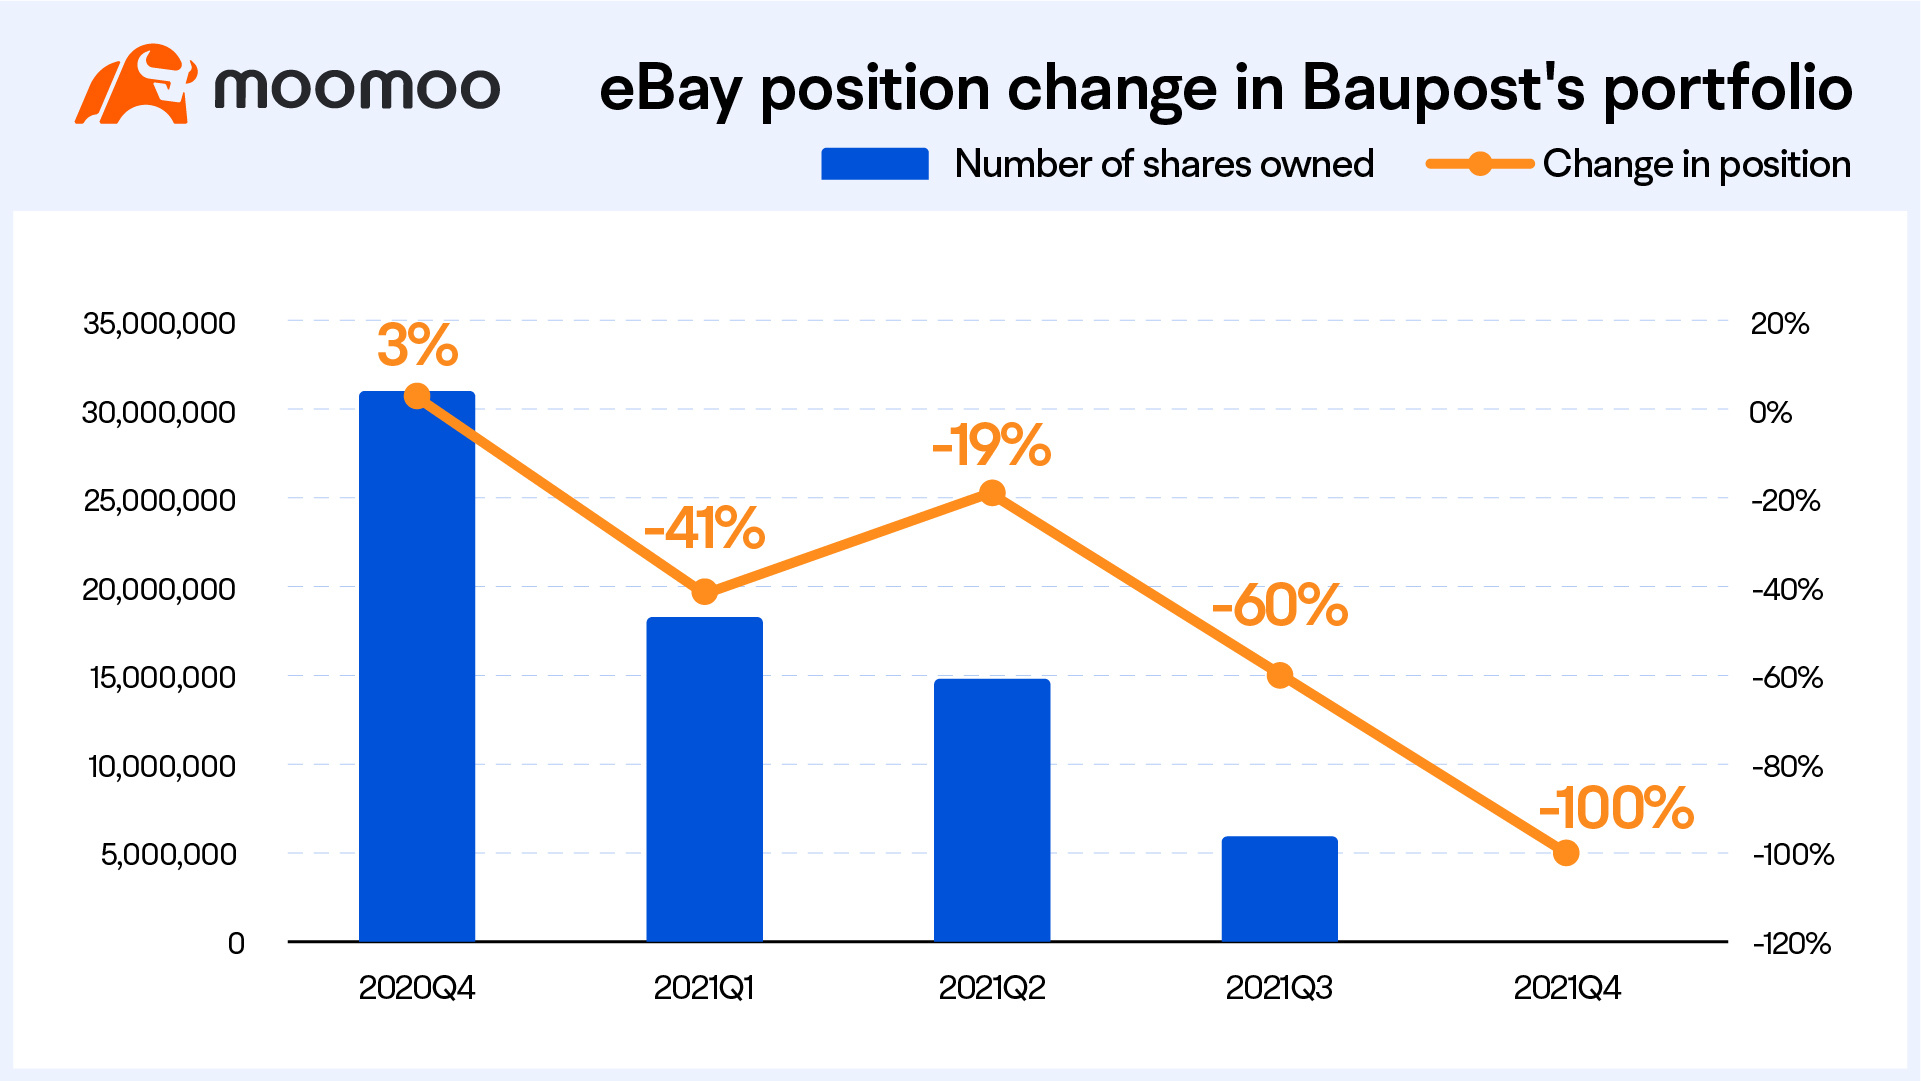
However, if you take another look at how the positions changed, you'll see Baupost Group reduced its stake in eBay by about 41.1%, from 32.12 million shares in Q4 2020 to 18.32 million in Q1 2021. Now it's clear that the fund manager might be less optimistic about the company.
However bear in mind that fund managers may change their positions for various reasons, such as shifts in the macroeconomic environment and the company's fundamentals. So study the change case by case.
Another critical element of analyzing a 13F report is to keep track of the company's filings over time. In this way, you can observe how your favorite investors apply their investment strategies.
If a fund manager you track bought a new stock and continued to increase its position over the past quarters, you may choose to dig deeper into the underlying company as you're curious to know why.
Conversely, if you notice that the institution you watch kept reducing its exposure to a particular stock, you'd better examine the company's fundamentals to see whether they've worsened.
Let's go back to the previous example. If you've closely tracked Seth's 13Fs, you'll see the fund had been trimming its eBay position since Q1 2021 and completely exited the position in Q4 2021.
Again, tracking the guru's portfolio doesn't mean you should always follow suit. Even the best fund managers may make mistakes. So it's not a good idea to make a buy or sell decision solely based on the information discovered in 13F filings.
In addition, books, annual letters, and interviews of famous fund managers can be a good reference for your analysis of holding changes.
For example, Warren Buffett writes an open letter to Berkshire Hathaway shareholders every year to share his view of the market. By reading these letters, you may get a sense of his investment strategy.
We hope you now have a general picture of Form 13F after learning these three lessons. Let's recap the key points:
13Fs allow investors to track the holdings of star Wall Street funds. But remember that the reports are only part of the picture and have a lag.
Study a fund's investment strategy before reading its 13F filings. Reports of long-only institutions with a long-term horizon and outstanding performance records are generally more valuable sources of information for you.
The key to reading a 13F is to analyze how the positions changed and track the changes over time.
This presentation is for informational and educational use only and is not a recommendation or endorsement of any particular investment or investment strategy. Investment information provided in this content is general in nature, strictly for illustrative purposes, and may not be appropriate for all investors. Read more
Recommend
Why does Warren Buffett say don't piggyback on his trades?

How does nonfarm payroll impact the global market?
Unveiling Inflation: Why is Your Wallet Shrinking?

Mastering the Dollar Cycle: How to invest in a changing economy
Gold vs. Gold Miners: A Comparison
Are U.S. Treasuries still a safe haven?
Meet Dr. Copper: Understanding the Copper Market
Do Oil Price Swings Rock the Stock Market?
How Tariffs Could Impact the Copper Landscape?
Why do oil ETFs lag behind oil prices in the long run?
Why is the US dollar so powerful worldwide, and how can we tell?
A look at employment: what other indicators are there?
GDP: The Barometer of National Prosperity
Understanding Treasury Auctions: A Step-by-Step Guide
Unpacking the U.S. Debt Issue
Why is Oil Called the "Mother of All Commodities"?
How Inflation Affects the Market
How to interpret the Fed dot plot?
How to Decode Inflation: CPI, PCE, and PPI
Understanding Bessent's Fiscal Blueprint
The Rise of the Fed: Can Trump Dismiss Powell?
What's in the Fed's Toolbox?
'Oracle of Omaha' Warren Buffett:ROE>20% is preferable
'Father of value investing' Benjamin Graham: Ten Stock Selection Criteria
Strong Consumer Spending Despite Economic Slowdown: Here's Why
Analyzing the manufacturing industry may help you grasp economic trends
What is the Debt Ceiling? A Deep Dive into US Fiscal Policy
How to Preserve Your Wealth in a High Inflation Environment
How to analyze the Federal Reserve's monetary policy?
Rapidly Rising US Housing Prices: Opportunity or Risk?
How Will the US Dollar Perform in 2024? A Closer Look into the US Dollar Index
Discussing the driving forces behind rises in gold prices
Investing and Labor Market Indicators
Discover the bond market: A quick and easy guide
The Underlying Conflicts Surrounding Crude Oil Prices
Understanding the relationship between the stock market and the bond market
Understanding the US Non-Farm Payroll Data
Understanding the Federal Reserve Interest Rate Decision
Understanding the CCI
Understanding the PPI
Understanding the Retail Sales
Understanding the US Crude Oil Inventories
Understanding the Durable Goods Orders
Listen to the Fed's speakers: Hawks or doves?
Open the Fed's monetary policy toolbox
The Fed Dot Plot explained: What it says about US interest rates
How does monetary policy steer our lives and investment
What the Federal Reserve does?
Understanding the GDP
A brief history lesson on the Fed and U.S. economy
08 Carl Icahn & Icahn Enterprises
09 Seth Klarman & Baupost Group
07 Howard Marks & Oaktree Capital
01 Using 13F filings to learn from big investors
03 How to Read Form 13F
02 Identify a fund's investment strategy
04 Warren Buffett & Berkshire Hathaway
06 Ray Dalio & Bridgewater Associates
05 Bill Ackerman & Pershing Square Capital
Why does Warren Buffett say don't piggyback on his trades?
How does nonfarm payroll impact the global market?
Unveiling Inflation: Why is Your Wallet Shrinking?
Mastering the Dollar Cycle: How to invest in a changing economy
Gold vs. Gold Miners: A Comparison
Are U.S. Treasuries still a safe haven?
Meet Dr. Copper: Understanding the Copper Market
Do Oil Price Swings Rock the Stock Market?
How Tariffs Could Impact the Copper Landscape?
Why do oil ETFs lag behind oil prices in the long run?
Why is the US dollar so powerful worldwide, and how can we tell?
A look at employment: what other indicators are there?
GDP: The Barometer of National Prosperity
Understanding Treasury Auctions: A Step-by-Step Guide
Unpacking the U.S. Debt Issue
Why is Oil Called the "Mother of All Commodities"?
How Inflation Affects the Market
How to interpret the Fed dot plot?
How to Decode Inflation: CPI, PCE, and PPI
Understanding Bessent's Fiscal Blueprint
The Rise of the Fed: Can Trump Dismiss Powell?
What's in the Fed's Toolbox?
'Oracle of Omaha' Warren Buffett:ROE>20% is preferable
'Father of value investing' Benjamin Graham: Ten Stock Selection Criteria
Strong Consumer Spending Despite Economic Slowdown: Here's Why
Analyzing the manufacturing industry may help you grasp economic trends
What is the Debt Ceiling? A Deep Dive into US Fiscal Policy
How to Preserve Your Wealth in a High Inflation Environment
How to analyze the Federal Reserve's monetary policy?
Rapidly Rising US Housing Prices: Opportunity or Risk?
How Will the US Dollar Perform in 2024? A Closer Look into the US Dollar Index
Discussing the driving forces behind rises in gold prices
Investing and Labor Market Indicators
Discover the bond market: A quick and easy guide
The Underlying Conflicts Surrounding Crude Oil Prices
Understanding the relationship between the stock market and the bond market
Understanding the US Non-Farm Payroll Data
Understanding the Federal Reserve Interest Rate Decision
Understanding the CCI
Understanding the PPI
Understanding the Retail Sales
Understanding the US Crude Oil Inventories
Understanding the Durable Goods Orders
Listen to the Fed's speakers: Hawks or doves?
Open the Fed's monetary policy toolbox
The Fed Dot Plot explained: What it says about US interest rates
How does monetary policy steer our lives and investment
What the Federal Reserve does?
Understanding the GDP
A brief history lesson on the Fed and U.S. economy
08 Carl Icahn & Icahn Enterprises
09 Seth Klarman & Baupost Group
07 Howard Marks & Oaktree Capital
01 Using 13F filings to learn from big investors
03 How to Read Form 13F
02 Identify a fund's investment strategy
04 Warren Buffett & Berkshire Hathaway
06 Ray Dalio & Bridgewater Associates
05 Bill Ackerman & Pershing Square Capital

