
Moomoo Insights
Jul 16 15:38
TSMC Earnings: AI Demand Is Stronger Than the Chip Selloff Suggests
Moomoo Insights
Sep 30 05:04
Live Take | Anthropic’s $518B Compute Bet: Who Wins From the AI Buildout?

Understanding the Fed's moves is crucial for making smart investment decisions.
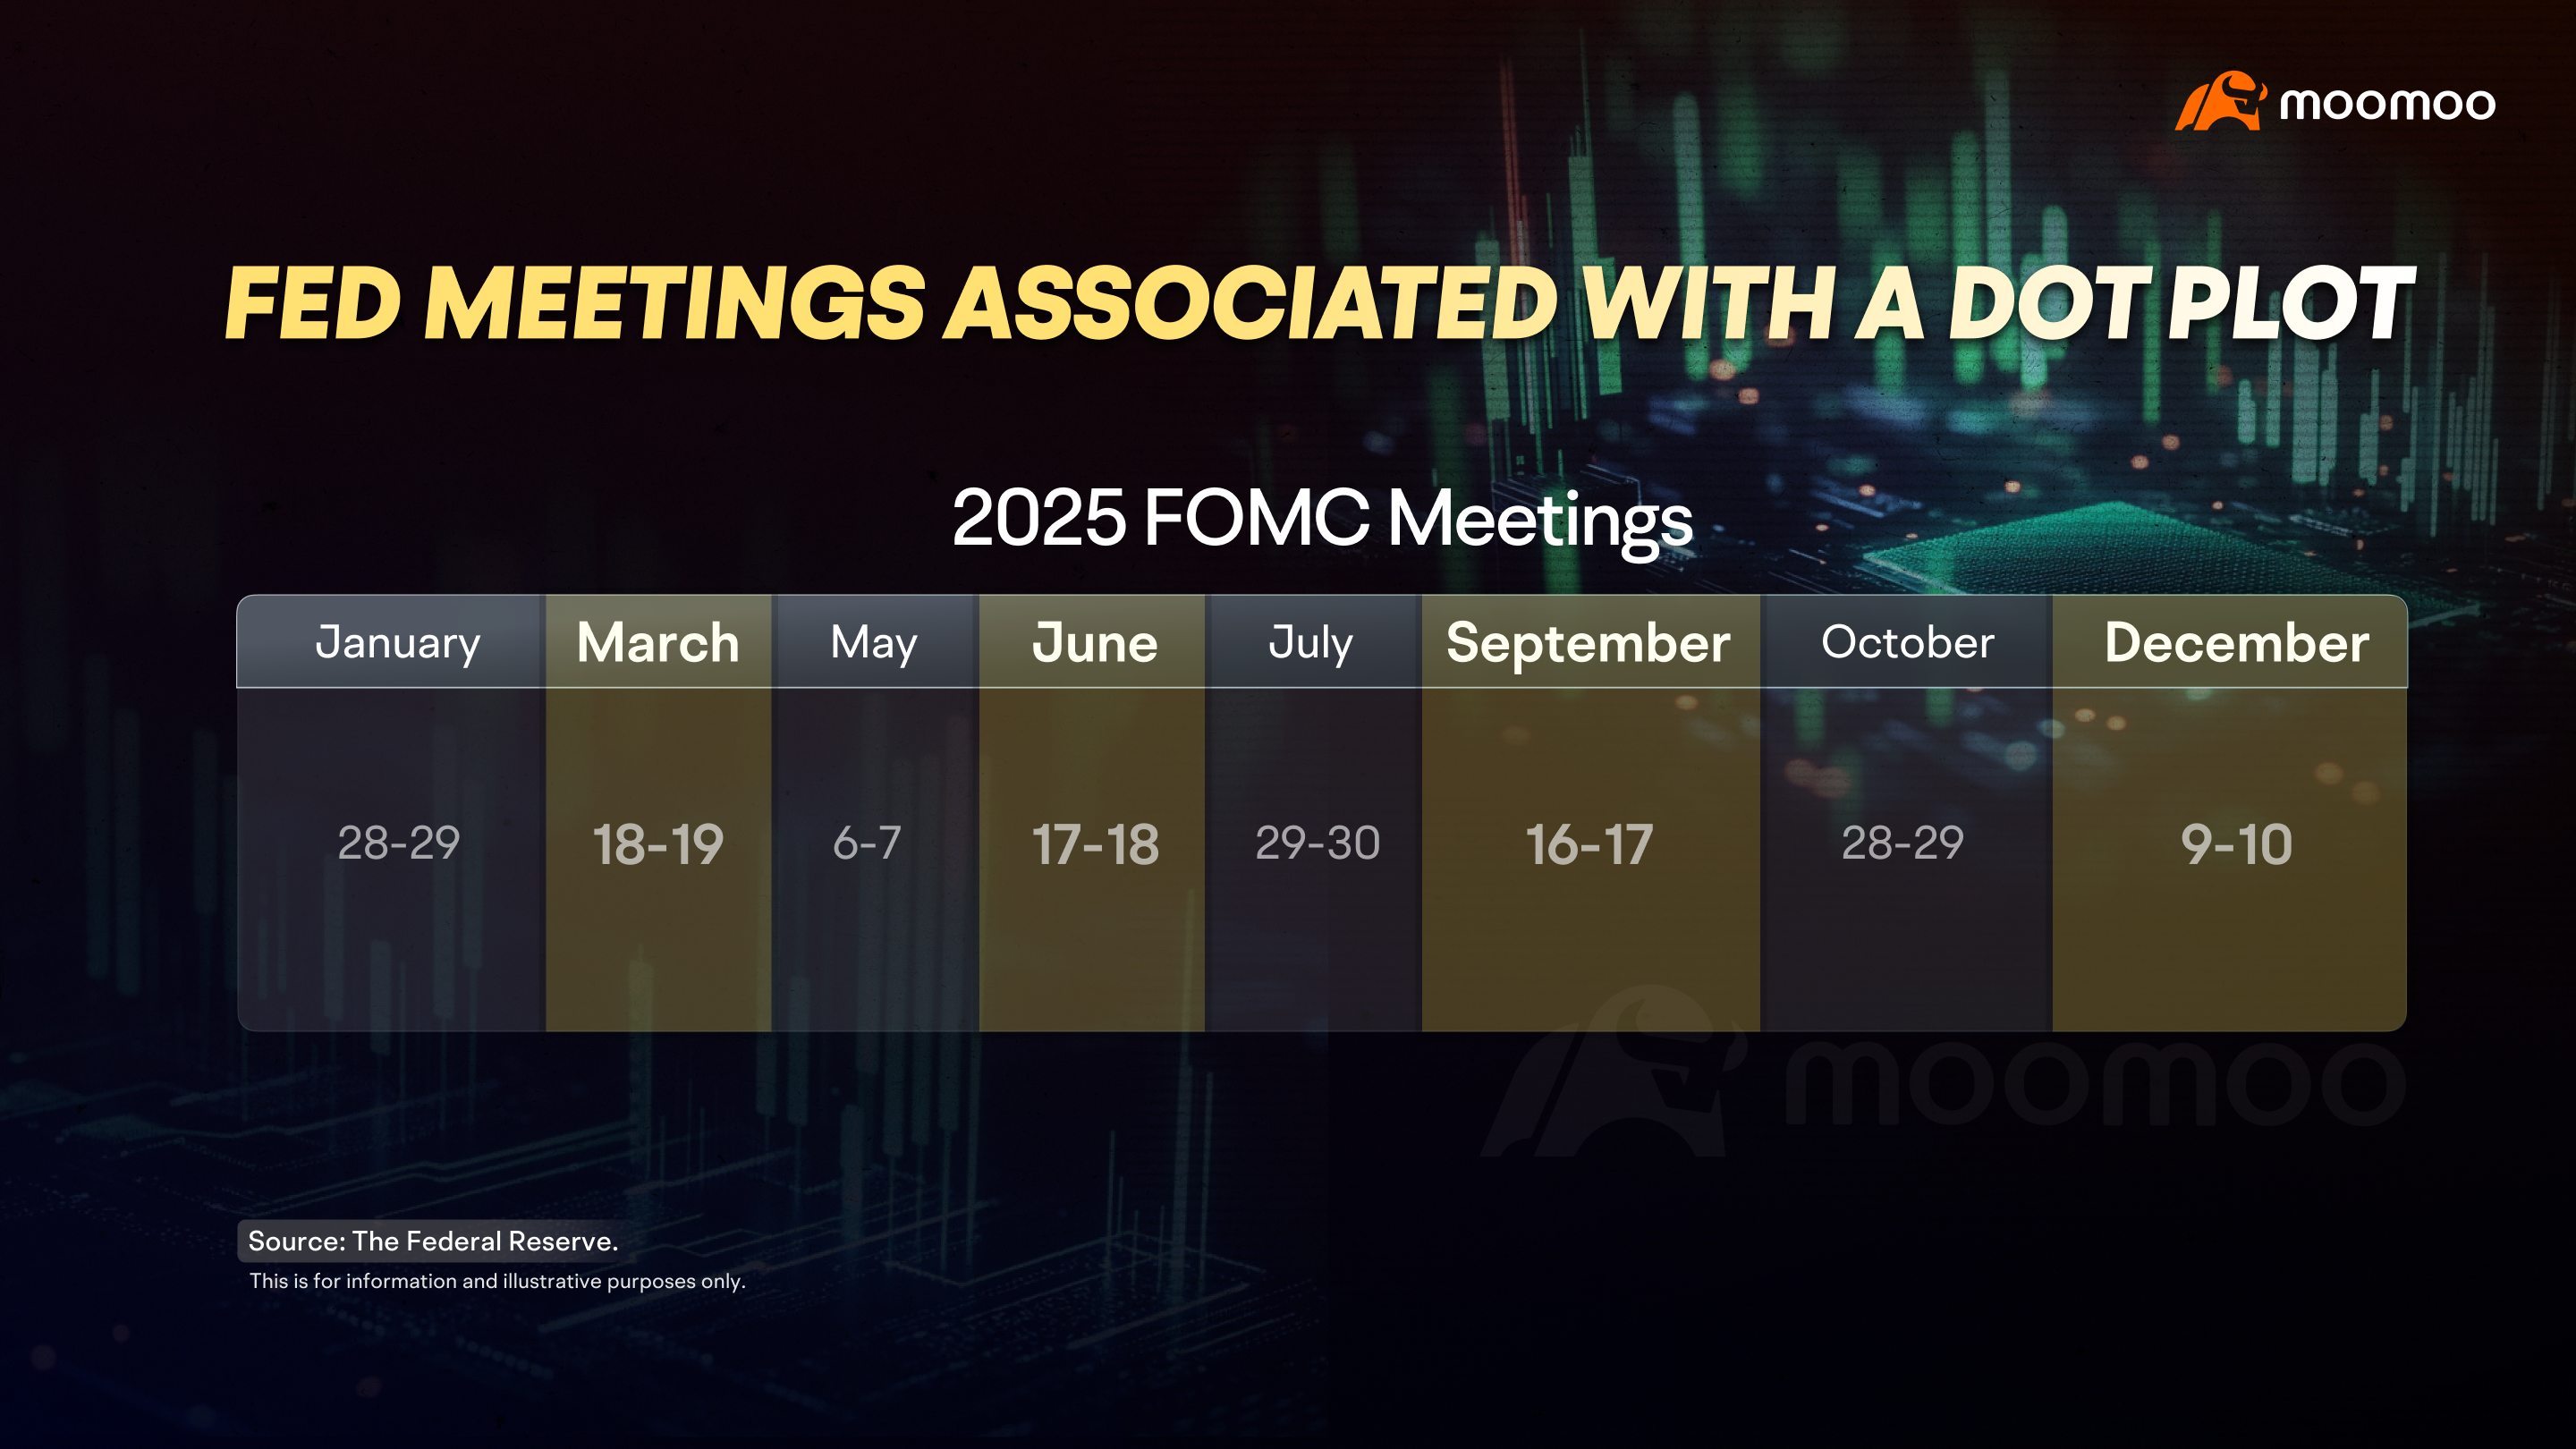
The Fed usually holds eight meetings each year and forecasts future interest rate paths at the end of each quarter's meeting.
It is famously known in the financial market as the "dot plot."
Takeaways:
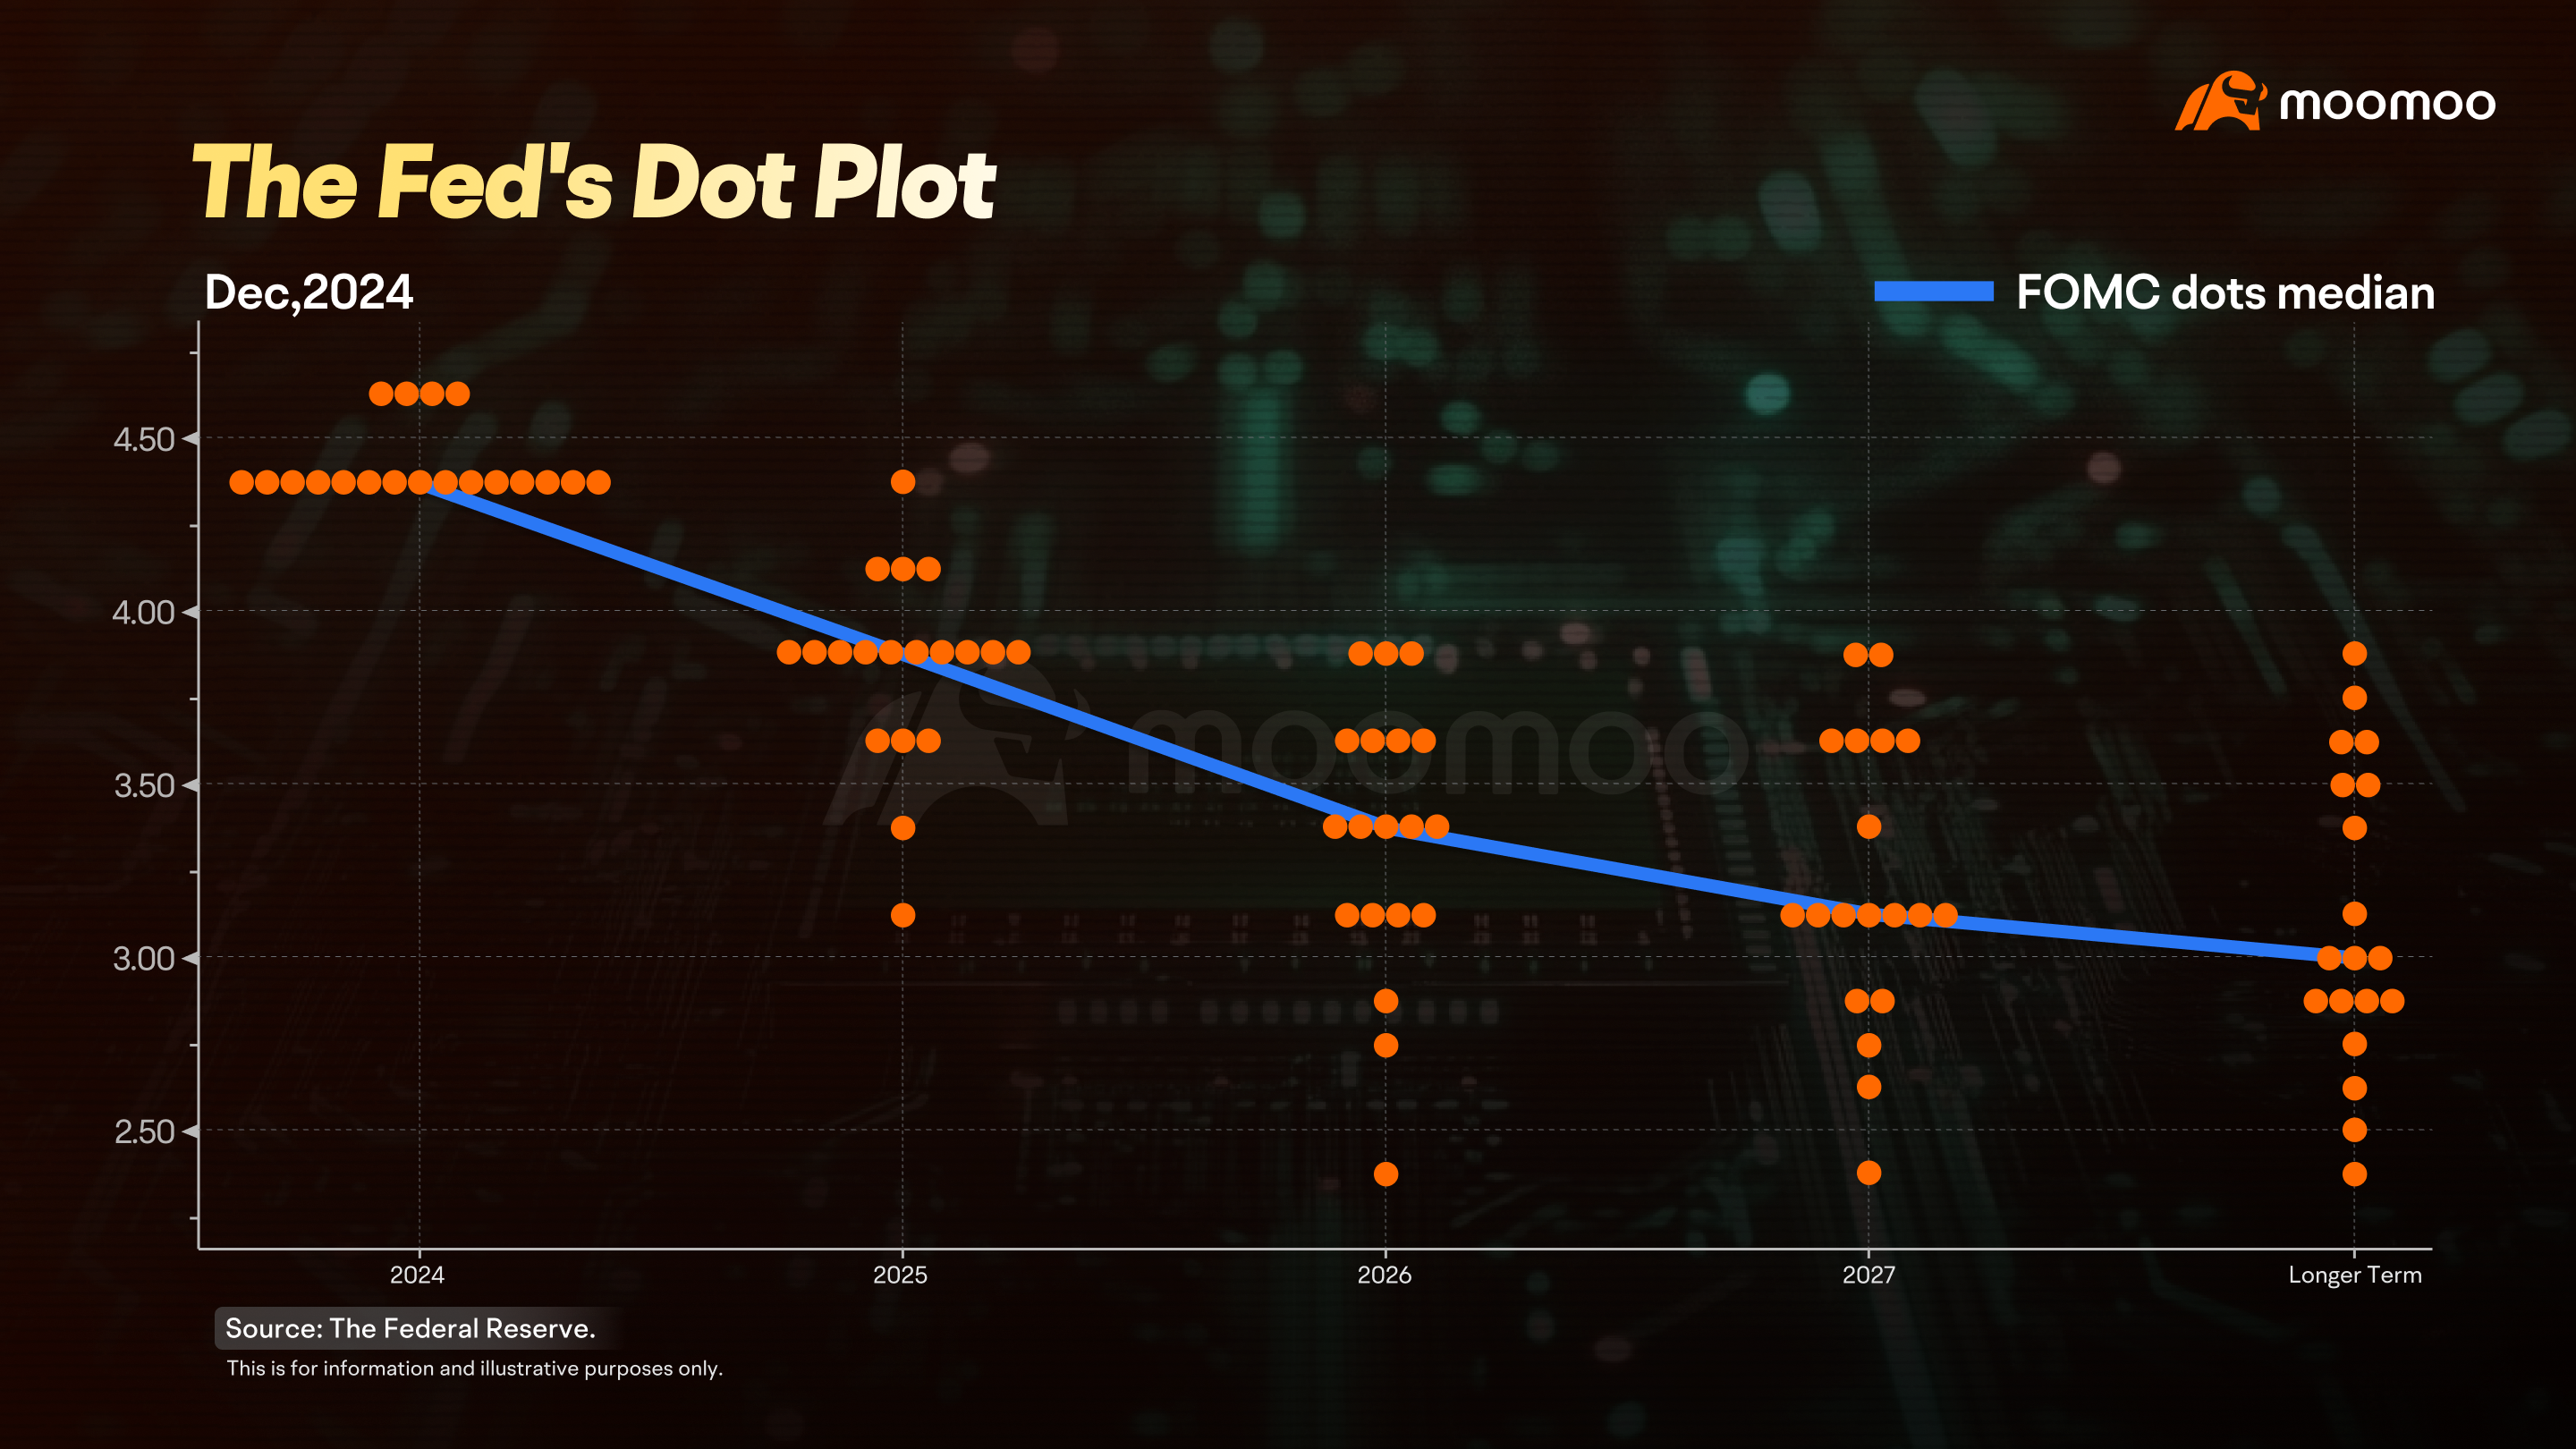
The Fed dot plot visualizes interest rate projections, with dots representing each participant's prediction.
Clusters of dots show consensus, while scattered dots suggest varied opinions, especially for long-term forecasts.
The FedWatch tool estimates probabilities of rate changes, offering insight into market expectations.
At first glance, the dot plot might look like complex Morse code, but don't worry, it's not as tough to decode as it seems.
Let’s use the dot plot from the Fed’s December 2024 meeting as an example:
On the horizontal axis, you’ve got the years. The far left shows the latest interest rate decision, and as you move right, you’ll see the projections for the next three years and beyond.
The vertical axis shows specific interest rates, with each little box representing 0.25 percentage points, or 25 basis points (bps).
You might hear in the news about the Fed hiking or cutting rates by so many bps. Just remember, 1 percentage point equals 100 basis points.
Each dot represents a participant's prediction for future interest rates, and the median of these dots is seen as the Fed's "mainstream expectation."
If the dots are packed together, the decision-makers have a consensus. If they’re scattered, opinions are more varied. Usually, there’s more agreement on the current meeting, but things get more spread out as you look further into the future.
Now, the market doesn’t just sit around waiting. It forms its own expectations about the Fed’s rate decisions, and a handy tool to check these expectations is the FedWatch.
It crunches the numbers from interest rate futures to show the probabilities of the Fed raising, holding, or lowering rates.
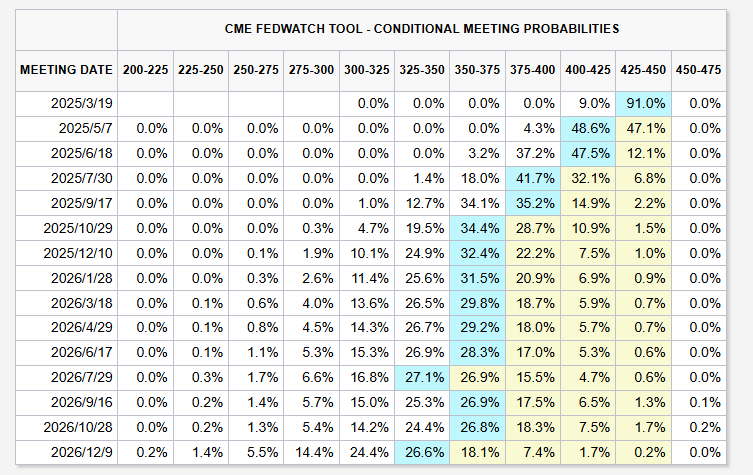
For instance, let's say it's March 2025, and the Fed's next meeting is on March 19th. The tool might show a 91% chance of rates staying at 4.25%-4.5%, with just a 9% chance of a cut to 4%-4.25%.
Source: CME FedWatch. Data as of March 7, 2025.
This is for information and illustrative purposes only.
It also forecasts future meetings, highlighting the most likely rate with a blue box. At that time, the market expected the Fed might drop rates to 4-4.25% in May.
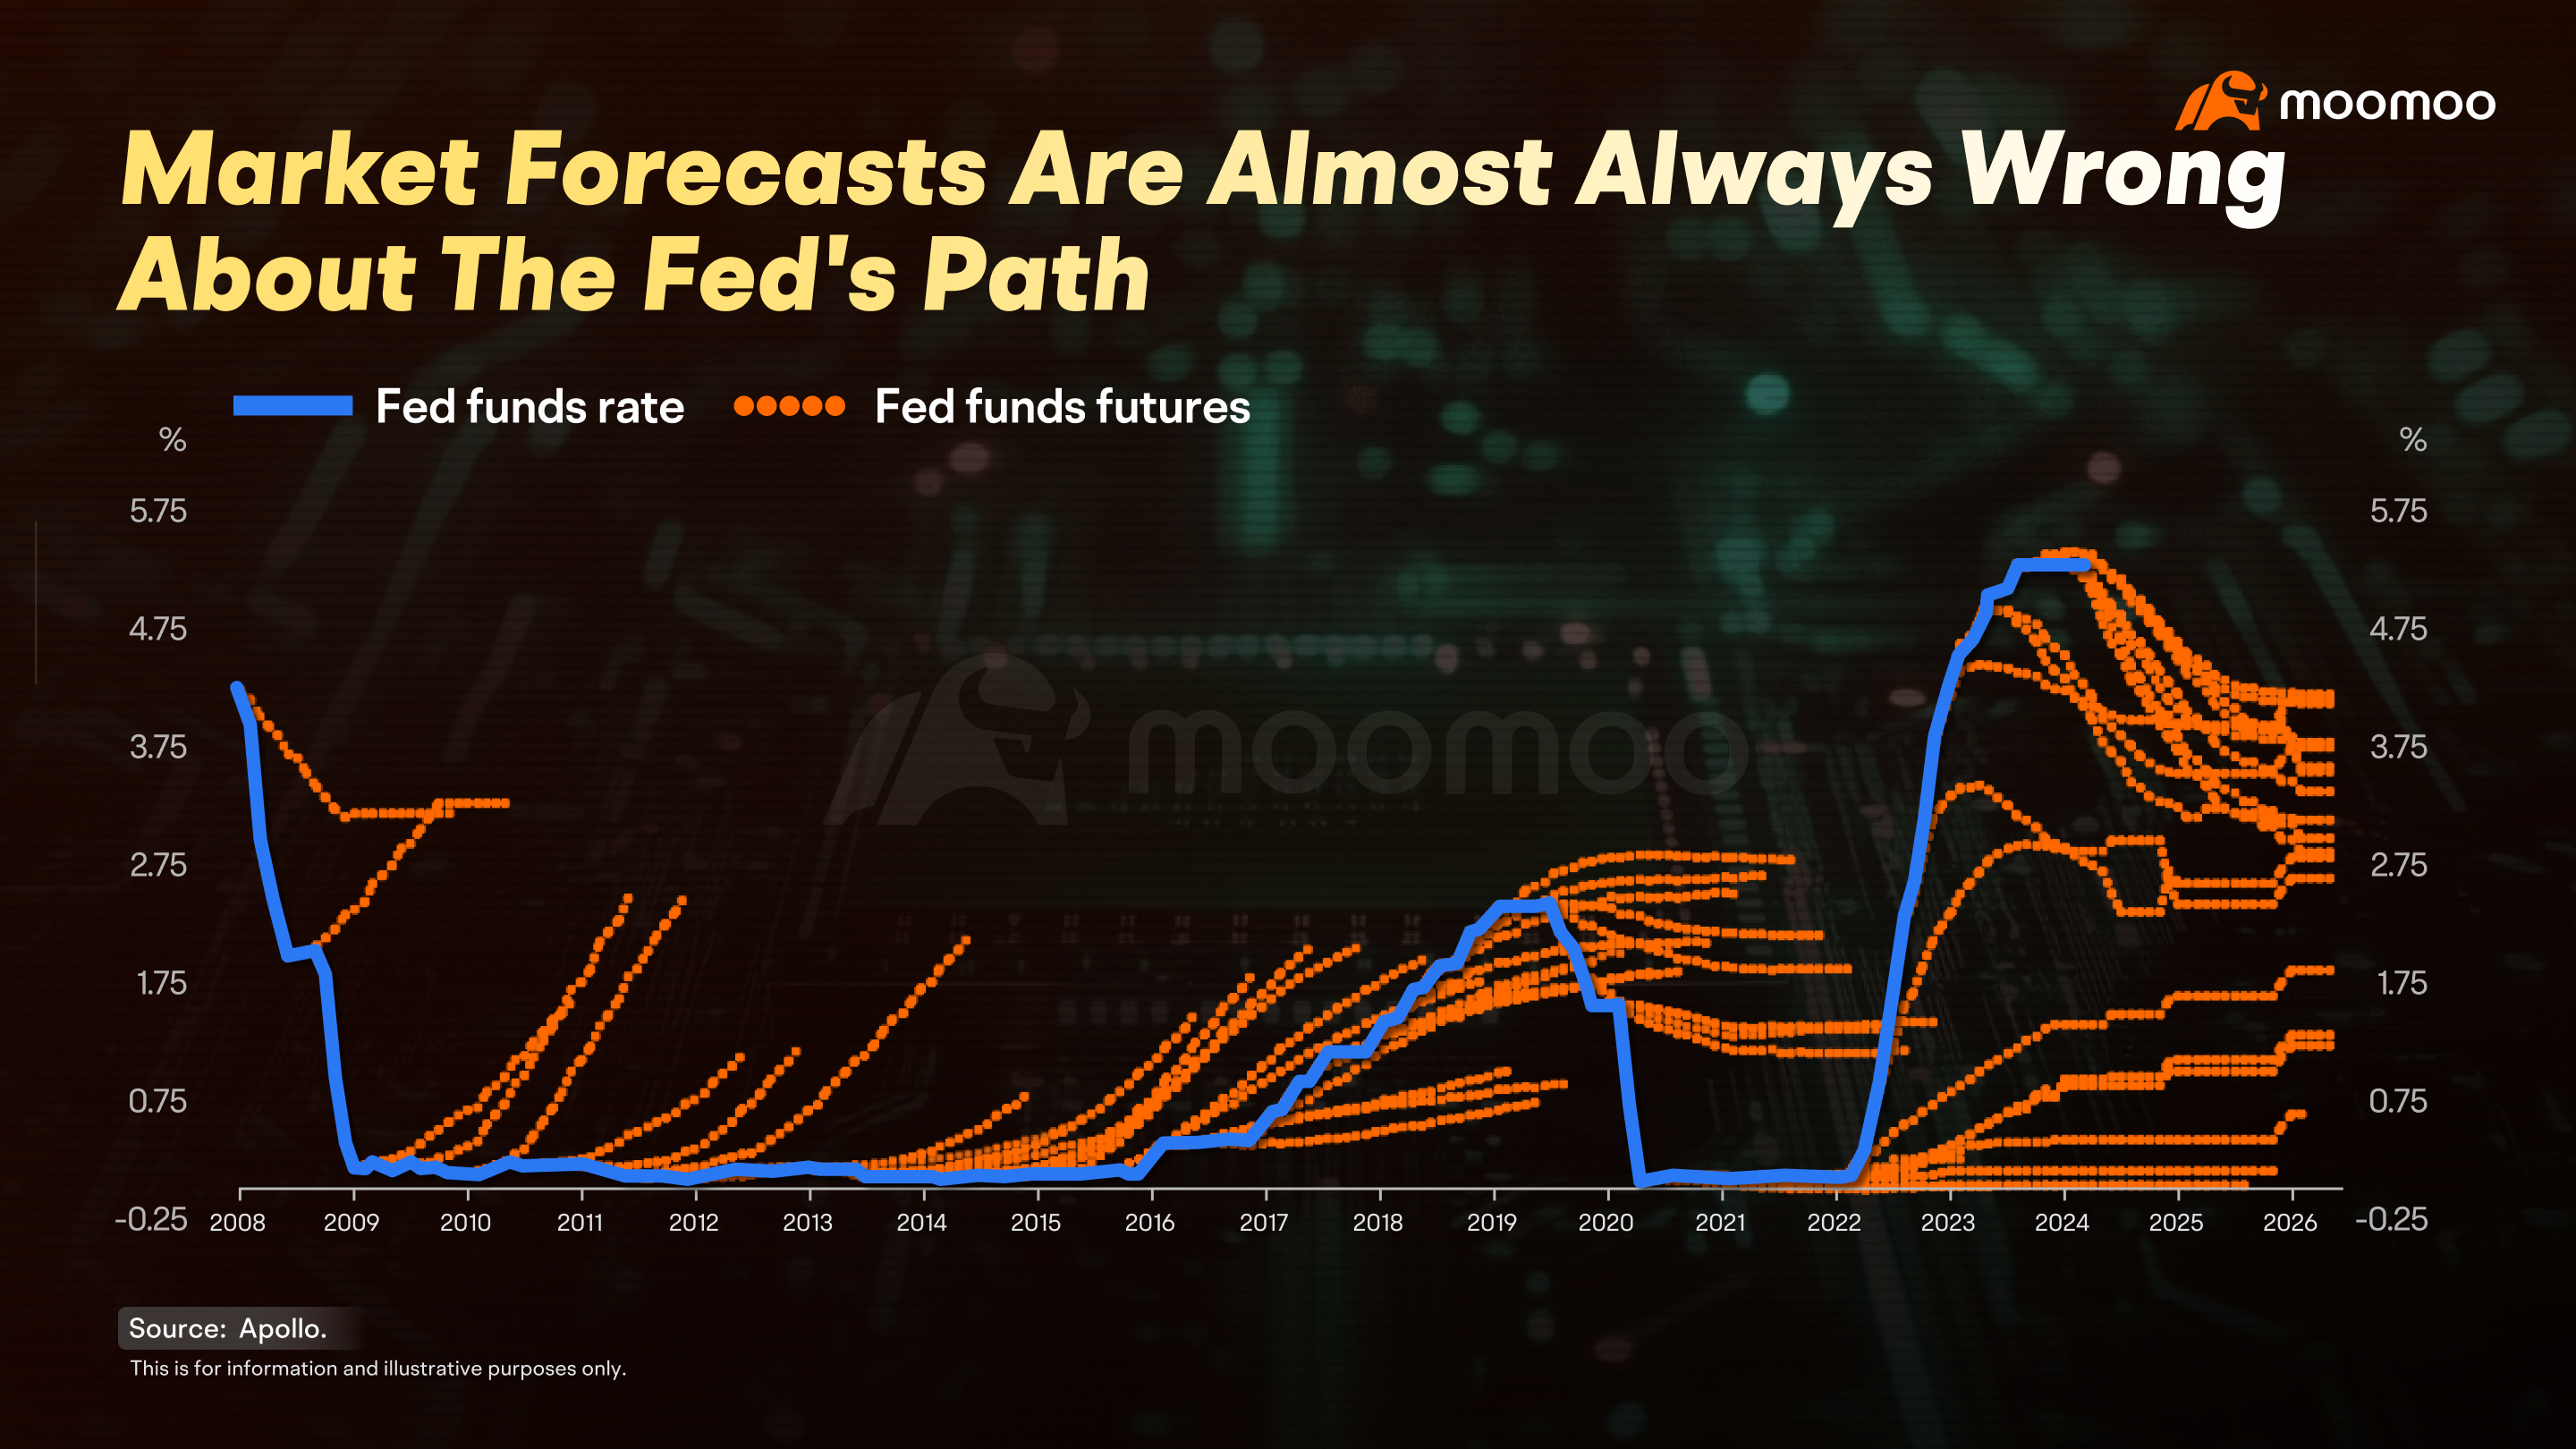
Most of the time, the short-term expectations from the FedWatch Tool align with what the Fed does. But when you stretch the timeline, the market’s predictions don’t often match the Fed’s actions.
After the 2008 financial crisis, the Fed kept rates low for a long time, even though the market kept expecting hikes.
And after the rapid rate increases in 2022, the market anticipated future cuts, but rates stayed high.
That’s because the economy is a super complex system, and the longer the timeline, the more unpredictable events can pop up. Still, the tool offers us a valuable window into potential rate paths.
As the old saying goes, "You can't predict, but you can prepare."
That’s it for today’s session! If you found it helpful, give us a thumbs up, share it with your friends, and drop a comment below. Thanks for joining, and see you next time!
This presentation is for informational and educational use only and is not a recommendation or endorsement of any particular investment or investment strategy. Investment information provided in this content is general in nature, strictly for illustrative purposes, and may not be appropriate for all investors. Read more
Recommend
Why does Warren Buffett say don't piggyback on his trades?

How does nonfarm payroll impact the global market?
Unveiling Inflation: Why is Your Wallet Shrinking?

Mastering the Dollar Cycle: How to invest in a changing economy
Gold vs. Gold Miners: A Comparison
Are U.S. Treasuries still a safe haven?
Meet Dr. Copper: Understanding the Copper Market
Do Oil Price Swings Rock the Stock Market?
How Tariffs Could Impact the Copper Landscape?
Why do oil ETFs lag behind oil prices in the long run?
Why is the US dollar so powerful worldwide, and how can we tell?
A look at employment: what other indicators are there?
GDP: The Barometer of National Prosperity
Understanding Treasury Auctions: A Step-by-Step Guide
Unpacking the U.S. Debt Issue
Why is Oil Called the "Mother of All Commodities"?
How Inflation Affects the Market
How to interpret the Fed dot plot?
How to Decode Inflation: CPI, PCE, and PPI
Understanding Bessent's Fiscal Blueprint
The Rise of the Fed: Can Trump Dismiss Powell?
What's in the Fed's Toolbox?
'Oracle of Omaha' Warren Buffett:ROE>20% is preferable
'Father of value investing' Benjamin Graham: Ten Stock Selection Criteria
Strong Consumer Spending Despite Economic Slowdown: Here's Why
Analyzing the manufacturing industry may help you grasp economic trends
What is the Debt Ceiling? A Deep Dive into US Fiscal Policy
How to Preserve Your Wealth in a High Inflation Environment
How to analyze the Federal Reserve's monetary policy?
Rapidly Rising US Housing Prices: Opportunity or Risk?
How Will the US Dollar Perform in 2024? A Closer Look into the US Dollar Index
Discussing the driving forces behind rises in gold prices
Investing and Labor Market Indicators
Discover the bond market: A quick and easy guide
The Underlying Conflicts Surrounding Crude Oil Prices
Understanding the relationship between the stock market and the bond market
Understanding the US Non-Farm Payroll Data
Understanding the Federal Reserve Interest Rate Decision
Understanding the CCI
Understanding the PPI
Understanding the Retail Sales
Understanding the US Crude Oil Inventories
Understanding the Durable Goods Orders
Listen to the Fed's speakers: Hawks or doves?
Open the Fed's monetary policy toolbox
The Fed Dot Plot explained: What it says about US interest rates
How does monetary policy steer our lives and investment
What the Federal Reserve does?
Understanding the GDP
A brief history lesson on the Fed and U.S. economy
08 Carl Icahn & Icahn Enterprises
09 Seth Klarman & Baupost Group
07 Howard Marks & Oaktree Capital
01 Using 13F filings to learn from big investors
03 How to Read Form 13F
02 Identify a fund's investment strategy
04 Warren Buffett & Berkshire Hathaway
06 Ray Dalio & Bridgewater Associates
05 Bill Ackerman & Pershing Square Capital
Why does Warren Buffett say don't piggyback on his trades?
How does nonfarm payroll impact the global market?
Unveiling Inflation: Why is Your Wallet Shrinking?
Mastering the Dollar Cycle: How to invest in a changing economy
Gold vs. Gold Miners: A Comparison
Are U.S. Treasuries still a safe haven?
Meet Dr. Copper: Understanding the Copper Market
Do Oil Price Swings Rock the Stock Market?
How Tariffs Could Impact the Copper Landscape?
Why do oil ETFs lag behind oil prices in the long run?
Why is the US dollar so powerful worldwide, and how can we tell?
A look at employment: what other indicators are there?
GDP: The Barometer of National Prosperity
Understanding Treasury Auctions: A Step-by-Step Guide
Unpacking the U.S. Debt Issue
Why is Oil Called the "Mother of All Commodities"?
How Inflation Affects the Market
How to interpret the Fed dot plot?
How to Decode Inflation: CPI, PCE, and PPI
Understanding Bessent's Fiscal Blueprint
The Rise of the Fed: Can Trump Dismiss Powell?
What's in the Fed's Toolbox?
'Oracle of Omaha' Warren Buffett:ROE>20% is preferable
'Father of value investing' Benjamin Graham: Ten Stock Selection Criteria
Strong Consumer Spending Despite Economic Slowdown: Here's Why
Analyzing the manufacturing industry may help you grasp economic trends
What is the Debt Ceiling? A Deep Dive into US Fiscal Policy
How to Preserve Your Wealth in a High Inflation Environment
How to analyze the Federal Reserve's monetary policy?
Rapidly Rising US Housing Prices: Opportunity or Risk?
How Will the US Dollar Perform in 2024? A Closer Look into the US Dollar Index
Discussing the driving forces behind rises in gold prices
Investing and Labor Market Indicators
Discover the bond market: A quick and easy guide
The Underlying Conflicts Surrounding Crude Oil Prices
Understanding the relationship between the stock market and the bond market
Understanding the US Non-Farm Payroll Data
Understanding the Federal Reserve Interest Rate Decision
Understanding the CCI
Understanding the PPI
Understanding the Retail Sales
Understanding the US Crude Oil Inventories
Understanding the Durable Goods Orders
Listen to the Fed's speakers: Hawks or doves?
Open the Fed's monetary policy toolbox
The Fed Dot Plot explained: What it says about US interest rates
How does monetary policy steer our lives and investment
What the Federal Reserve does?
Understanding the GDP
A brief history lesson on the Fed and U.S. economy
08 Carl Icahn & Icahn Enterprises
09 Seth Klarman & Baupost Group
07 Howard Marks & Oaktree Capital
01 Using 13F filings to learn from big investors
03 How to Read Form 13F
02 Identify a fund's investment strategy
04 Warren Buffett & Berkshire Hathaway
06 Ray Dalio & Bridgewater Associates
05 Bill Ackerman & Pershing Square Capital

