



Moomoo Insights
Jul 16 15:38
TSMC Earnings: AI Demand Is Stronger Than the Chip Selloff Suggests
Moomoo Insights
Sep 30 05:04
Live Take | Anthropic’s $518B Compute Bet: Who Wins From the AI Buildout?
This article contains 3000 words and takes about 9 minutes to read.

Crude oil, referred to as the "mother of all commodities" and the "lifeblood of all industrialized countries," is a crucial resource for economic development worldwide. Despite attempts to reduce petroleum usage and search for alternative green energy sources, crude oil remains a vital commodity with immense significance.
The correlation between rising oil prices and inflation may raise questions for some. This article delves into the framework of crude oil analysis.
1. Why analyzing crude oil may be important?
2. What factors can impact crude oil prices?
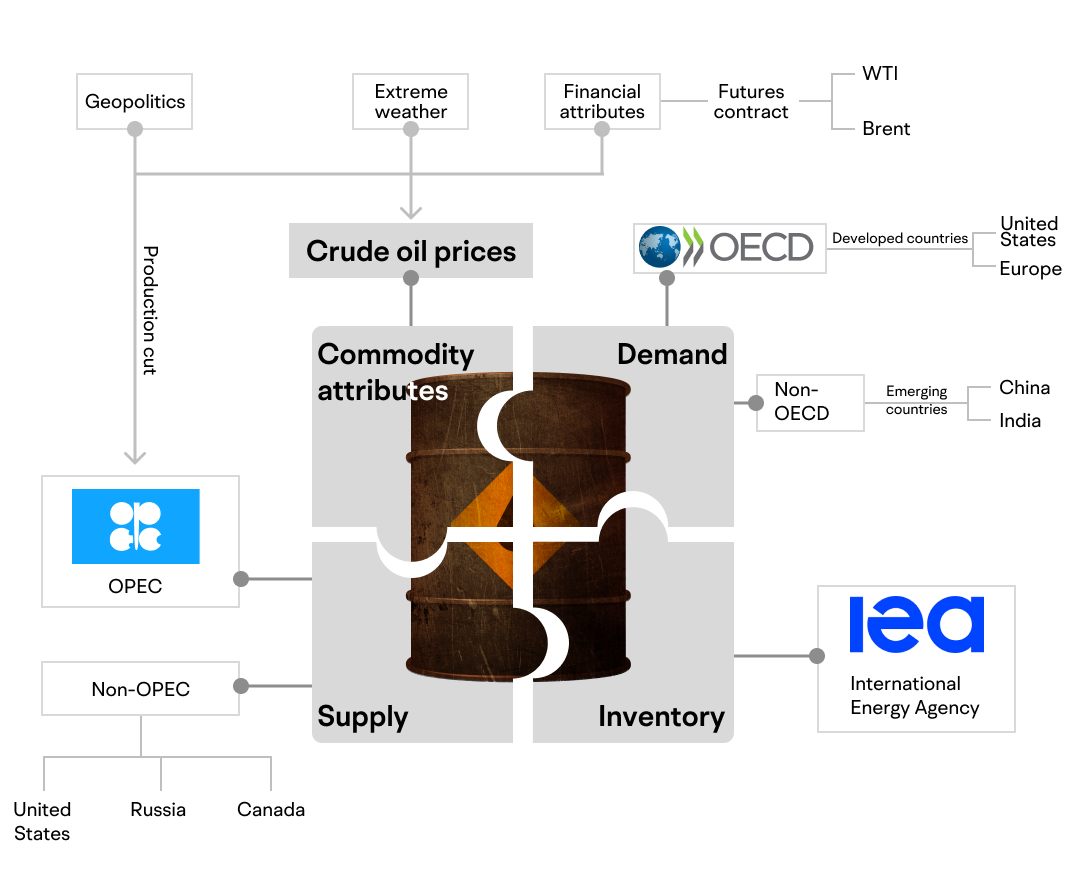
○Commodity attributes impact on oil supply
○Geopolitics and unexpected events can impact oil supply
○Financial attributes impact on financial assets
○Extreme Weather Impacts the Oil Industry
Crude oil is closely related to economic indicators due to its presence in various parts of the real economy.
While crude oil can drive economic development in countries, price fluctuations may affect economic stability and monetary policies.
For instance, energy accounts for a 7% weight in the consumer price index (CPI) as of 2023. Although not a significant percentage, the high volatility can influence monthly data changes. Similarly, gasoline consumption plays a critical role in driving changes in new retail sales.
A sharp increase in oil prices may indicate forthcoming upward trends in both inflation and consumer data. Unexpected spikes in inflation may result in central banks raising interest rates.
In the latter part of this article, we will explore how crude oil's commodity, political, and financial attributes impact its price.
Crude oil is a fossil fuel that can be refined into various products, including gasoline, diesel, liquefied petroleum gas, among others.
Understanding which countries produce crude oil is crucial when analyzing the commodity.
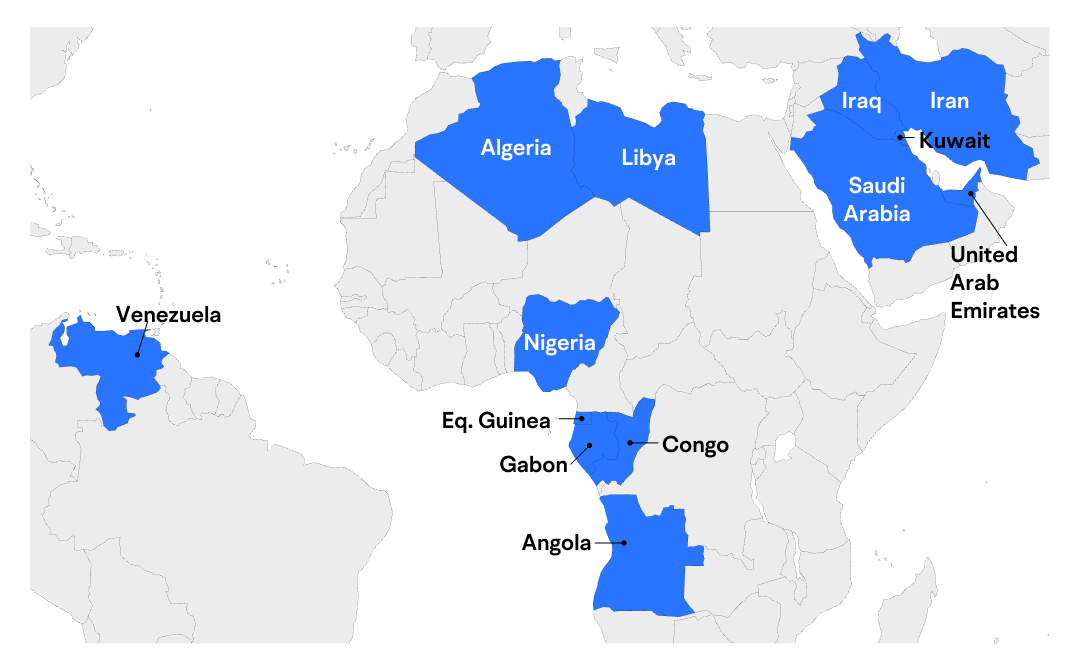
As a non-renewable resource, countries with abundant reserves have pricing power over crude oil. Therefore, in 1960, the world's largest oil and natural gas reserve countries established an organization known as the Organization of the Petroleum Exporting Countries (OPEC).
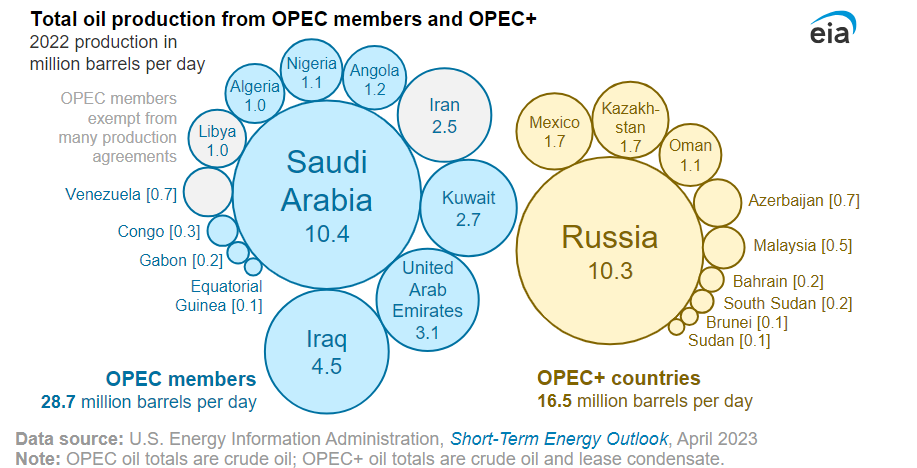
OPEC's mission is to coordinate and unify the petroleum policies of its member countries to maintain market stability. This implies that OPEC has the power to dominate global crude oil supply and determine oil prices. As of 2023, the organization has 13 member countries, accounting for approximately 40% of global oil production and 60% of the global oil market.
To ensure sustainable development, OPEC maintains a fixed amount of idle capacity. In reality, OPEC's annual production only represents a small fraction of these countries' reserves. In order to keep crude oil prices high and maintain a stable income, OPEC may proactively reduce its production from time to time.
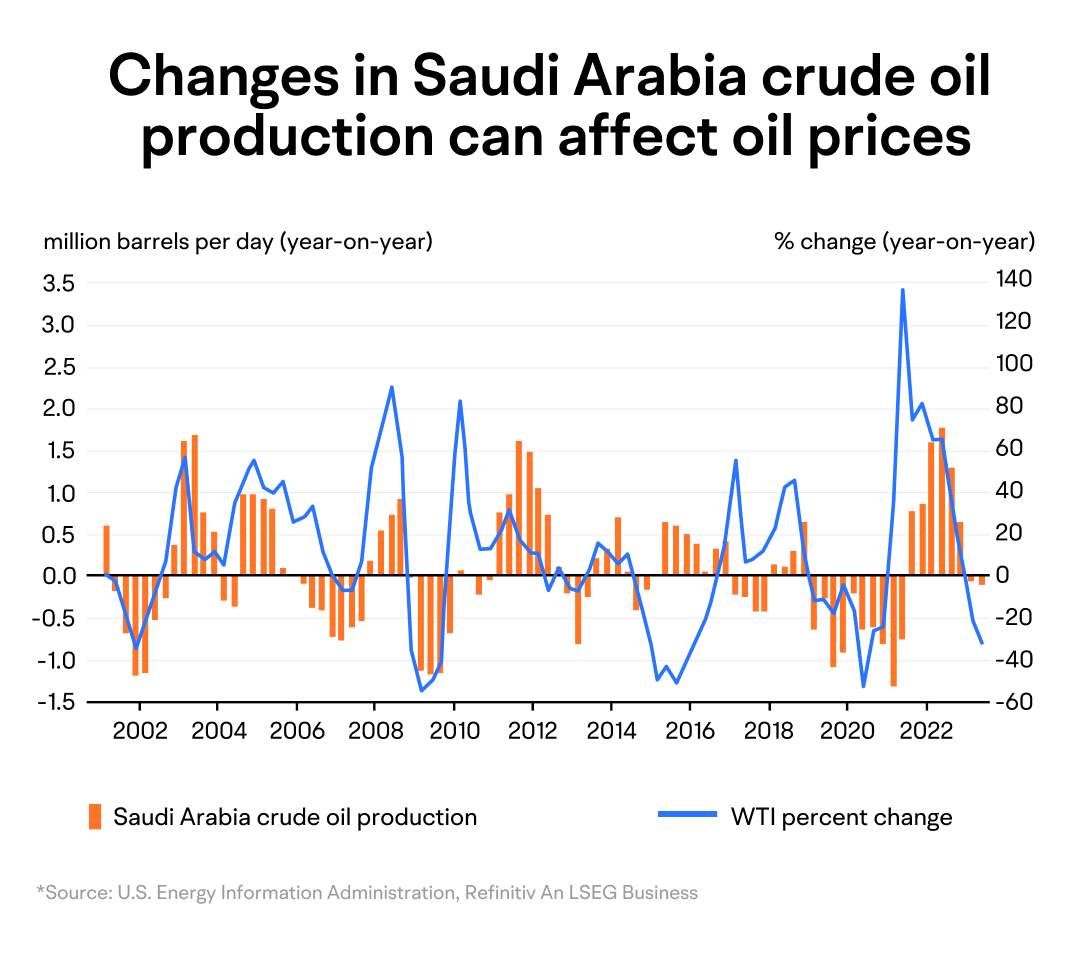
Saudi Arabia is currently the largest producer and exporter among OPEC countries. In 2021, Saudi Arabia represented 34% of OPEC's crude oil production, more than twice that of Iraq, the second-largest producer in the organization. This explains why we frequently hear news reports of Saudi Arabia representing OPEC in decision-making.
Oil production capacity and pricing are often highly contested issues as oil is a vital commodity for economic growth.
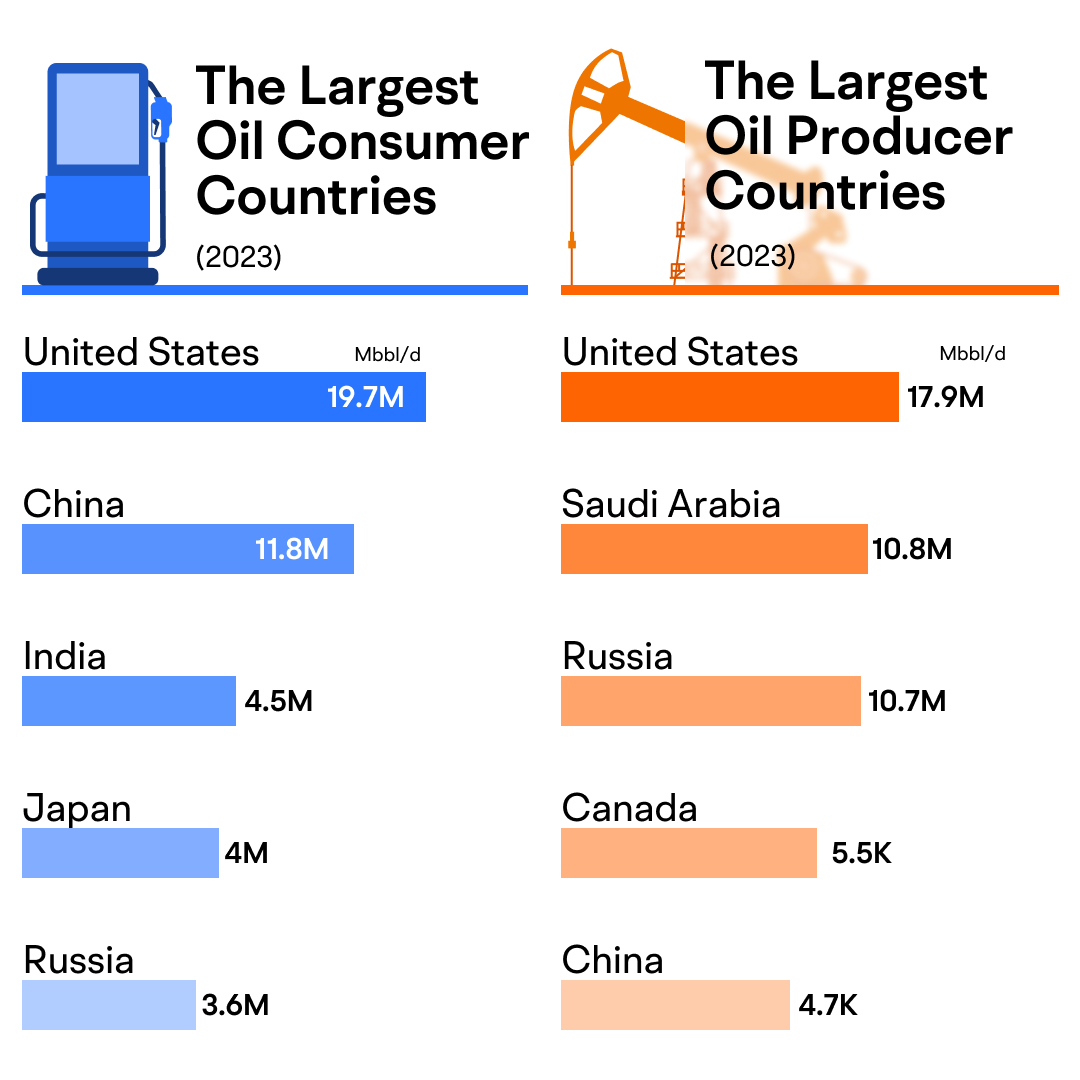
Non-OPEC countries are developing technologies to break the global crude oil supply pattern and compete for dominance in oil production. In 2022, the top five oil producers were the United States, Saudi Arabia, Russia, Canada and China, all countries except for Saudi Arabia are non-OPEC countries.
The US has the world's largest shale oil reserves, increasing production efficiency and reducing reliance on foreign oil imports.
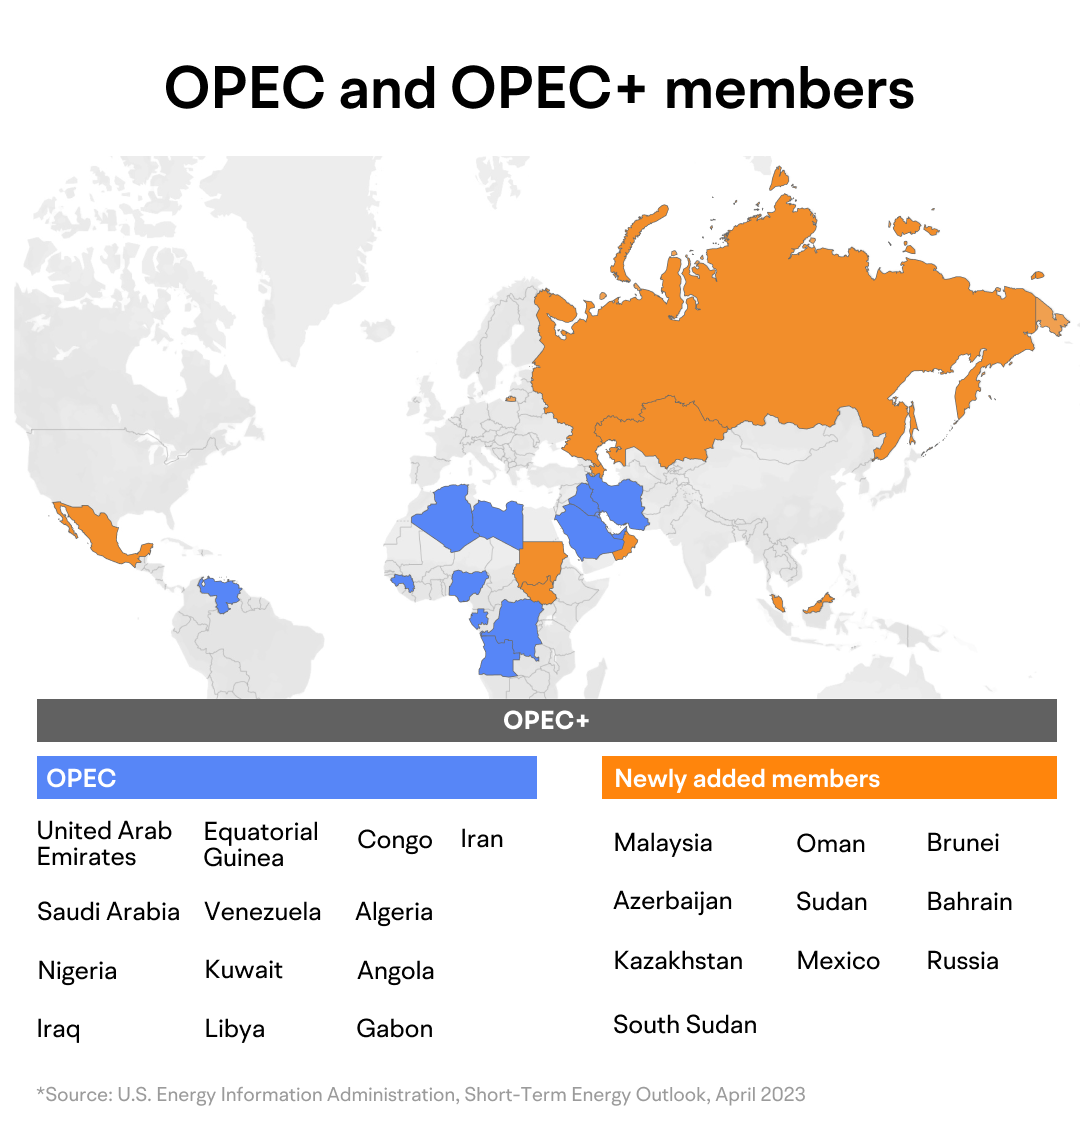
The introduction of shale oil disrupted the previously OPEC-dominated pricing and suppressed international oil prices for an extended period, leading to the establishment of OPEC+ through an agreement between OPEC and ten other oil-producing nations.
OPEC+ was established in 2016 and expanded beyond OPEC's membership, including countries such as Russia, Azerbaijan, and Kazakhstan.
In summary, both OPEC and OPEC+ aim to maintain stability in the international oil market. However, with the inclusion of these countries, OPEC+ has a higher oil supply and proven reserves, OPEC+ has become the driving force behind many of the developments in the global oil markets over recent years.
Now let's take a look at the demand side of crude oil. Crude oil is a crucial fuel source for global industries and vehicles, and as "a nation on wheels", the US is both the largest producer and consumer of crude oil. In the 21st century, emerging economies such as China have experienced rapid growth, leading to an increased demand for crude oil due to their infrastructure development and industrial expansion needs.
The gross domestic product (GDP), which measures economic growth, is highly related to global crude oil consumption. Moreover, major consumer countries such as the United States and China account for over half of the world's total consumption, and their GDP is often highly correlated with crude oil consumption trends.
The oil crisis in 1973 caused a massive disruption in the global supply of oil. To address the unpredictability of oil supply and demand, the Organisation for Economic Co-operation and Development (OECD) established the International Energy Agency (IEA) in 1974.
The mission of the IEA is to maintain substantial petroleum reserves to address unexpected disruptions in the oil supply. The IEA has 31 member countries, and its inventory is primarily located in the United States, Europe, Japan, and South Korea.
Note: The OECD was founded on December 14, 1960, by 18 European countries, the United States and Canada. The organization now has 38 member countries responsible for discussing and developing economic and social policies. It regularly publishes economic reports, statistical databases, analyses, and forecasts regarding global economic growth prospects.
The US Energy Information Administration (EIA) has significantly different responsibilities compared to the international government organization IEA. The EIA collects, analyzes, and publishes US energy information weekly. Its reports provide information on weekly petroleum supply, crude oil, and refined product inventory levels, reflecting the current supply-demand situation of crude oil. Therefore, EIA data can impact oil prices, commodity futures markets, and even the US dollar index.
In addition to the EIA, the American Petroleum Institute (API) also regularly releases data on US crude oil inventory and refining operations.
Crude oil, like most commodities, is affected by supply and demand. When there is more supply than demand at a given level, the market price decreases. Conversely, when there is limited supply and high demand, crude oil prices can surge.
Until now, the global oil market has been a seller's market. As a well-known cartel, OPEC+ member countries have a strong incentive to keep oil prices as high as possible. Despite having the world's highest oil reserves, OPEC+ often controls global crude oil supplies through production cuts or supply restrictions for their interests.
Note: A cartel, also known as a monopolistic interest group, is an independent enterprise or organization that controls supply or manipulates prices.
OPEC+'s statements can temporarily affect oil prices by changing expectations. For example, in the latter half of 2022, oil prices dropped from $120 within three months to around $90 due to concerns about a global economic downturn. OPEC+ declared production cuts in October 2022 to elevate oil prices, and soon after, benchmark Brent crude oil prices surged past $93 per barrel.
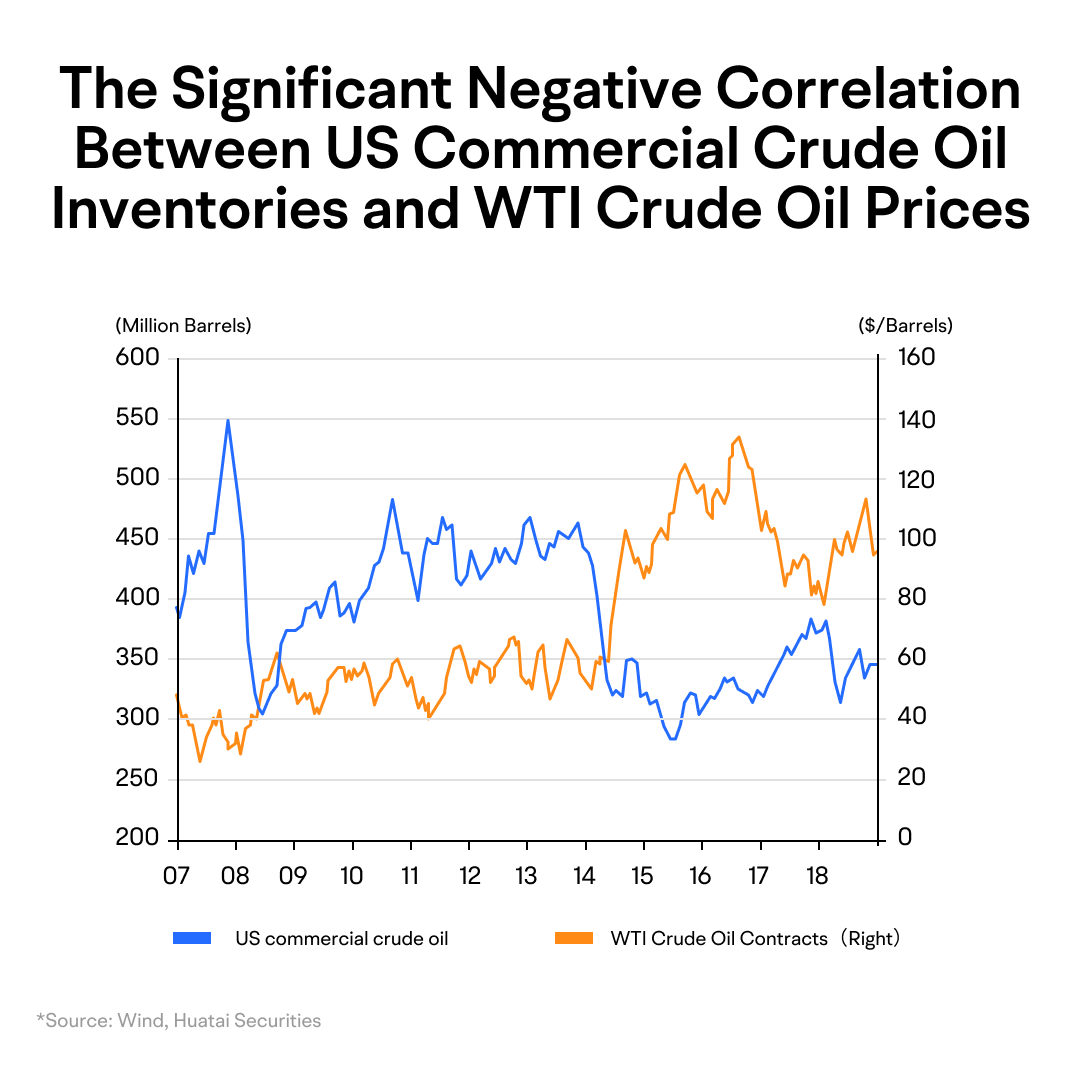
Similarly, crude oil inventories can provide insight into the supply-demand relationship in the market. When petroleum inventories increase, it can be seen as a signal that the market supply is sufficient or demand has decreased, putting pressure on oil prices to fall. Conversely, a decrease in inventory may indicate increased demand, and prices may rise sharply.
For example, US commercial crude oil inventories have had a significant negative correlation with West Texas Intermediate (WTI) crude oil prices.
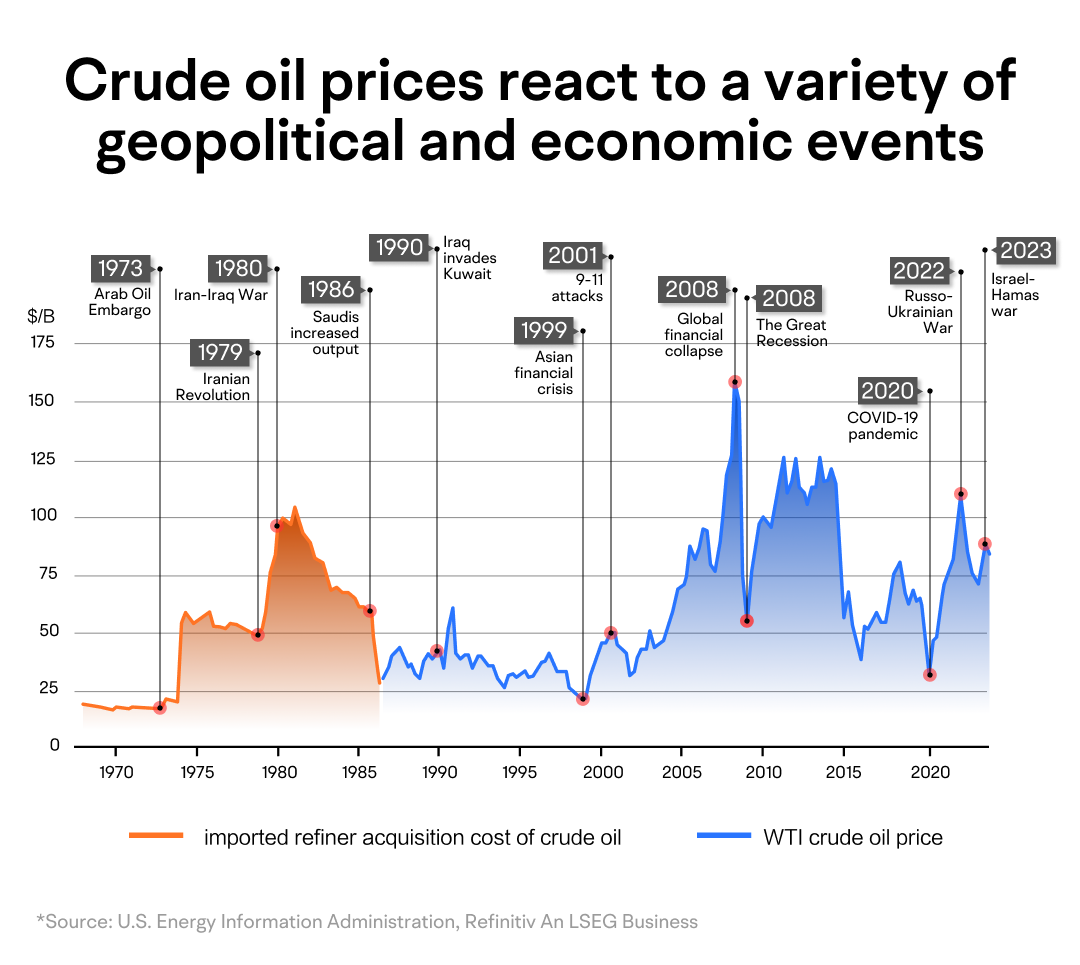
Crude oil is the most closely linked to geopolitics and international relations commodity compared to other commodities. In the case of geopolitical conflicts between major oil-producing countries and consumers, it can lead to a decrease in supply, causing oil prices to soar. Similarly, any indication of improved relations, particularly in oil-producing regions, may cause oil prices to decrease as geopolitical tensions can drive them up by making it difficult for oil production and exports.
Two large-scale global oil crises occurred due to oil embargoes leading to supply disruptions. During these periods, world oil market prices skyrocketed, significantly impacting countries that rely on oil and causing their economies to slow down noticeably.
Crude oil is a speculative asset that individual investors can trade by buying spot or futures contracts. The oil market participants closely monitor two main oil contracts: West Texas Intermediate (WTI) and Brent crude oil.
The differences between WTI and Brent crude oil are:
● WTI crude oil futures pricing mainly takes place in the US, while Brent crude oil futures pricing mainly takes place in Europe. Asia-Pacific regions such as China and India primarily price based on Dubai crude oil.
● Due to the developed financial markets in the US, WTI crude oil has better liquidity and transparency, making it the leader in global commodity futures trading volumes. On the other hand, Brent crude oil has broader coverage as it can be transported by sea to various parts of the world. Currently, over three-quarters of global crude oil transactions use Brent crude oil as a benchmark price.
From a correlation perspective, crude oil is closely linked to various financial assets, and we will analyze these connections:
1. Other commodities
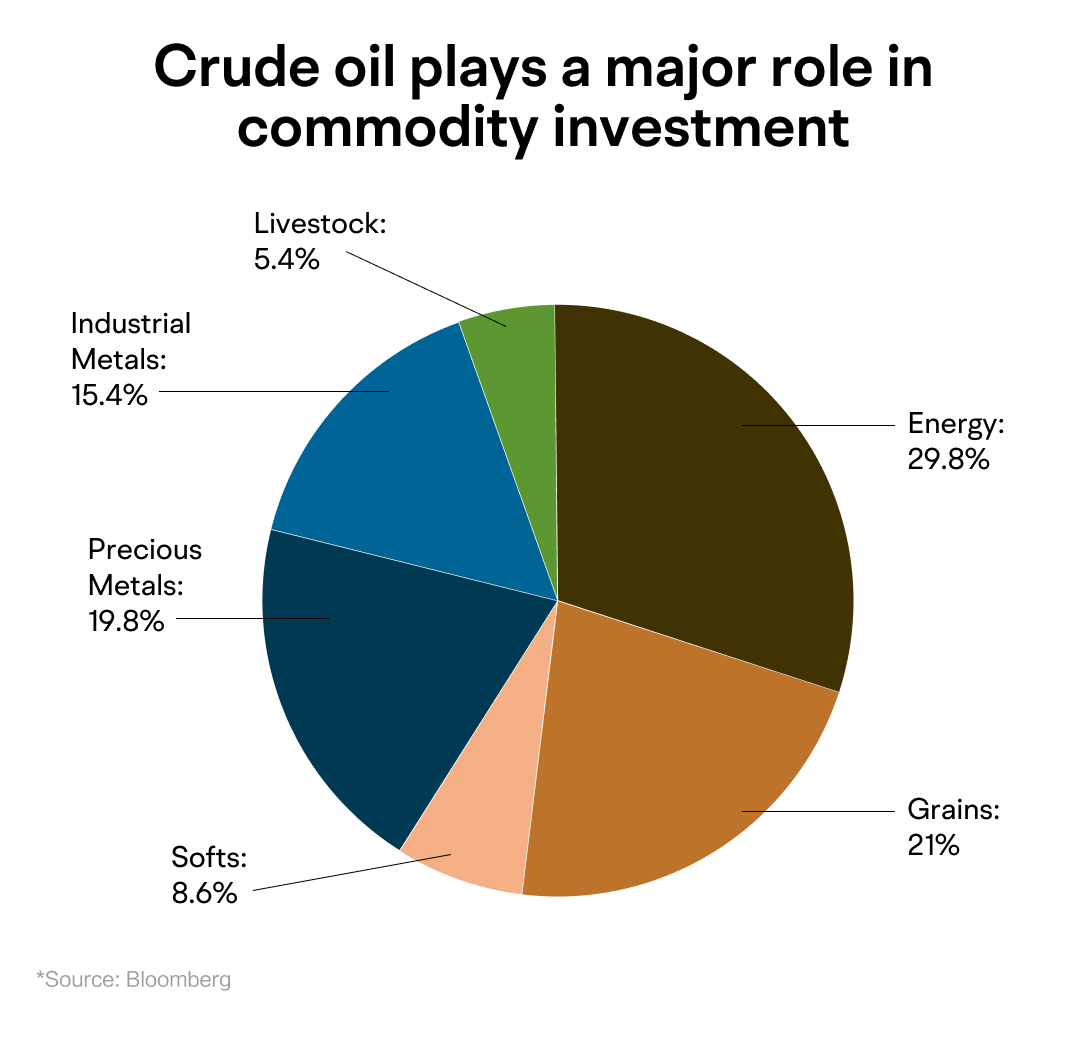
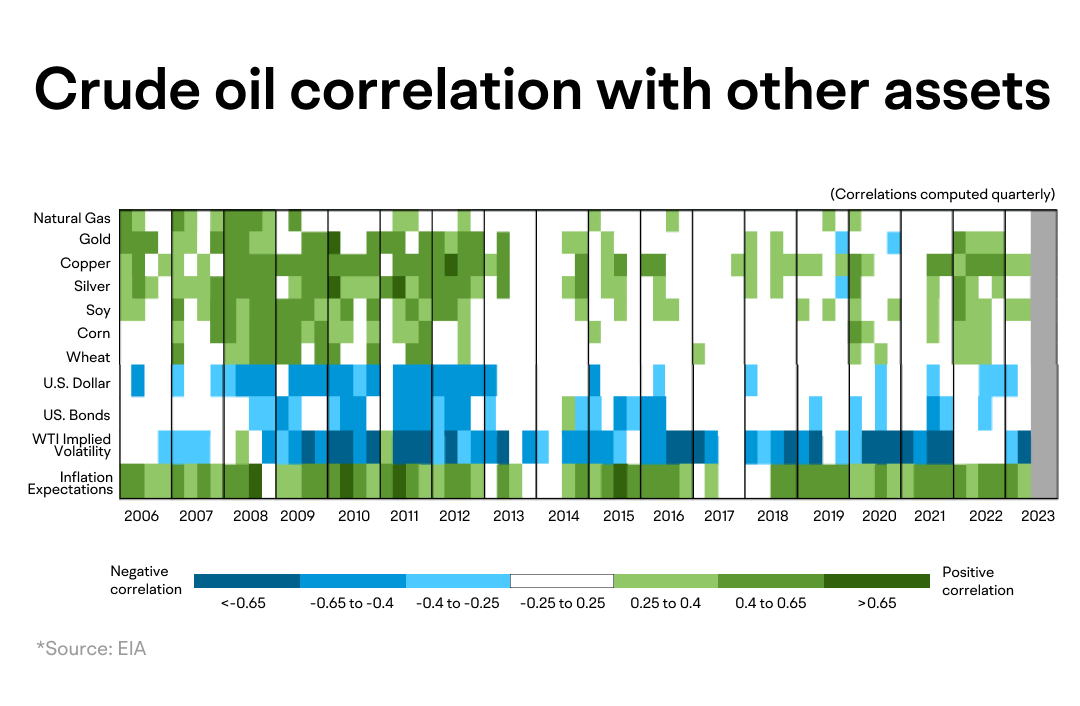
Crude oil prices have a positive correlation with other commodity prices. When crude oil futures prices rise, other commodity prices tend to rise as well. Commodity investment considers crude oil as significant due to its highest proportion in the asset management scale of commodity indexes.
2. US Dollar Index
As crude oil is priced in US dollars, the WTI crude oil prices usually have a significant negative correlation with the trend of the US dollar. The "petrodollar system" means that countries buying and producing crude oil trade through the US dollar. If the US adopts an expansionary monetary policy, causing the US dollar to depreciate, but crude oil's value remains the same, it would require more US dollars to purchase a barrel of oil, thereby pushing up crude oil prices. However, in recent years, the correlation between crude oil and the US dollar has been weakening due to various factors affecting oil prices.
3. Stock Market
Overall, there is a weak correlation between oil prices and the stock market. Thus, it is difficult for analysts to predict how oil prices will affect the stock market. However, the transportation and oil sector of the stock market is closely related to spot crude oil prices as fuel is the primary input cost for transportation companies. When oil prices are high, some investors may explore the possibility of taking bearish positions in transportation companies.
4. US Treasury Bonds
Similarly, WTI crude oil prices usually have a significant negative correlation with US Treasury bonds. For example, if oil prices rise rapidly in September 2023, it could have a sustained impact on US inflation, which could force the Fed to raise interest rates again. This concern could cause the yield on US Treasury bonds to increase. Rates and prices are inversely related, so we can see that the prices of ten-year Treasury main contracts exhibit a volatile downward trend.
5. Market Expectations
Crude oil and inflation expectations have a significant positive correlation. Therefore, it is important to understand the trend of crude oil when analyzing the decisions of the Fed. If crude oil prices go up, inflation expectations may also rise. If this happens during a rate-hike cycle, the Fed may increase the probability of raising interest rates.
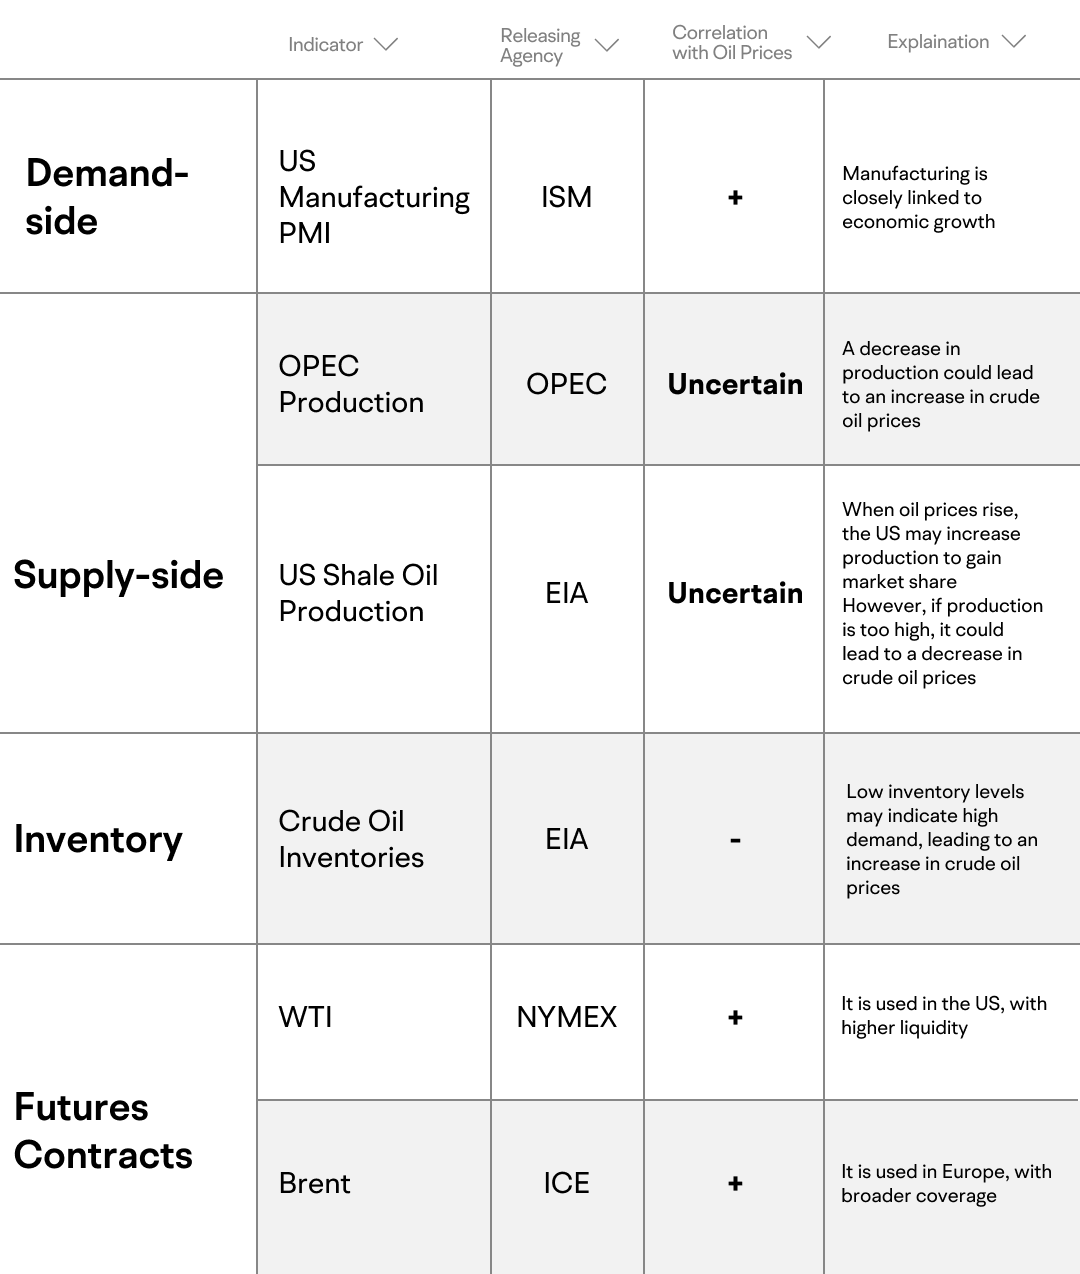
Crude oil's characteristic of having "inelastic demand and elastic supply" makes it challenging to forecast its price. However, investors can observe crude oil prices by combining related indicators such as: commodity, political, financial, and weather conditions. Here are some relatively important indicators for reference:
Crude oil is also affected by unexpected events such as extreme weather and natural disasters. Here are three examples:
● Hurricanes and storms can cause severe damage to offshore drilling platforms, refineries, and pipelines, leading to price increases.
● Heat waves and droughts can also affect the oil industry. For instance, prolonged hot weather may reduce hydropower generation, leading to power outages. This could impact the refining and transportation of oil, resulting in a decrease in supply and an increase in prices.
● Winter storms can impact the oil industry in various ways. As temperatures drop, there is an increase in demand for heating oil and natural gas, leading to increased demand.
Investors can prepare in advance for potential disruptions caused by extreme weather by monitoring weather patterns.
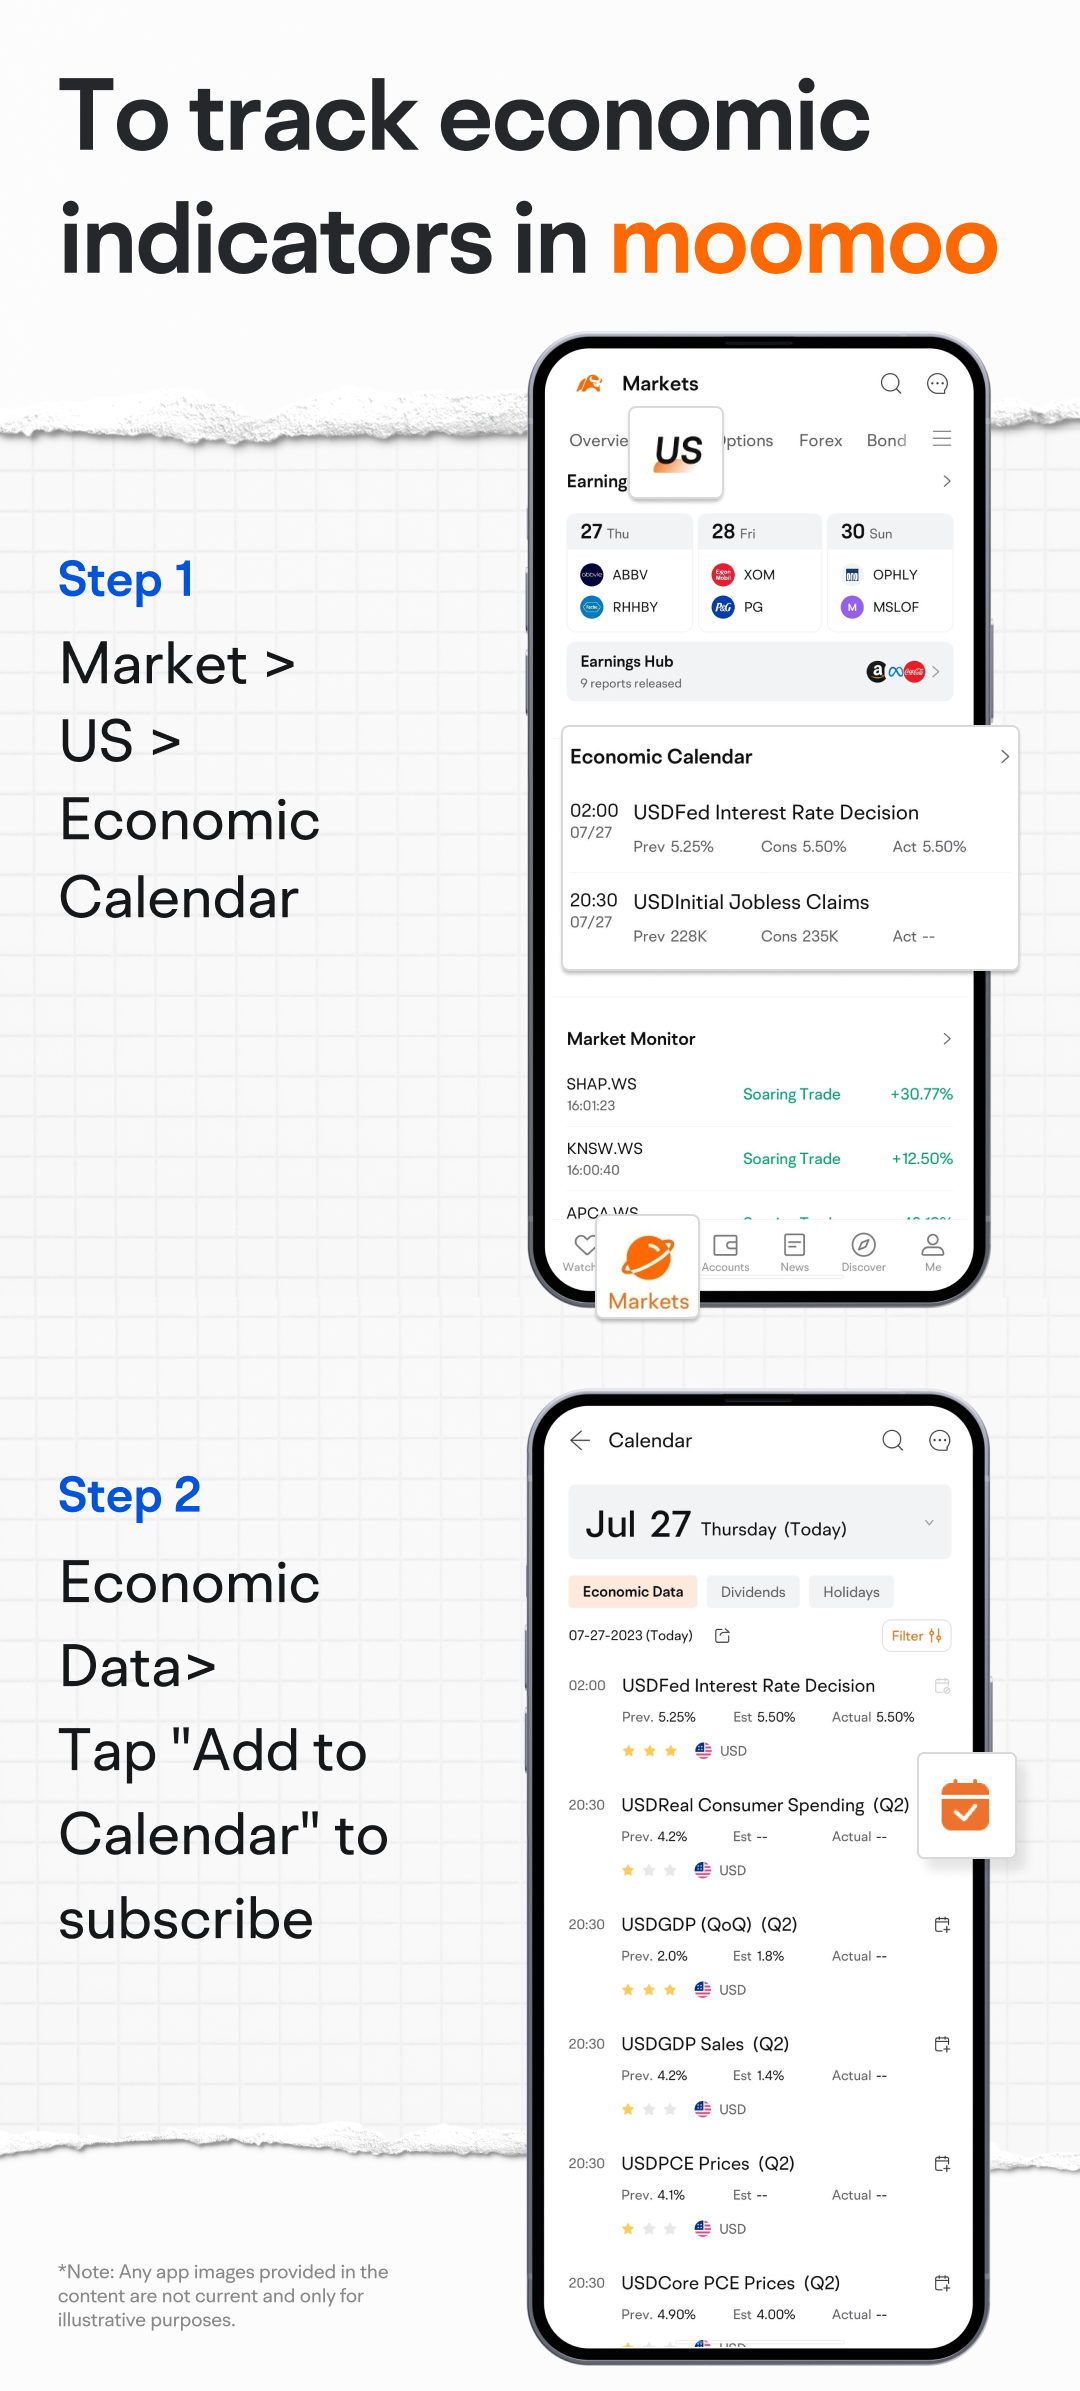
Check out the macro analysis in the "Advanced" section to learn more about Cruel Oil. Update yourself with the latest data and market trends to make more informed investment decisions!
This presentation is for informational and educational use only and is not a recommendation or endorsement of any particular investment or investment strategy. Investment information provided in this content is general in nature, strictly for illustrative purposes, and may not be appropriate for all investors. Read more
Recommend
Why does Warren Buffett say don't piggyback on his trades?

How does nonfarm payroll impact the global market?
Unveiling Inflation: Why is Your Wallet Shrinking?

Mastering the Dollar Cycle: How to invest in a changing economy
Gold vs. Gold Miners: A Comparison
Are U.S. Treasuries still a safe haven?
Meet Dr. Copper: Understanding the Copper Market
Do Oil Price Swings Rock the Stock Market?
How Tariffs Could Impact the Copper Landscape?
Why do oil ETFs lag behind oil prices in the long run?
Why is the US dollar so powerful worldwide, and how can we tell?
A look at employment: what other indicators are there?
GDP: The Barometer of National Prosperity
Understanding Treasury Auctions: A Step-by-Step Guide
Unpacking the U.S. Debt Issue
Why is Oil Called the "Mother of All Commodities"?
How Inflation Affects the Market
How to interpret the Fed dot plot?
How to Decode Inflation: CPI, PCE, and PPI
Understanding Bessent's Fiscal Blueprint
The Rise of the Fed: Can Trump Dismiss Powell?
What's in the Fed's Toolbox?
'Oracle of Omaha' Warren Buffett:ROE>20% is preferable
'Father of value investing' Benjamin Graham: Ten Stock Selection Criteria
Strong Consumer Spending Despite Economic Slowdown: Here's Why
Analyzing the manufacturing industry may help you grasp economic trends
What is the Debt Ceiling? A Deep Dive into US Fiscal Policy
How to Preserve Your Wealth in a High Inflation Environment
How to analyze the Federal Reserve's monetary policy?
Rapidly Rising US Housing Prices: Opportunity or Risk?
How Will the US Dollar Perform in 2024? A Closer Look into the US Dollar Index
Discussing the driving forces behind rises in gold prices
Investing and Labor Market Indicators
Discover the bond market: A quick and easy guide
The Underlying Conflicts Surrounding Crude Oil Prices
Understanding the relationship between the stock market and the bond market
Understanding the US Non-Farm Payroll Data
Understanding the Federal Reserve Interest Rate Decision
Understanding the CCI
Understanding the PPI
Understanding the Retail Sales
Understanding the US Crude Oil Inventories
Understanding the Durable Goods Orders
Listen to the Fed's speakers: Hawks or doves?
Open the Fed's monetary policy toolbox
The Fed Dot Plot explained: What it says about US interest rates
How does monetary policy steer our lives and investment
What the Federal Reserve does?
Understanding the GDP
A brief history lesson on the Fed and U.S. economy
08 Carl Icahn & Icahn Enterprises
09 Seth Klarman & Baupost Group
07 Howard Marks & Oaktree Capital
01 Using 13F filings to learn from big investors
03 How to Read Form 13F
02 Identify a fund's investment strategy
04 Warren Buffett & Berkshire Hathaway
06 Ray Dalio & Bridgewater Associates
05 Bill Ackerman & Pershing Square Capital
Why does Warren Buffett say don't piggyback on his trades?
How does nonfarm payroll impact the global market?
Unveiling Inflation: Why is Your Wallet Shrinking?
Mastering the Dollar Cycle: How to invest in a changing economy
Gold vs. Gold Miners: A Comparison
Are U.S. Treasuries still a safe haven?
Meet Dr. Copper: Understanding the Copper Market
Do Oil Price Swings Rock the Stock Market?
How Tariffs Could Impact the Copper Landscape?
Why do oil ETFs lag behind oil prices in the long run?
Why is the US dollar so powerful worldwide, and how can we tell?
A look at employment: what other indicators are there?
GDP: The Barometer of National Prosperity
Understanding Treasury Auctions: A Step-by-Step Guide
Unpacking the U.S. Debt Issue
Why is Oil Called the "Mother of All Commodities"?
How Inflation Affects the Market
How to interpret the Fed dot plot?
How to Decode Inflation: CPI, PCE, and PPI
Understanding Bessent's Fiscal Blueprint
The Rise of the Fed: Can Trump Dismiss Powell?
What's in the Fed's Toolbox?
'Oracle of Omaha' Warren Buffett:ROE>20% is preferable
'Father of value investing' Benjamin Graham: Ten Stock Selection Criteria
Strong Consumer Spending Despite Economic Slowdown: Here's Why
Analyzing the manufacturing industry may help you grasp economic trends
What is the Debt Ceiling? A Deep Dive into US Fiscal Policy
How to Preserve Your Wealth in a High Inflation Environment
How to analyze the Federal Reserve's monetary policy?
Rapidly Rising US Housing Prices: Opportunity or Risk?
How Will the US Dollar Perform in 2024? A Closer Look into the US Dollar Index
Discussing the driving forces behind rises in gold prices
Investing and Labor Market Indicators
Discover the bond market: A quick and easy guide
The Underlying Conflicts Surrounding Crude Oil Prices
Understanding the relationship between the stock market and the bond market
Understanding the US Non-Farm Payroll Data
Understanding the Federal Reserve Interest Rate Decision
Understanding the CCI
Understanding the PPI
Understanding the Retail Sales
Understanding the US Crude Oil Inventories
Understanding the Durable Goods Orders
Listen to the Fed's speakers: Hawks or doves?
Open the Fed's monetary policy toolbox
The Fed Dot Plot explained: What it says about US interest rates
How does monetary policy steer our lives and investment
What the Federal Reserve does?
Understanding the GDP
A brief history lesson on the Fed and U.S. economy
08 Carl Icahn & Icahn Enterprises
09 Seth Klarman & Baupost Group
07 Howard Marks & Oaktree Capital
01 Using 13F filings to learn from big investors
03 How to Read Form 13F
02 Identify a fund's investment strategy
04 Warren Buffett & Berkshire Hathaway
06 Ray Dalio & Bridgewater Associates
05 Bill Ackerman & Pershing Square Capital

