Nike stock hits a four-year low: does the market overreact? (07/03/2024)
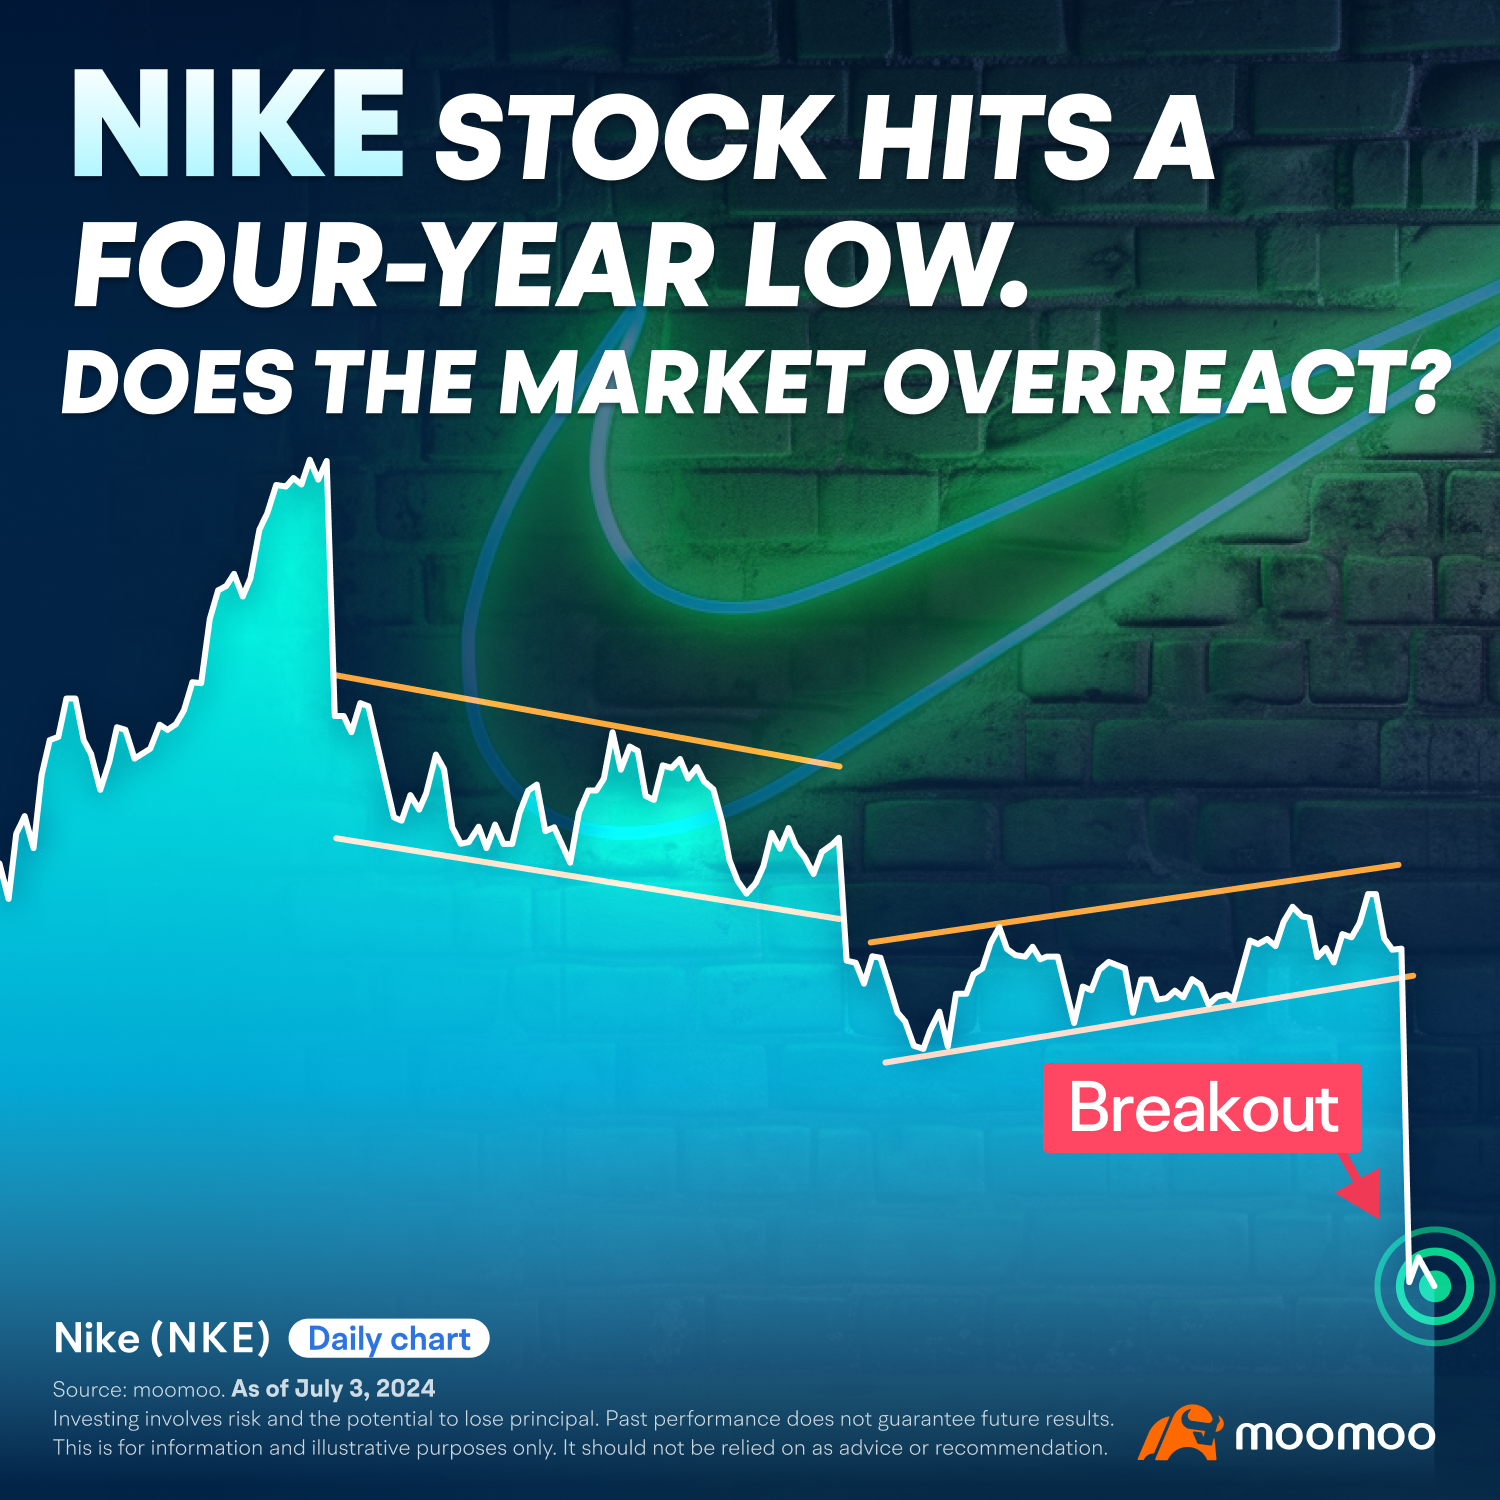
Hello, everyone! This week, we will be shifting our focus towards NIKE, Inc. ($Nike(NKE.US)$), the world’s largest sportswear company. In this article, we’ll explore the latest trends and take a close look at the company’s recent market activity.
What’s new?
On June 28, 2024, Nike’s shares plummeted 20% to a four-year low after the company posted its latest earnings report, revealing sluggish growth as the world’s largest sportswear brand faces rising competition, consumer pullback in its key markets, and strategy missteps.
For the fourth fiscal quarter of 2024, Nike’s revenue declined 1.71% YoY to $12.61 billion, falling below Wall Street's expectations of $12.86 billion. This decline reflected the company’s ongoing deceleration in recent quarters.
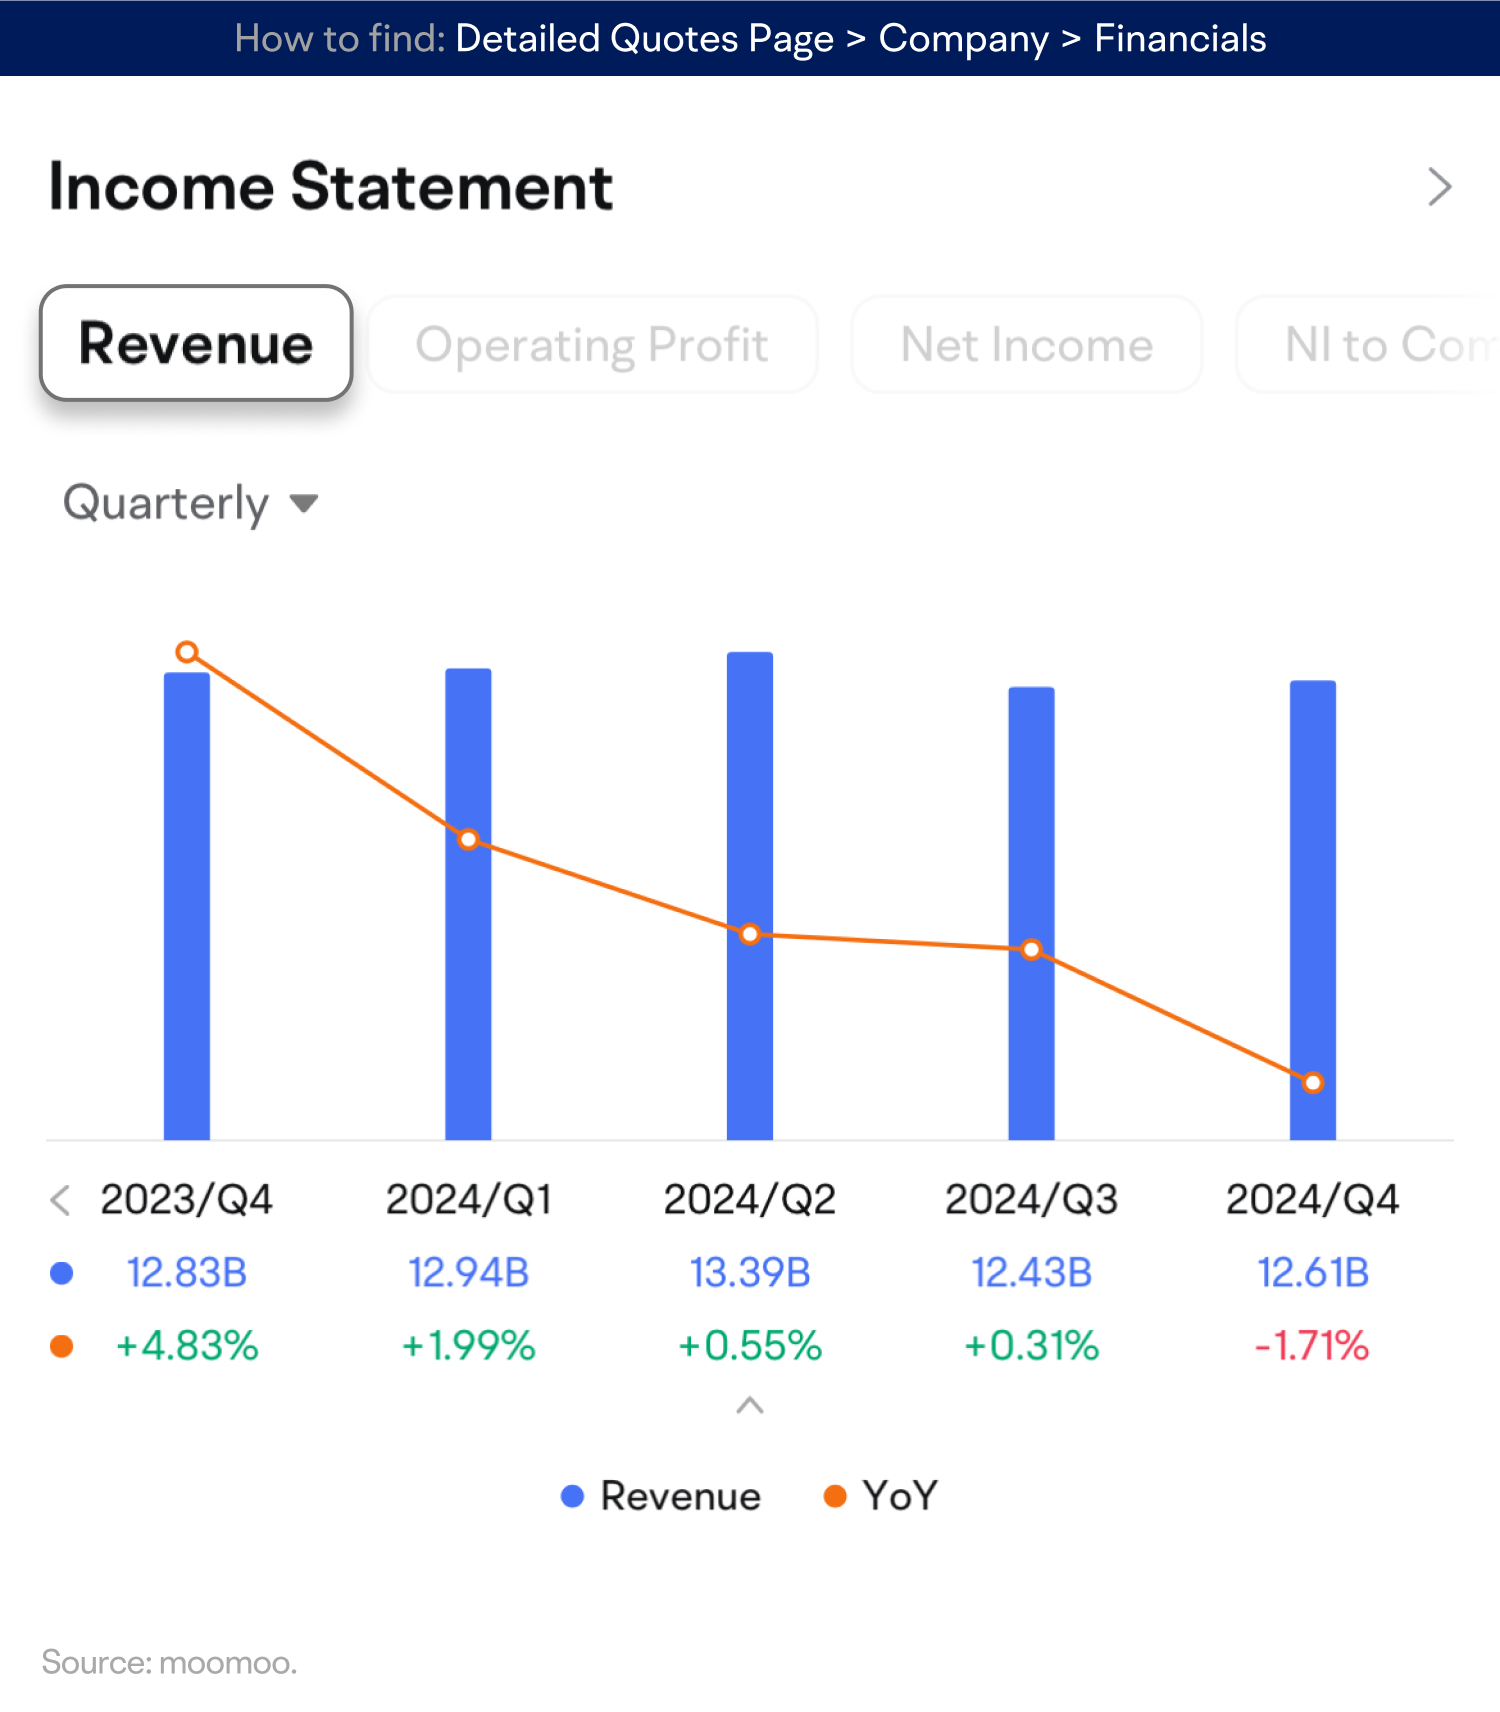
The company expects its revenue to decline by mid-single digits in fiscal 2025, with a projected 10% drop in the first quarter. This guidance suggests a continuing downward trend from the latest quarter, contrasting with the company's initial projection of overall sales growth for fiscal 2025.
Following the earnings call, at least five analysts downgraded Nike’s stock, with many more slashing their price targets. According to FactSet, the mean price target for Nike shares is now $97.29, a significant drop from $110.77 a month ago.
Morgan Stanley analyst Alex Straton was among those who downgraded Nike’s stock to Equalweight from Overweight. She also lowered her price target from $114 to $79, citing that Nike’s stock has been “put in the penalty box” for the near-term.
As of July 3, 2024, Nike’s shares had declined 30% year-to-date, a stark contrast to the S&P 500’s 16% gain, as investors grew wary of slowing growth at the retailer.
Wedbush senior vice president of equity research, Tom Nikic, noted that many investors view this as a “buy the pullback” event. However, they anticipate Nike’s shares to remain in the proverbial penalty box until new product innovations materialize and management regains investor trust.
Chart of the day
Trend analysis:
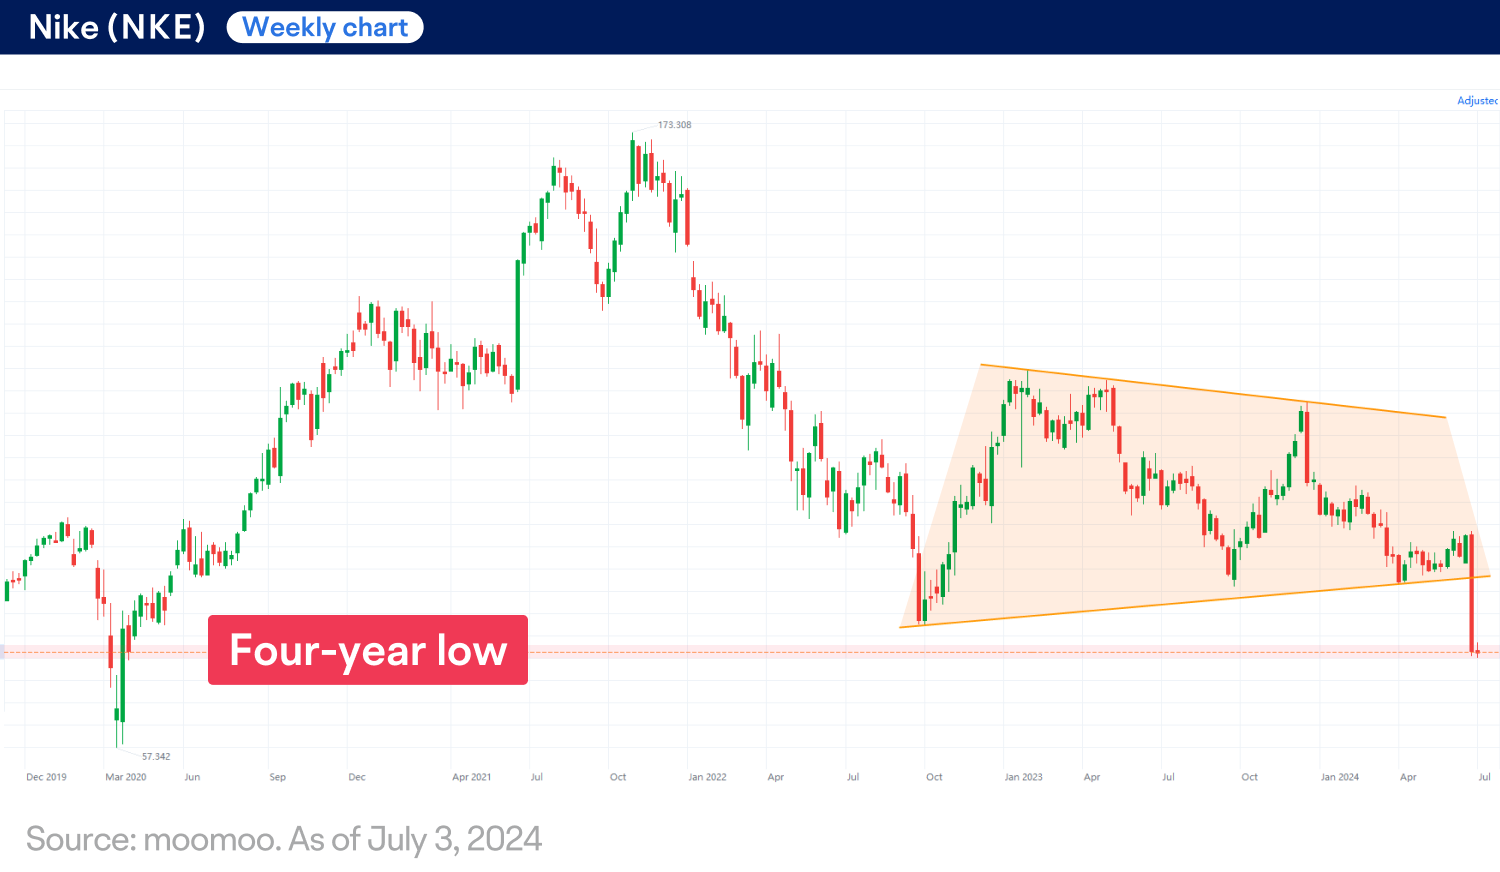
Nike’s shares (NKE) have hit a four-year low, suggesting a possible continuation of the bear market, as shown in the weekly chart above.
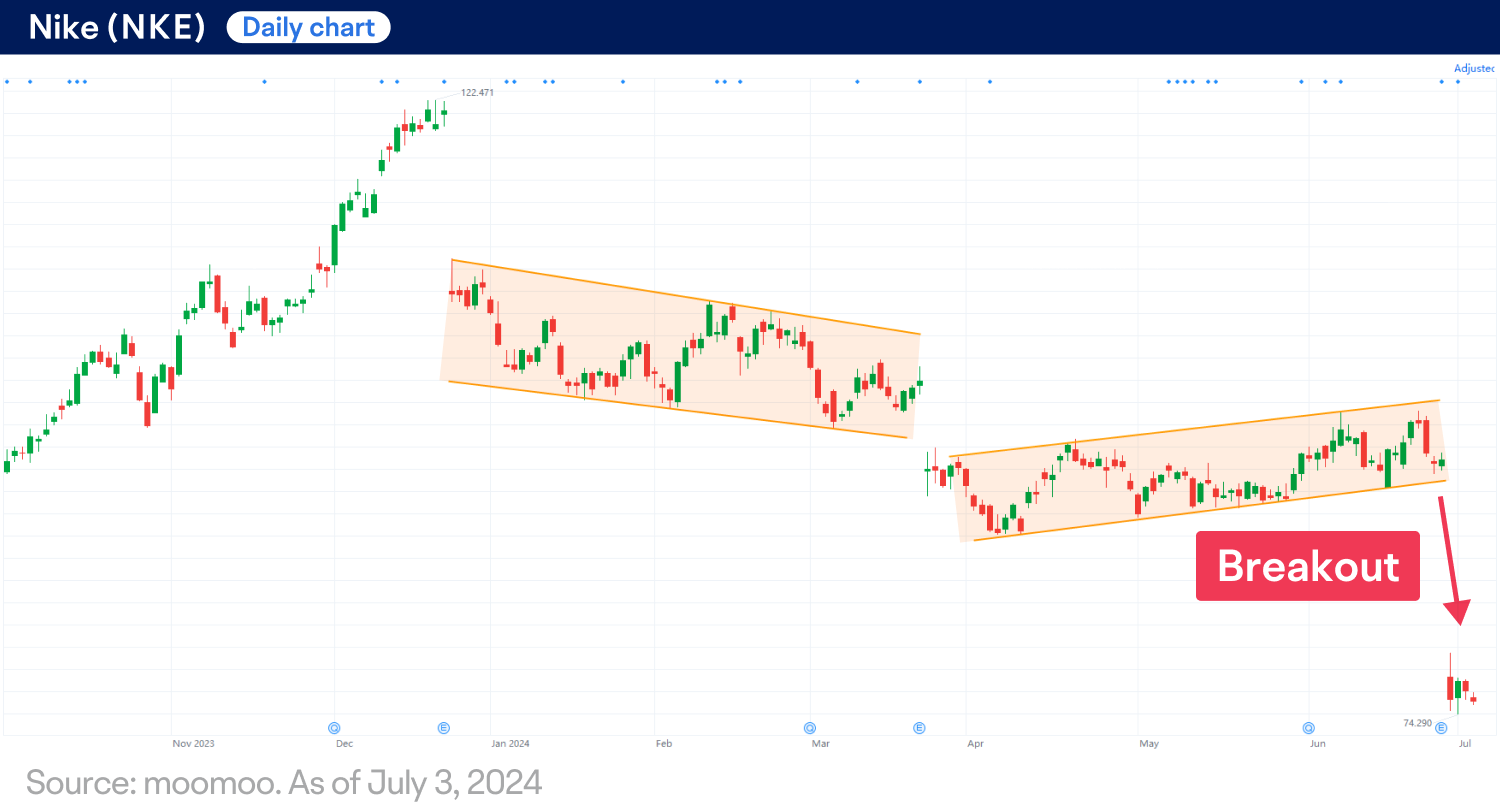
Before the latest earnings report, there was growing optimism on the Street that Nike was putting the worst behind it, with the stock price trending upward slightly over the past three months, as depicted in the daily chart above. However, that optimism all but vanished on June 28, resulting in the stock’s most significant percentage decrease in over two decades.
Technical indicators:
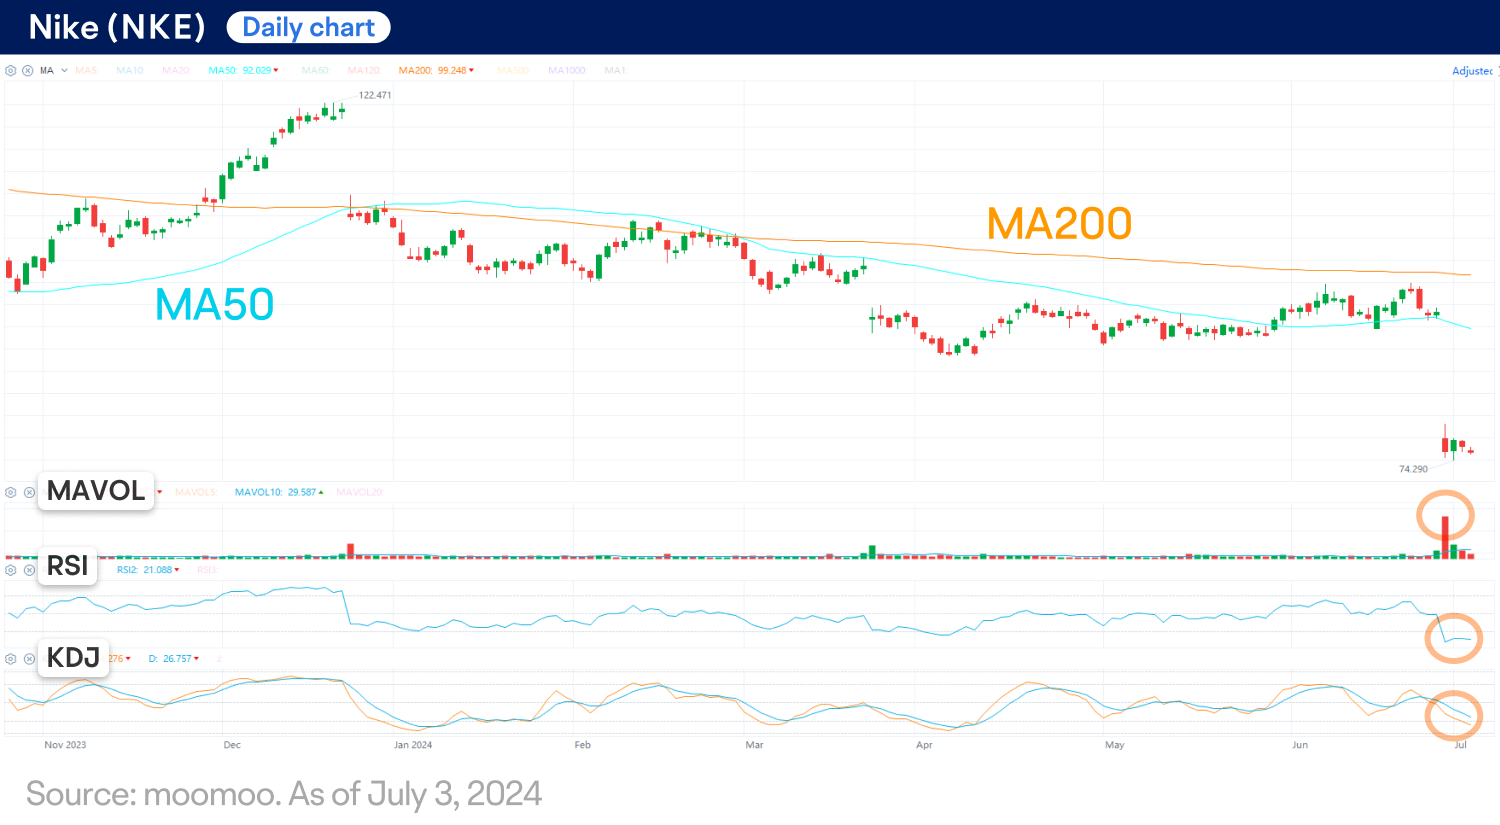
NKE is currently trading well below major moving averages (MAs), such as the 50-day and 200-day moving averages, indicating a bearish market sentiment.
Following Nike’s earnings report on June 28, trading volume surged significantly, reaching over ten times its 10-day moving average. This suggests a tremendous level of selling pressure in the market.
The relative strength index (RSI) has remained below the oversold territory (<30) for several days. A potential buy signal is likely to occur when the indicator rises above 30.
The KDJ indicator is also trading below the oversold territory (<20). A short-term bullish signal might occur when the K line crosses above the D line.
Next move?
NKE has just experienced a significant sell-off, and a bearish market could be identified following the one-day price decline of 20% from a technical perspective. This setback undermines the confidence of the bulls, who have been struggling to push the price higher slightly in recent months.
Traders who are considering “buying the dip” can monitor the daily trading volume, which has been declining as selling pressure subsides.
This presentation discusses technical analysis, other approaches, including fundamental analysis, may offer very different views. The examples provided are for illustrative purposes only and are not intended to be reflective of the results you can expect to achieve.
All investing involves risk, including the potential loss of principal, and there can be no guarantee that any investing strategy will be successful.
This presentation is for informational and educational use only and is not a recommendation or endorsement of any particular investment or investment strategy. Investment information provided in this content is general in nature, strictly for illustrative purposes, and may not be appropriate for all investors. Read more