How to Identify the Three Black Crows Pattern

On a candlestick chart, if you see three consecutive falling candles after an upward trend, you'd better be cautious. This could be a sign that the uptrend is about to reverse.
This particular candlestick pattern has a descriptive name: 'Three Black Crows.'
In this article, we will take a closer look at this pattern to help you understand it better.
What is a three black crows?
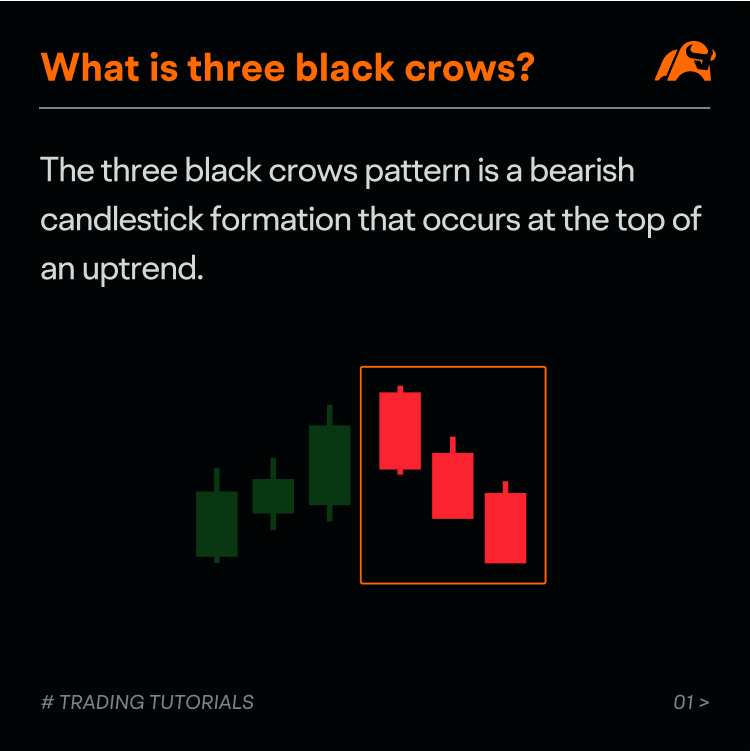
The three black crows pattern is a bearish candlestick formation that occurs at the top of an uptrend.
As the name suggests, the pattern consists of three consecutive bearish candles (black or red), with each having a lower close than the previous one.
The pattern usually indicates a weakness in an established uptrend and the potential emergence of a downtrend.
The three black crows pattern is the opposite of the three white soldiers, which generally appears at the end of a downtrend, signaling a potential market bottom.
How does a three black crows occur?
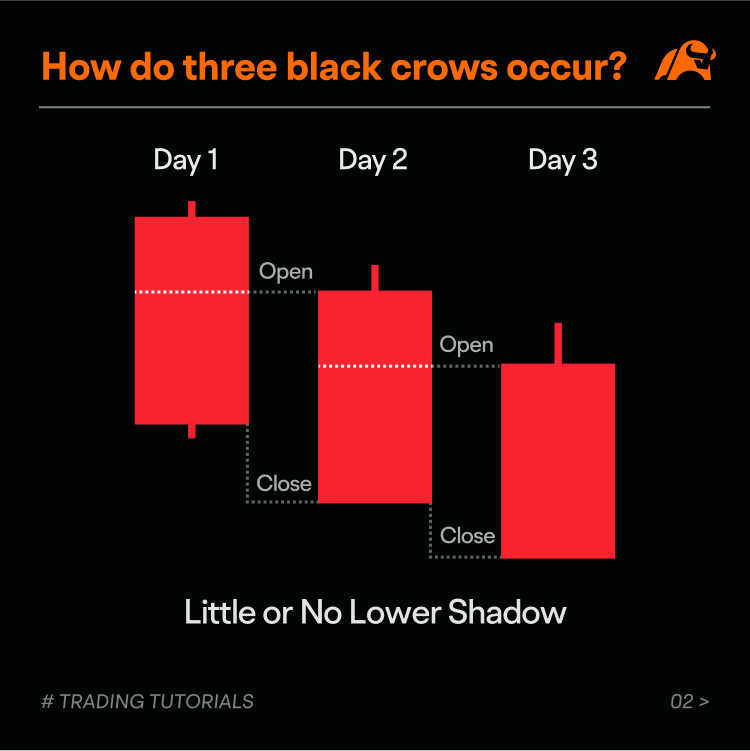
A standard three black crows pattern usually has these features:
● There must be three bearish (black or red) candlesticks in a row. Ideally, the candles' bodies should be similar in size.
● Each of these candles must open below the previous day’s open and within the previous candle's body. There are overlaps between the candles.
● Each candle has a lower close than the previous day's close, creating a staircase-like downward pattern.
● Each candle closes at or near its intraday low. Thus, the candles should have very small or no lower shadows.
It is important to take chart context into account for where a three black crows candle pattern is formed.
When you see a three black crows at the top of an uptrend, it means the buying strength is fading, and selling pressure is increasing. This could be a sign that a downtrend is about to start.
However, if a three black crows pattern appears during a downtrend or a period of sideways movement, it suggests that the existing trend is likely to continue rather than reverse.
How to identify a three black crows?
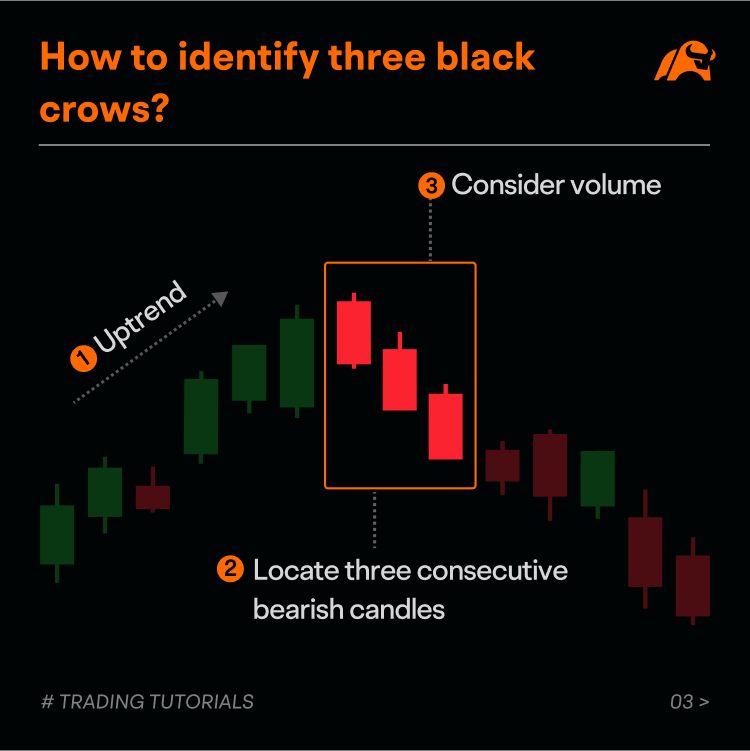
The following steps may help you identify the three black crows pattern as a signal for trend reversal:
● Recognize an uptrend: Look for a prevailing uptrend before the pattern appears. This establishes the context for a potential reversal.
● Locate three consecutive bearish candles: At the top of the uptrend, observe three consecutive bearish candles. Each candle has a lower close relative to the previous candle and has a very small (or nonexistent) lower shadow. Ideally, the three candles' bodies are similar in size. It suggests a strong selling sentiment and a potential shift in market sentiment.
● Consider volume: To determine the strength of a reversal signal, pay attention to the trading volume. If the volume is low during an upward trend but significantly increases during the formation of the three consecutive bearish candles, it may suggest a strong bearish sentiment.
Additionally, after the three black crows pattern appears, there might be an oversold situation, resulting in a short-term consolidation phase instead of an immediate drop. However, the overall sentiment remains bearish. To evaluate this, technical indicators like the RSI (Relative Strength Index) and support levels can be useful tools for traders.
Case study
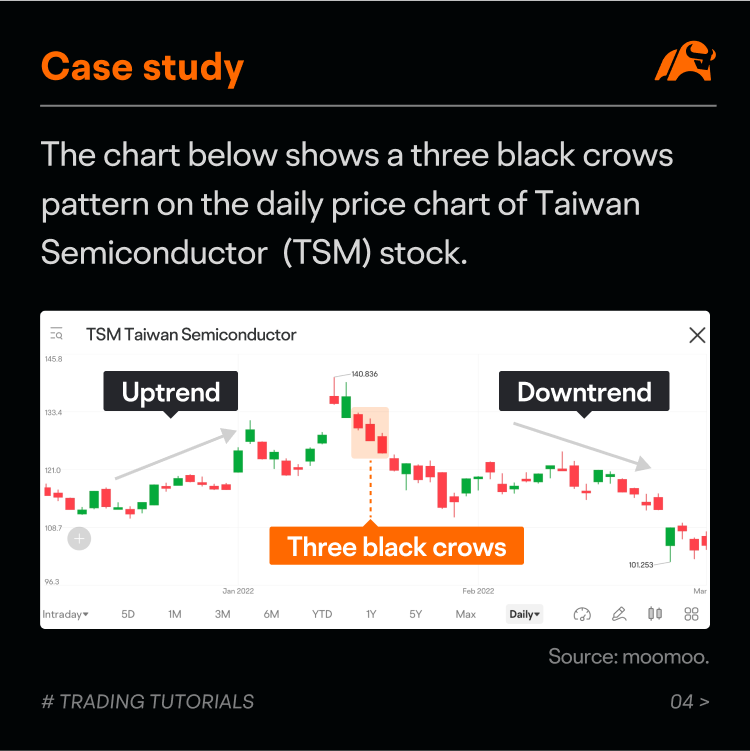
The chart below shows a three black crows pattern on the daily price chart of Taiwan Semiconductor Manufacturing Company (TSM) stock.
Before the appearance of the three black crows, the stock price had been rising significantly, indicating strong buying interest from investors.
At the top of the uptrend, three consecutive bearish candles appeared, with each day's closing price lower than the previous one. These candles had short or no lower shadows, which can be considered the three black crows pattern. This suggests that the bears had taken control and signals a potential price peak.
Afterward, TSM indeed experienced a sustained downtrend.
Summary
The three black crows is a bearish pattern formed with three candlesticks appearing at the top of an uptrend.
However, it's important to remember that the pattern is not always guaranteed to be successful and can occasionally produce false signals.
When trading candlestick patterns, it is important to factor in other technical methods.
This presentation is for informational and educational use only and is not a recommendation or endorsement of any particular investment or investment strategy. Investment information provided in this content is general in nature, strictly for illustrative purposes, and may not be appropriate for all investors. Read more