How to Identify Rising Three Methods

Market trends are rarely linear, and it’s common to see corrections along the way.
These corrections can form patterns, which can be helpful for traders to identify and interpret.
This week we’ll walk you through the rising three methods candlestick pattern, a tool helping you spot price corrections in an overall upward trend.
What is a rising three methods?
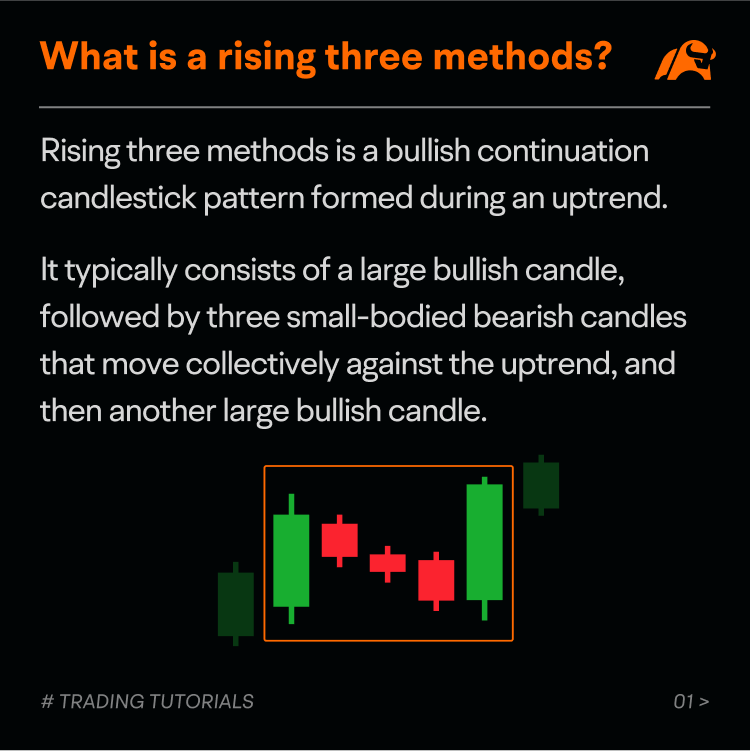
Rising three methods is a bullish continuation candlestick pattern that appears during an uptrend.
Despite its name, the pattern typically consists of five candles.
The first candle is a large bullish candle, followed by three small-bodied bearish candles that move collectively against the uptrend, and then another large bullish candle.
The bodies of the middle candles are within the range of the first candle, and the last candle closes above the closing price of the first candle.
The rising three methods pattern represents a short-lived consolidation during an uptrend and signals a potential bullish continuation of the trend.
How does a rising three methods occur?
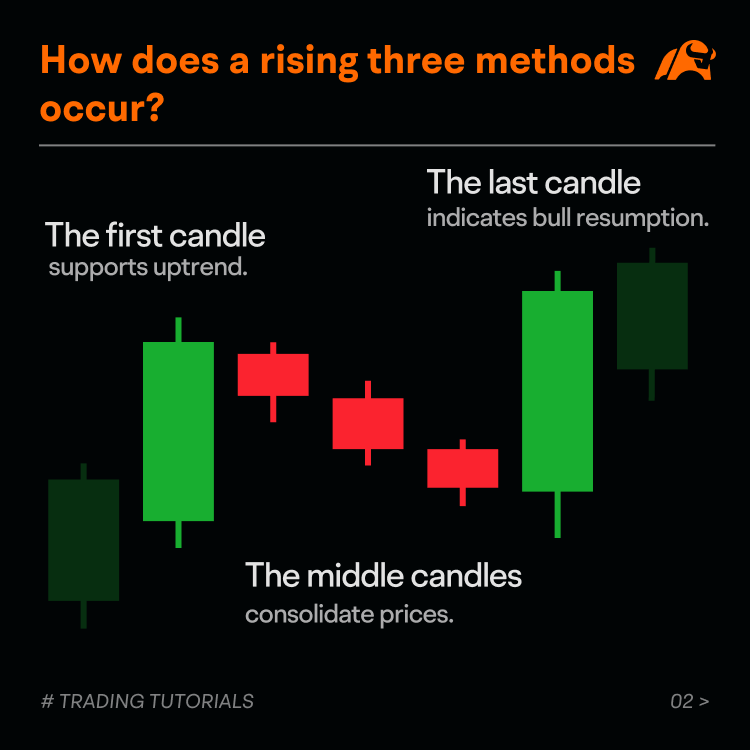
To better understand how rising three methods occurs and what it means, we could break down the pattern into 3 sections.
● The first candle
The first candle closes well above the opening price, which is supportive of the current uptrend.
● The middle candles
The middle candles represent a set of price consolidation with market participants possibly taking profit.
The bodies of these candles are within the range of the first candle, indicating the bears are not able to take over.
● The last candle
The last candle that completes the pattern makes a sharp rise and closes above the closing price of the first candle.
This suggests the bulls resume control and the price might continue to rise.
How to identify a rising three methods?
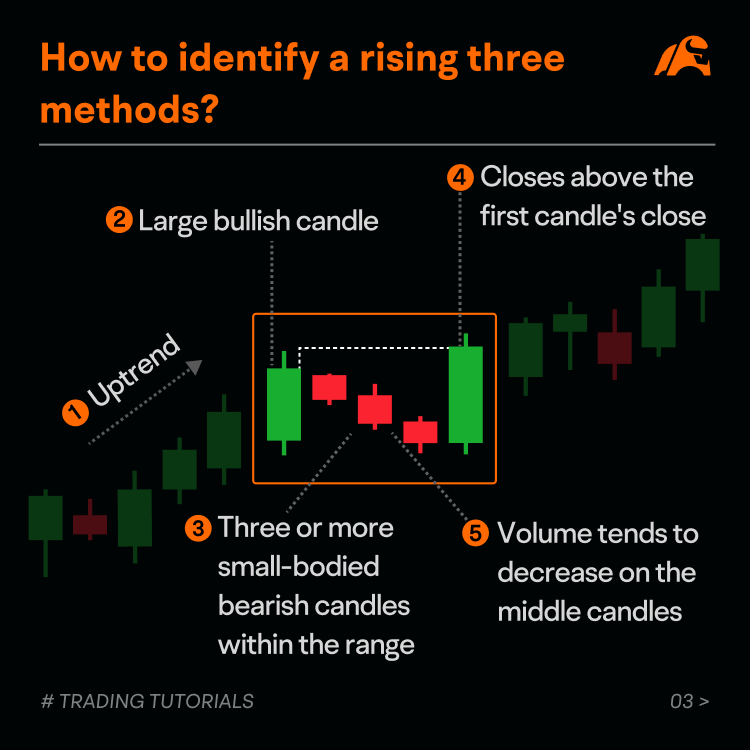
Rising three methods may not be easily identified as it typically consists of five candles, more than most other patterns.
However, the following features may help with identification.
● Uptrend
The pattern should be found in a well-defined uptrend. Otherwise, it may not be significant.
● The first candle
The first candle should be a large bullish candle. Typically, the shadows on the candle are relatively short.
● The middle candles
There could be three or more small-bodied bearish candles in the middle that move collectively against the current uptrend. The bodies of the middle candles should not exceed the high or low of the first candle.
● The last candle
The last candle should be a large bullish candle and close above the closing price of the first candle.
● Volume
Traders often look for a decrease in trading volume on the middle candles, as buying interest falls during the price consolidation.
Case study
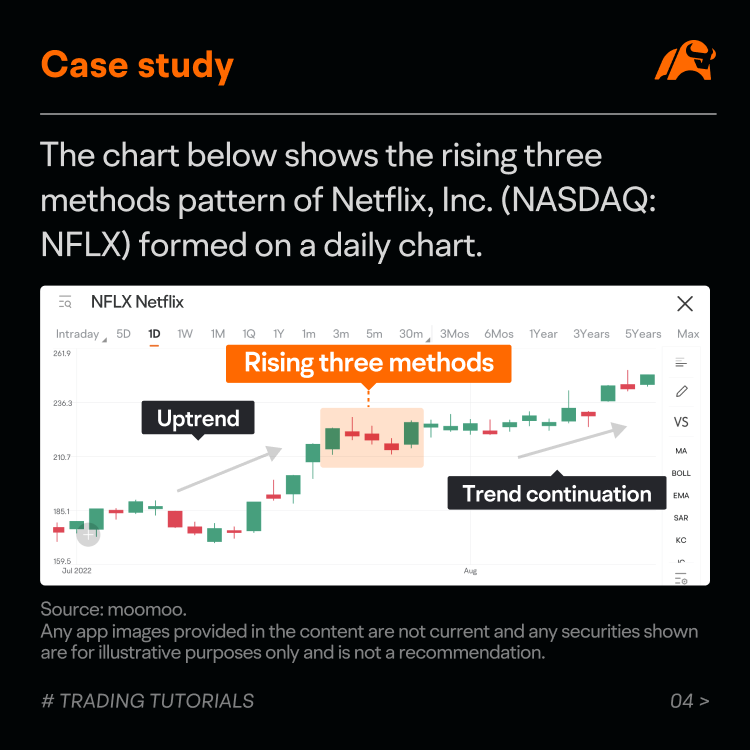
The chart below shows the rising three methods pattern of Netflix, Inc. (NASDAQ: NFLX) formed on a daily chart.
The stock had been trending upward before a rising three methods showed up.
The pattern started with a large bullish candle, followed by three small-bodied bearish candles that traded against the uptrend, and then another large bullish candle which closed above the closing price of the first candle.
The pattern acted as a consolidation of the current trend before the price continued moving upward.
Summary
The rising three methods is a bullish continuation candlestick pattern that appears during an uptrend.
The pattern might help traders identify a potential continuation of a bullish trend after a short-lived price consolidation.
If trading candlestick patterns, it is important to factor in other technical methods.
This presentation discusses technical analysis, other approaches, including fundamental analysis, may offer very different views. The examples provided are for illustrative purposes only and are not intended to be reflective of the results you can expect to achieve.
All investing involves risk, including the potential loss of principal, and there can be no guarantee that any investing strategy will be successful.
This presentation is for informational and educational use only and is not a recommendation or endorsement of any particular investment or investment strategy. Investment information provided in this content is general in nature, strictly for illustrative purposes, and may not be appropriate for all investors. Read more