How to Identify a Falling Three Methods Pattern?

The green and red candles on a candlestick chart can be a useful tool for investors if interpreted appropriately.
In this article, we’ll explore a specific group of candles known as the “falling three methods” and uncover what they might tell us about price trends.
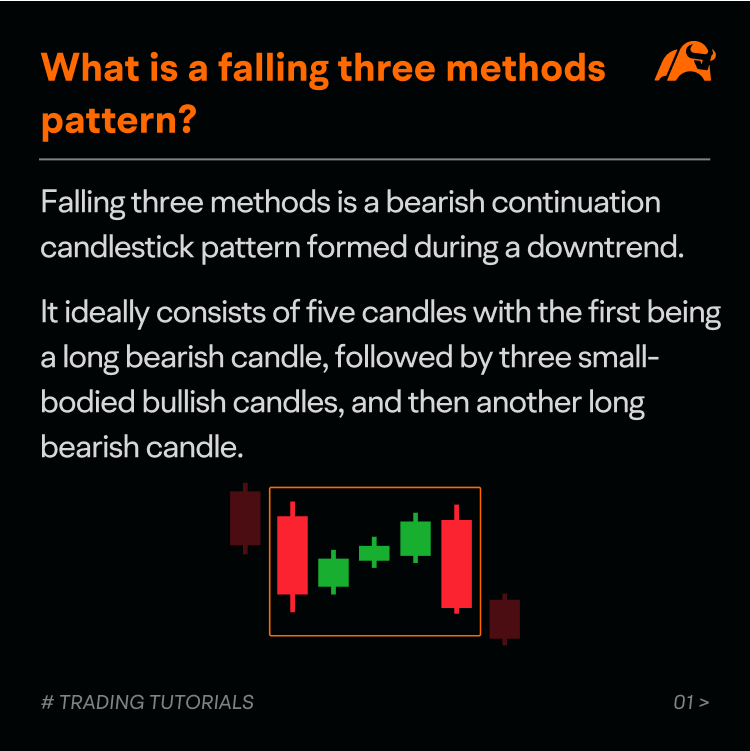
What is a falling three methods pattern?
Falling three methods is a bearish continuation candlestick pattern that appears during a downtrend.
The pattern ideally consists of five candles, with the first being a large bearish candle, followed by three small-bodied bullish candles, and then another large bearish candle.
Typically, the bodies of the middle candles are within the range of the first candle, and the last bearish candle should close below the closing price of the first candle.
The falling three methods pattern signifies a potential interruption of the downtrend.
The bullish version of this candlestick pattern is the rising three methods.
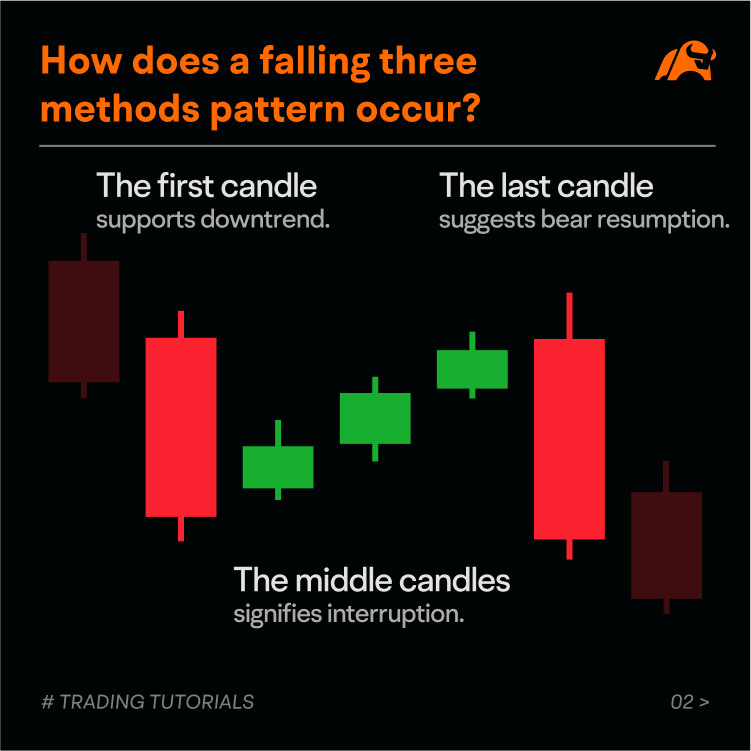
How does a falling three methods pattern occur?
To better understand how the falling three methods pattern occurs and what it might suggest, we could break down the pattern into 3 sections.
● The first candle
The first candle is bearish and long. It suggests a strong bearish momentum.
● The middle candles
After the first candle, typically come three small-bodied bullish candles that move collectively against the downtrend, representing a temporary change in market sentiment with several market participants possibly closing short positions.
● The last candle
The last candle that completes the pattern is also a long bearish candle, with a closing price below the first candle’s close.
This candle indicates the bears may have resumed control, suggesting a continuation of the prior downtrend.
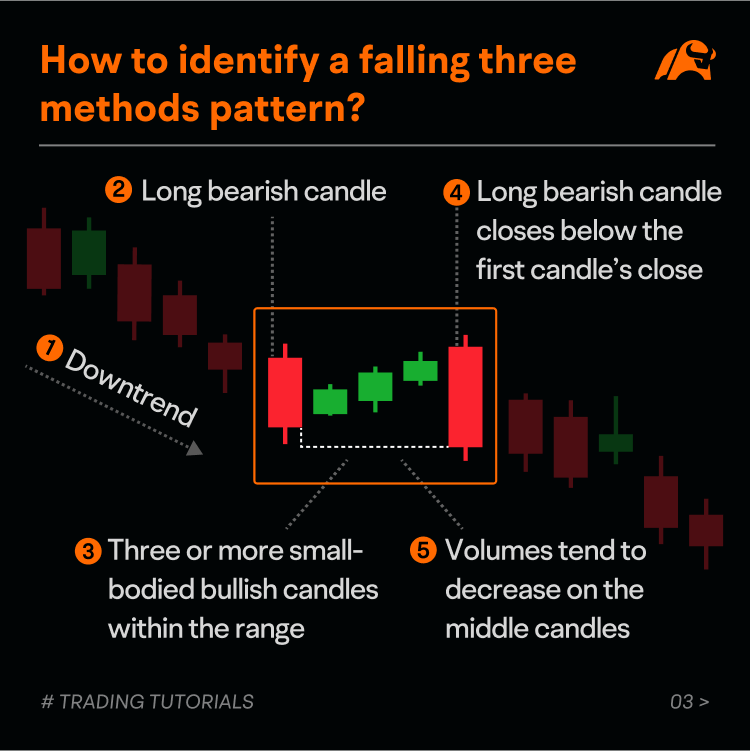
How to identify a falling three methods pattern?
To try to identify the falling three methods pattern, traders might look for the following characteristics.
● Downtrend
The pattern should be found in a well-defined downtrend; otherwise, it may not be meaningful.
● The first candle
The first candle in this pattern should be a long bearish candle, which results from a relatively steep price drop during the trading period.
● The middle candles
There could be three or more small-bodied bullish candles in the middle of the pattern that move collectively against the current downtrend.
Typically, the bodies of these candles should not exceed the high or low of the first candle.
● The last candle
The last candle should also be a long bearish candle and close below the closing price of the first candle.
● Volume
Trading volumes tend to decrease on the middle candles compared with the first and last candles, as the bullish sentiment is not as strong as the bearish trend.
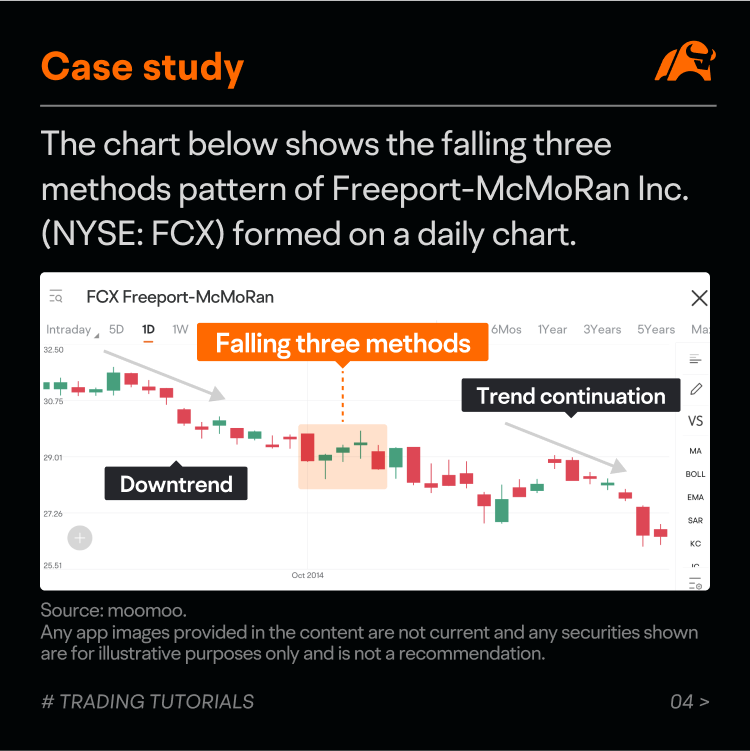
Case study
The chart below shows the falling three methods pattern of Freeport-McMoRan Inc. (NYSE: FCX) formed on a daily chart.
The stock had been trending downward before the falling three methods pattern started to form.
On the first day of the pattern, the stock dropped significantly. Then the price bounced up a little for three consecutive days. And the pattern was completed on the fifth day with the price declining again and closing at the pattern's new low.
After the pattern, the bearish sentiment resumed, pushing the price even lower.
Summary
The falling three methods is a bearish continuation candlestick pattern that appears during a downtrend.
The pattern could be a useful tool for traders looking to identify and potentially take advantage of bearish continuation trends.
It is important to note that any candlestick pattern should not necessarily be used as the sole indicator for a trading decision.
This presentation discusses technical analysis, other approaches, including fundamental analysis, may offer very different views. The examples provided are for illustrative purposes only and are not intended to be reflective of the results you can expect to achieve.
All investing involves risk, including the potential loss of principal, and there can be no guarantee that any investing strategy will be successful.
This presentation is for informational and educational use only and is not a recommendation or endorsement of any particular investment or investment strategy. Investment information provided in this content is general in nature, strictly for illustrative purposes, and may not be appropriate for all investors. Read more