How to Value a SaaS Company

In the past 20 years, the SaaS trend has been a significant growth driver in the software industry.
However, few investors fully understand this business model, and some others may be scared off by SaaS stocks' high P/E ratio.
So are they overvalued?
This article will explain the SaaS business model and introduce some key metrics to evaluate SaaS companies.
01 SaaS Industry Overview
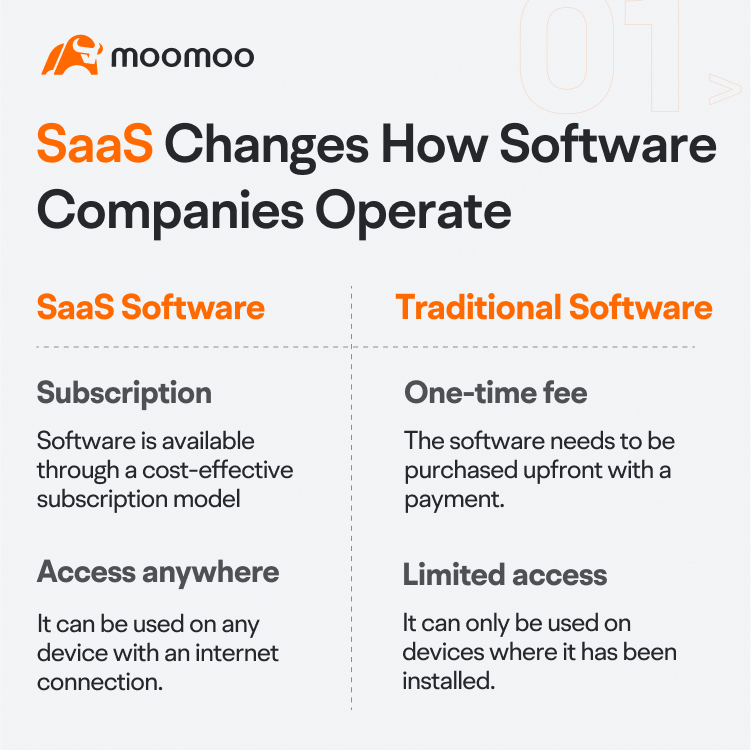
The software-as-a-service (SaaS) model has changed the way software companies do business.
In the past, traditional software companies offered self-hosted solutions that users would purchase and install on their own servers or devices and then pay a one-time license fee to use the software indefinitely.
With the rise of SaaS, software companies now offer cloud-based solutions that users can access from anywhere with an internet connection and pay a subscription fee on an ongoing basis to use the software.
The innovation in the business model benefits both customers and software companies. Customers can access the applications across multiple devices without paying a high upfront fee. At the same time, SaaS companies receive attractive streams of recurring revenue.
Many SaaS companies experienced significant growth in the 2010s and into the 2020s as more organizations adopted their services to improve efficiency, scalability, and flexibility.
During the COVID-19 pandemic, the performance of SaaS stocks was generally strong as the need for remote work solutions and digital transformation accelerated. Companies like Zoom, Microsoft, Salesforce, and Adobe saw increased demand for their products and services.
02 Key Operating Metrics
Considering the nature of their subscription-based business models, we may use a unique set of metrics to evaluate SaaS companies' operational efficiency.
Here are some key metrics that can provide insights into a SaaS company's overall health.
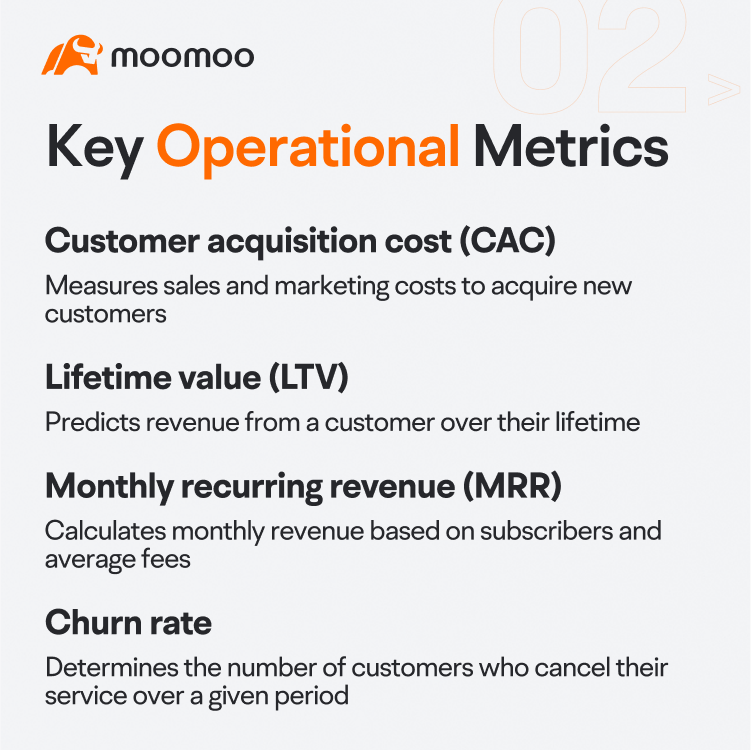
● Customer acquisition cost (CAC)
CAC tells you how much it costs a SaaS company in sales and marketing to acquire a new customer.
For instance, if a company invests US$1 million in marketing to capture 5,000 new customers, we can calculate its CAC by dividing the total cost of sales and marketing by the number of new customers.
The formula: CAC = US$1,000,000 ÷ 5000 = US$200. So it costs the company $200 on average to acquire a new customer.
● Lifetime Value (LTV)
LTV expresses the average revenue a SaaS company can anticipate from a customer over its service lifetime.
Generally, we compare the LTV to the CAC to see a business's potential for growth and profitability.
If a company's CAC is lower than its LTV, say $200 and $500, respectively, its business is considered healthy and profitable. If the CAC is higher than the LTV, say $200 to $100, it suggests that the business is not currently profitable.
Ideally, a SaaS company with robust business has an LTV three times its CAC.[1]
● Monthly Recurring Revenue (MRR)
MRR calculates the recurring revenue of a SaaS company in a month.
The calculation of MRR is simple: multiplying the number of subscribers by the average monthly subscription fee.
For example, if a subscription-based business had 500 customers paying an average of US$20 per month, the MRR would be US$10,000.
● Churn Rate
The churn rate is a crucial metric for investors to consider. This metric determines the percentage of subscribers who have canceled their service within a given period, which could either be monthly or annually.
The formula for calculating the churn rate is dividing the number of canceled customers by the total number of customers at the beginning of the period, then multiplying by 100%. For instance, if a business started the year with 2000 customers and lost 100 of them during that year, the churn rate will be (100 ÷ 2000) x 100% = 5%.
The ability to retain customers is important because getting new ones can be expensive. If a business has a lot of customers lost, adding new ones alone won't work and will cost more money.
Therefore, a low churn rate indicates that customers are satisfied and loyal, potentially leading to higher revenue growth and profitability.
[1] Source: CFI, "CAC LTV Ratio"
03 Valuation Metrics
The price-to-earnings (P/E) ratio is a common valuation metric used to determine whether a stock is overvalued or undervalued.
However, most SaaS companies tend to trade at a high PE, and some may even have negative earnings for several reasons:
1. Growth prospects: SaaS companies often invest heavily in marketing and sales to acquire new customers and expand market share. These moves can be drivers of rapid revenue growth, but they may also lead to a decrease or even negative earnings. Investors believe that a high growth rate can potentially bring profits in the future as the company gains more customers and scales up its operations.
2. Revenue recognition delay: SaaS companies typically use a subscription-based model, meaning revenue is recognized over time as the customer continues to use the service. This can lead to a delay in revenue recognition, resulting in low or negative earnings until the customer base reaches a certain size.
In such cases, other valuation metrics like price-to-sales (P/S) might be more appropriate for evaluating SaaS stocks.
The P/S ratio is a useful valuation metric in situations where a company is in the early stages of growth, operates in a high-growth industry, or has inconsistent earnings.
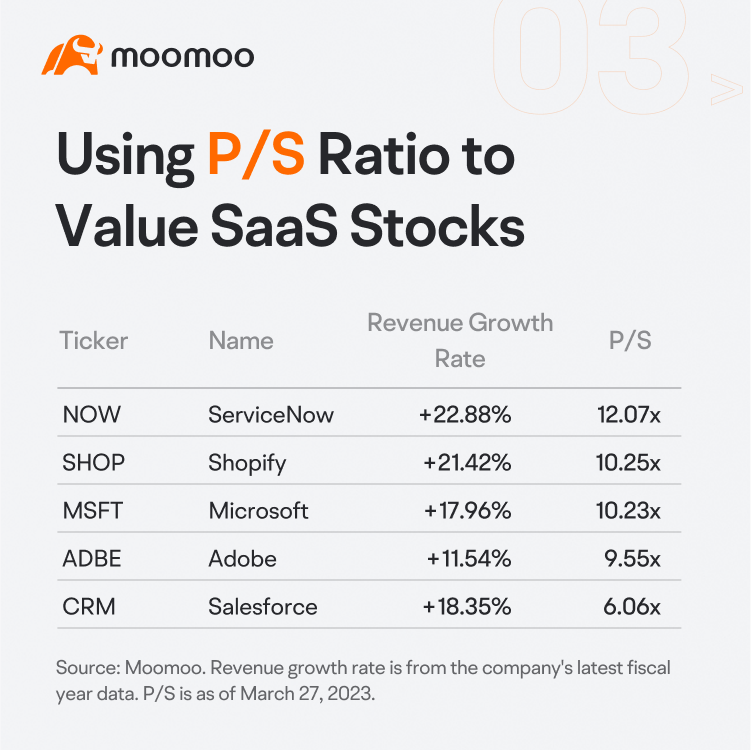
A P/S ratio of 1x means you pay $1 for every $1 of sales.
Here are the revenue growth rate and P/S ratios of some SaaS stocks.
04 Rule of 40
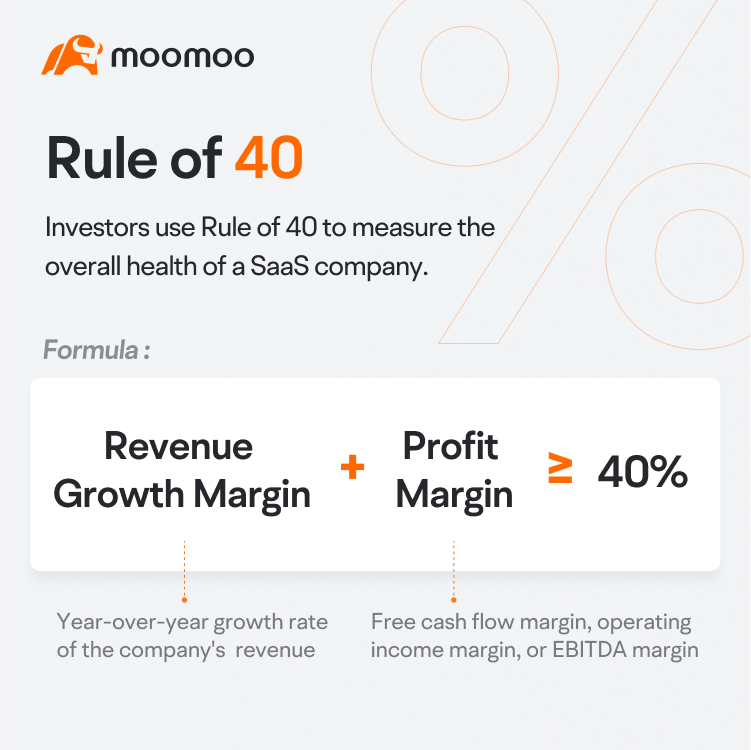
Investors can also use the Rule of 40 to measure the overall health of a SaaS company.
The Rule of 40 focuses on a SaaS company's growth and profitability, to be more exact, the revenue growth rate and the profit margin. The idea behind the principle is that the revenue growth rate plus profit margin should equal or exceed 40%.
The revenue growth rate refers to the rate at which a company's revenue is increasing year over year. Profitability margin, on the other hand, can be free cash flow margin, operating income margin, or EBITDA margin.
The Rule of 40 sets the benchmark for SaaS companies. In general, a score above 40 means the company is doing well, while a score below 40 suggests it needs to improve financially.
Early-stage SaaS companies often beat that mark because they grow quickly. However, mature companies with slower growth sometimes need to improve their profit margins to meet the benchmark.
Here are a few examples to help you understand:
1. Company A's revenue growth rate is 100%, but its operating income margin is -40%, then its Rule of 40 scores would be 60% (100% - 40%), which meets the benchmark. Although the company is not profitable, it grows at a rapid rate. It could be an early-stage company with high growth potential.
2. Company B's revenue growth rate is 30% and its operating income margin is -10%, then its Rule of 40 scores would be 20% (30% - 10%). Since the score is lower than 40%, it suggests that the company is not performing well because though the company is burning money, it fails to drive growth.
3. Company C's revenue growth rate is 30% and its operating income margin is 15%, then its Rule of 40 scores would be 45% (30% + 15%). Since the score is higher than 40%, the company can be considered a good performer.
It is important to note that the Rule of 40 is just one metric and should be used in conjunction with other factors when evaluating a company's performance and potential for investment.
05 Summary
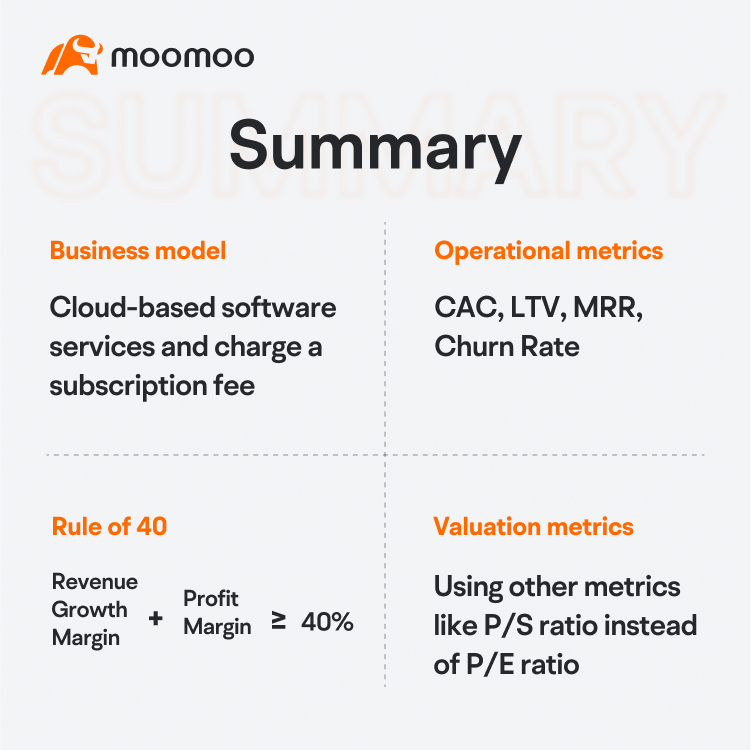
The SaaS (software-as-a-service) model, where companies offer software services on the cloud and charge a subscription fee on an ongoing basis, has changed the way software companies operate.
Key metrics like customer acquisition cost, lifetime value, monthly recurring revenue, and churn rate can provide insights into the overall operational efficiency of a SaaS company. Investors can also use Rule of 40 to measure the overall health of a SaaS company.
The price-to-earnings ratio is not always an appropriate valuation metric for SaaS stocks, as most SaaS companies tend to trade at a high P/E and some even operate at a loss, so other metrics like price-to-sales ratio might be more appropriate.
This presentation is for informational and educational use only and is not a recommendation or endorsement of any particular investment or investment strategy. Investment information provided in this content is general in nature, strictly for illustrative purposes, and may not be appropriate for all investors. Read more