How to Identify a Harami

When you spot a large candle followed by a smaller one of the opposite color, looking like a pregnant woman, you'd better pay attention as it may signal the current trend is about to reverse.
This article will walk you through a popular two-candlestick pattern: the harami pattern.
What is a harami?
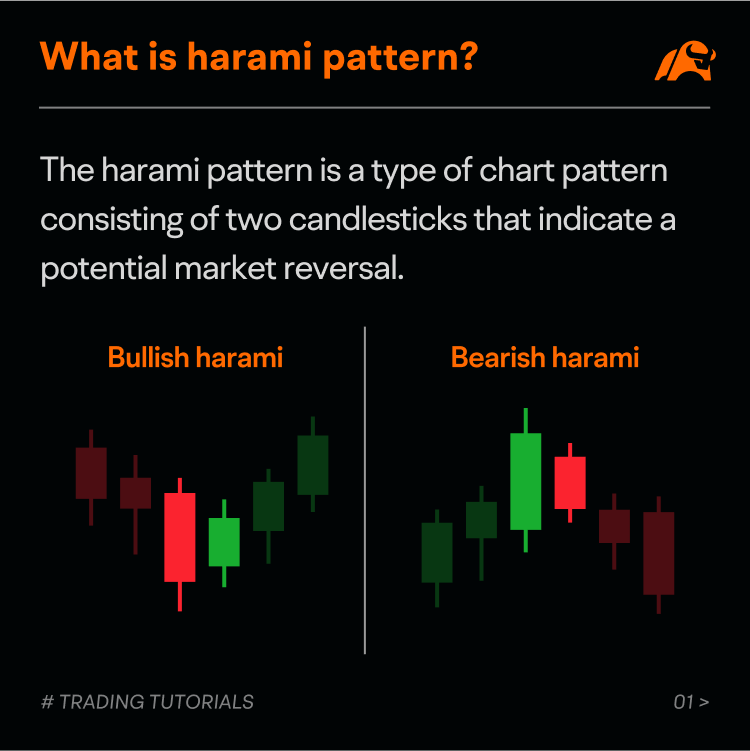
A harami is a type of chart pattern with two candlesticks that indicate a potential market reversal.
It comes from the Japanese word "harami," which means "pregnant."
In this pattern, the two candlesticks have opposite colors. The first candle's body is longer than the second one, and the body of the second candle is enclosed within the first candle's body. This combination makes the pattern look like a pregnant mother, with the first candlestick representing the mother and the second candlestick representing the baby.
There are two types of harami patterns: bullish harami and bearish harami. A bullish harami is made of a large bearish candlestick followed by a small bullish candlestick, while a bearish harami consists of a large bullish candlestick followed by a small bearish candlestick.
How does harami occur?
The harami is a trend reversal pattern and must appear in an existing trend.
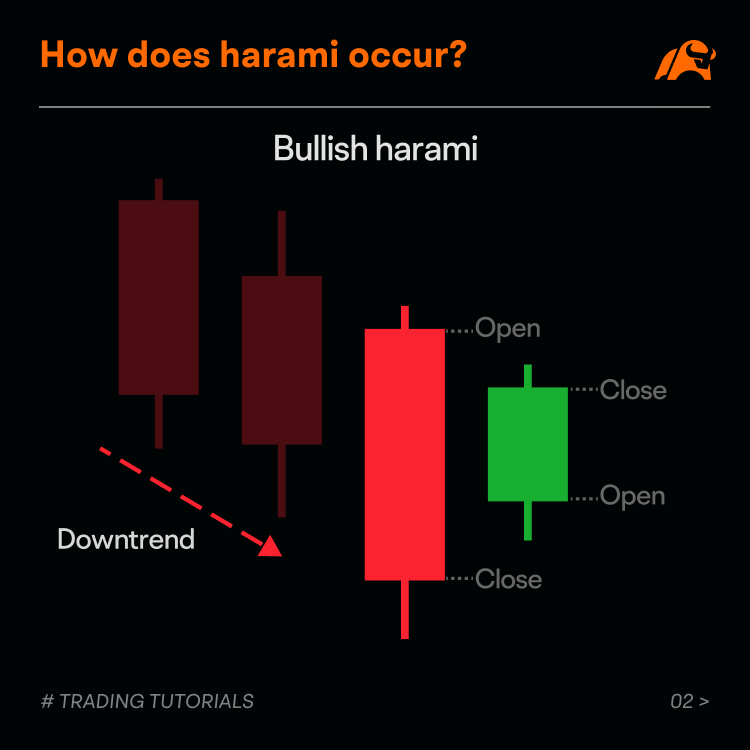
If the pattern appears during a downtrend, it can be a potential bullish indicator and is known as a bullish harami.
A bullish harami starts with a large bearish candle, which shows that the downtrend continues.
But on the next day, the price opens higher and keeps going up until it closes lower than the previous candle's open.
Thus a small bullish candle is formed, indicating that the bears are losing strength, while the bulls are getting stronger.
It suggests that the downtrend may be ending, and a new uptrend may follow.
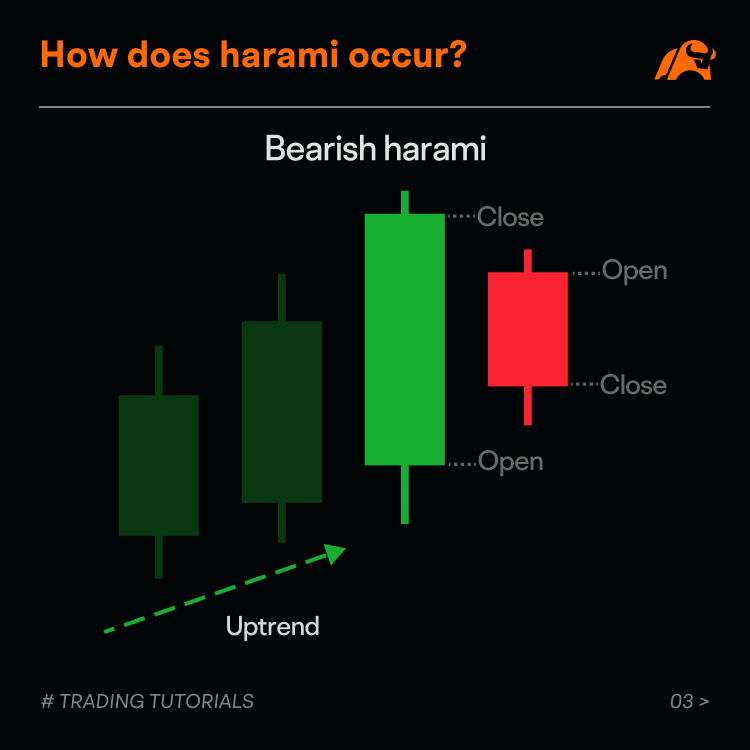
If the pattern appears in an uptrend, it may signal that the trend is about to reverse and turn bearish. This is called a bearish harami.
The first candle of a bearish harami is a bullish candle with a large body, indicating that the current uptrend is still ongoing, and the bulls are pushing the price higher.
However, on the next day, the price opens lower and keeps going down until it closes higher than the previous candle's close.
This creates a small bearish candle, which suggests the bulls are becoming weaker, while the bears are gaining strength.
This may indicate that the previous upward trend is coming to an end and a new downward trend may start.
In both cases, the second candle of the pattern indicates losing the momentum of the previous trend and a reversal may be imminent.
However, confirmation is needed to determine the signal.
How to identify harami?
In practice, identifying the harami pattern can be divided into two situations: bullish harami and bearish harami.
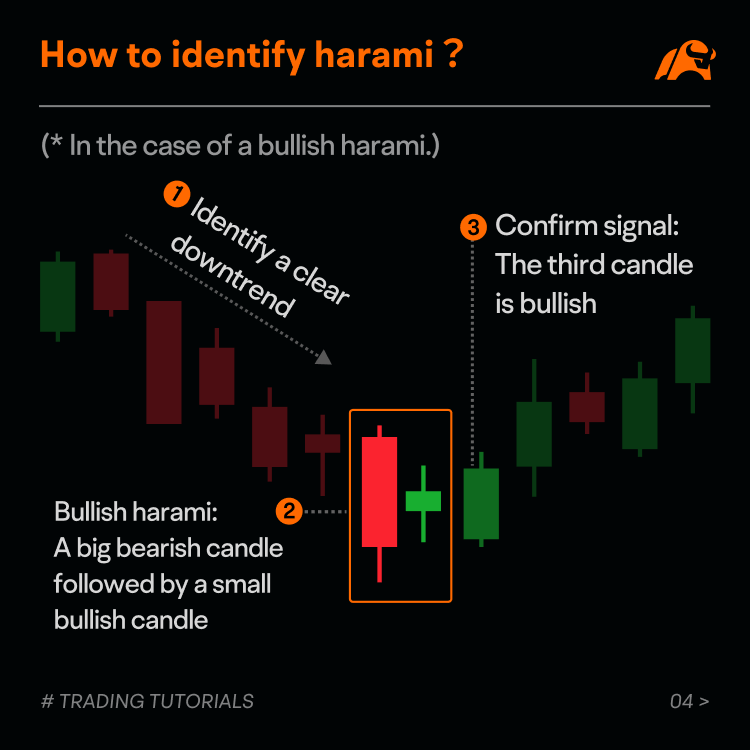
To identify a bullish harami, follow these steps:
1. Identify the trend: First, determine the prevailing trend. For a bullish harami to form, there must be a strong downtrend in the market.
2. Look for the pattern: Next, examine the candlesticks for a large bearish candle followed by a smaller bullish candle. To form a bullish harami, the smaller candle must be entirely within the larger one. The length of the wicks doesn't matter.
3. Confirm the signal: Simply recognizing the candlestick pattern isn't always sufficient to predict a trend reversal. Wait for confirmation before entering a trade. Look for the price action of the third candle. If it is a bullish candle, it may confirm the reversal of the trend.
The steps in identifying a bearish harami pattern are similar:
1. Identify the trend: First, determine the prevailing trend. For a bearish harami to form, there must be a strong uptrend in the market.
2. Look for the pattern: Check for a large bullish candle followed by a smaller bearish candle completely engulfed by the larger one. The wicks don't matter.
3. Confirm the signal: Wait for confirmation before entering a trade. Look for the price action of the third candle. If it's a bearish candle, it may confirm the reversal of the trend.
Case study
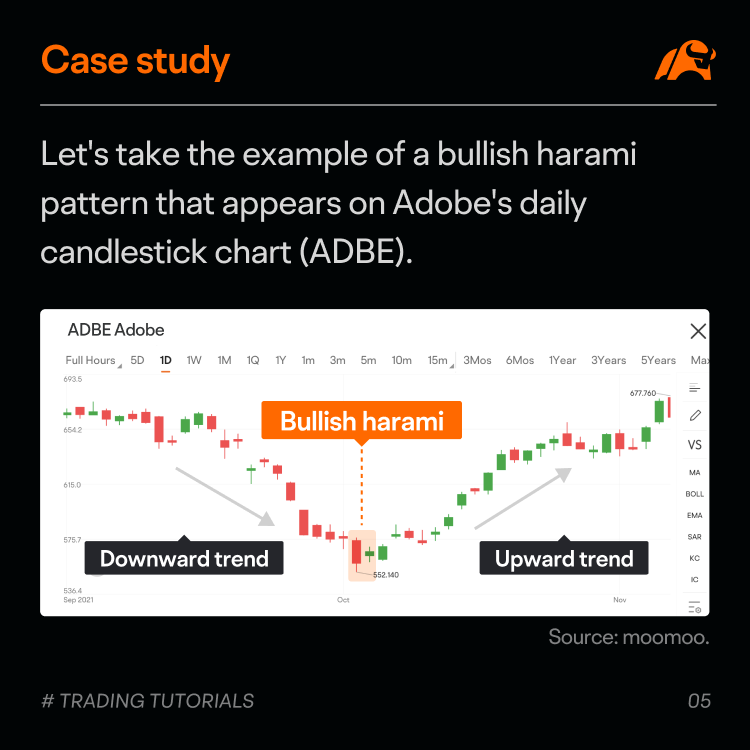
Let's take the example of a bullish harami pattern that appears on Adobe's daily candlestick chart (ADBE).
On the chart, you can see that the stock price experienced a significant downward trend, indicating strong bearish sentiment in the market.
At the bottom of the downtrend, a bullish harami pattern emerges. The first candle is a large bearish candle, and the second candle is a small bullish candle, with the body of the second candle contained within the body of the first one. This pattern indicates that the downtrend may be reversing.
To confirm the reversal signal, you can refer to the price action of the third candle. The chart shows that the third candlestick is a bullish candle, confirming that the price may be bottoming out.
After that, the price trend reverses, and the stock price experiences an upward trend.
Summary
In general, the harami pattern is a common reversal pattern that often appears at the top or bottom of the market. A bullish harami pattern that appears after a downtrend is a bullish signal, while a bearish harami pattern that appears after an uptrend is a bearish signal. In practice, candlestick patterns should be used in conjunction with other technical analysis tools to better assist decision-making.
This presentation is for informational and educational use only and is not a recommendation or endorsement of any particular investment or investment strategy. Investment information provided in this content is general in nature, strictly for illustrative purposes, and may not be appropriate for all investors. Read more