How to Identify a Hammer Candlestick
It is very important to learn how to time the market.
In technical analysis, candlestick charts can be used to identify potential entry and exit points for a trade.
This article will introduce a common candlestick pattern: the hammer.
What is a hammer?
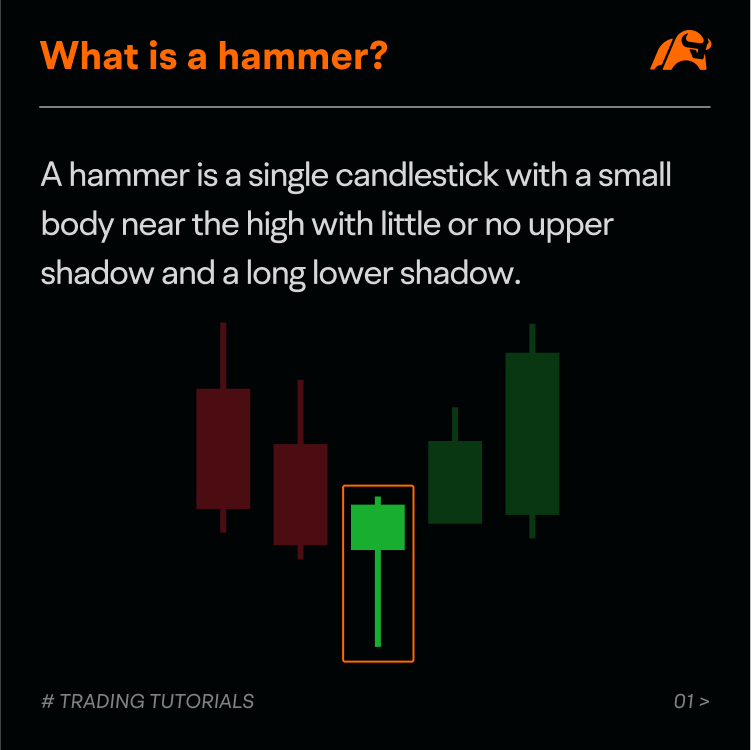
A hammer is a bullish reversal candlestick pattern formed during a downtrend.
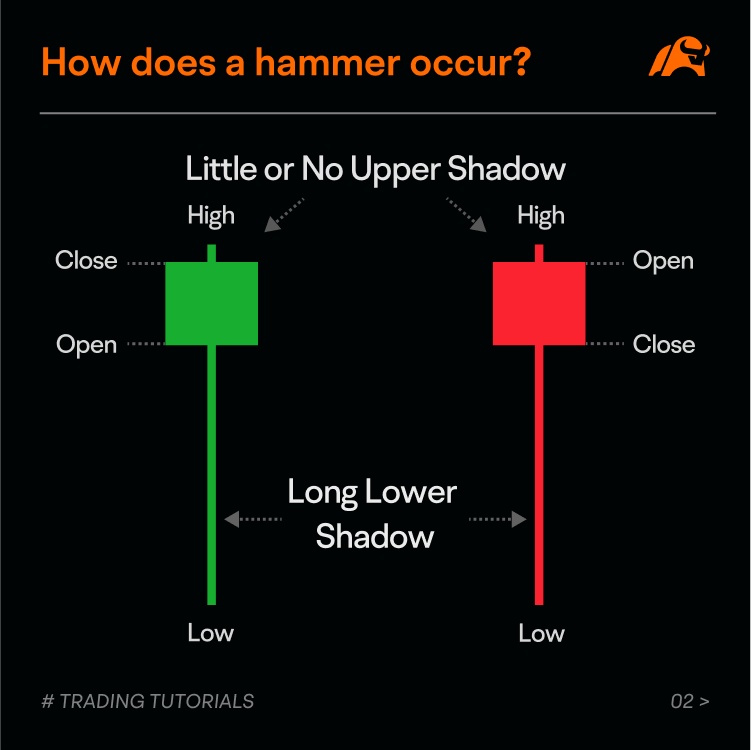
The formation is a single candlestick with a small body near the high with little or no upper shadow and a long lower shadow.
The occurrence of a hammer may signal the end of a downtrend is near and that there is potential for the price to reverse to the upside.
How does a hammer occur?
Understanding the psychology behind the hammer pattern is important.
A hammer candlestick generally occurs during a downtrend, when bears are in control.
The long lower shadow on the hammer candlestick indicates the bears' effort to continue pushing the price significantly lower.
The small real body indicates that buyers absorb selling pressure and push the market price near the opening price by the time the market closes. The closing price can be above or below the opening price.
The fact that the price's ascent from its session low to a higher close suggests that a more bullish outlook won the day, setting the stage for a potential reversal to the upside.
How to identify a hammer?
The hammer candlestick is one of the easiest formations to identify, thanks to its distinctive appearance.
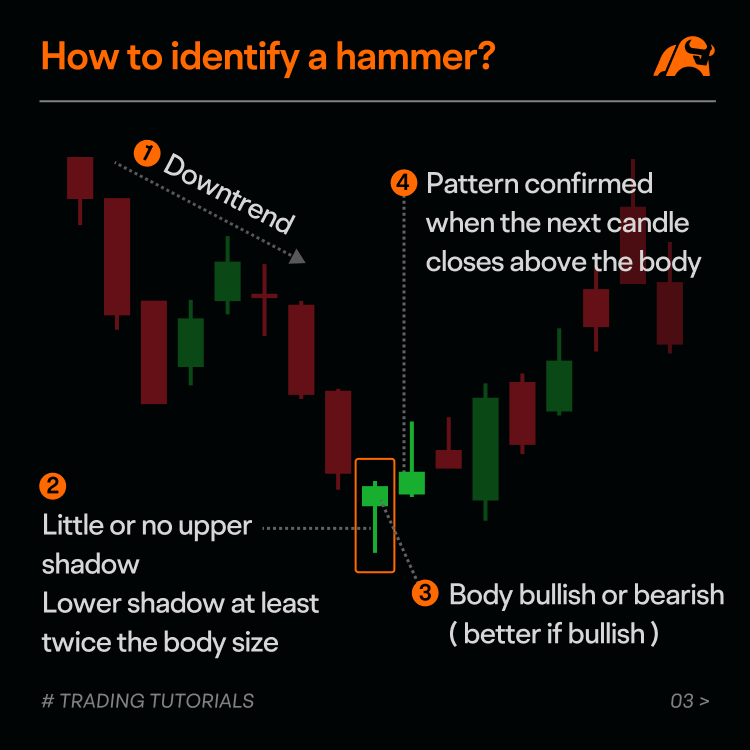
To identify a hammer pattern, you need to spot the following:
● A hammer occurs at the end of a clear downtrend.
● The candle must have either a very short upper shadow or no upper shadow at all. The lower shadow should be at least twice the length of the real body.
● The body's color can be green (a bullish candle) or red (a bearish candle), though a bullish candle hints at a more bullish bias.
● The bullish bias would be confirmed the following day, with the price closing above the hammer's body.
● The pattern is still valid when the price trades above the hammer's bottom. Once the price breaks the bottom of the hammer and goes lower, the pattern fails.
Case study
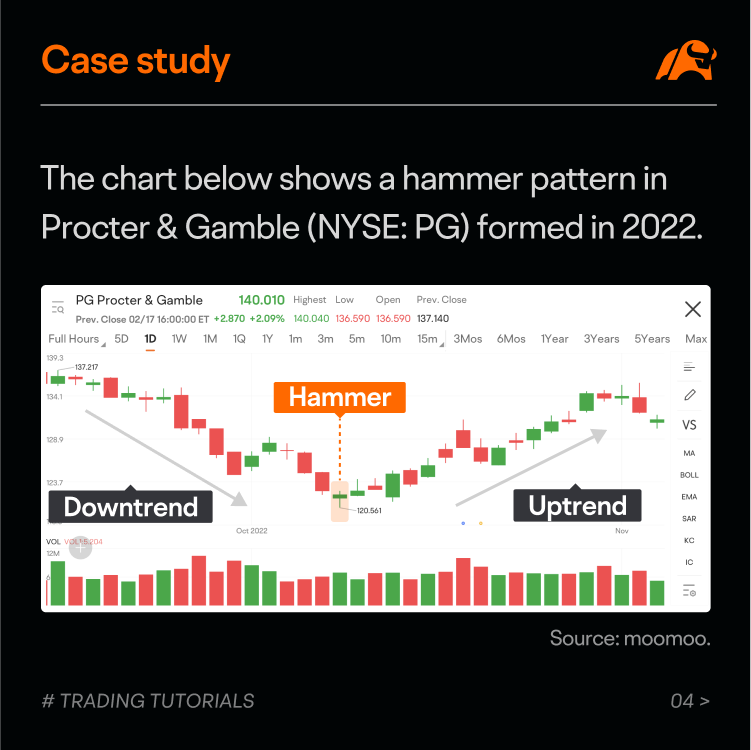
The chart below shows a hammer pattern in Procter & Gamble (NYSE: PG), formed in 2022.
As you can see, there is a clear downtrend before the hammer.
On the day the hammer was formed, the stock fell sharply at first, but the bulls absorbed selling pressure and pushed the closing price higher than the opening price, forming a candle with a short upper shadow, a long lower shadow, and a small real body. The lower shadow was more than twice the length of the real body.
Following the hammer, the price closed above the body on the next candle, providing the confirmation needed to complete the pattern.
After that, Procter & Gamble's stock moved higher in price.
Summary
The hammer candlestick is a useful tool for a trader to determine an entry point for a long trade.
However, the pattern will not always work, and sometimes it may fail.
Like all technical tools, investment decisions should not be solely based on a single indicator. The hammer should be used in concert with other signals and indicators.
If you have any questions, please feel free to leave them in the comment section. We're always happy to help!
This presentation is for informational and educational use only and is not a recommendation or endorsement of any particular investment or investment strategy. Investment information provided in this content is general in nature, strictly for illustrative purposes, and may not be appropriate for all investors. Read more