US market outlook: investors should be optimistic despite inflation
Key takeaways
- The US economy enters the second half of 2026 with positive growth, stable employment and continued capital spending, but the expansion is less uniform than headline data suggests.
- Inflation has moderated from its post-pandemic peak, but by May 2026 had returned to its highest in three years. We can blame services, housing, tariffs and energy for the stalled progress toward the Federal Reserve's 2% inflation goal.
- With benchmark rates at 3.5% to 3.75%, monetary policy is restrictive, but not uniformly effective: large cash-rich companies continue investing, while smaller firms, commercial real estate borrowers and lower-income households feel the pain of higher rates.
- Investors in the US market should no longer expect rapid rate cuts, but prioritise quality, diversification, balance-sheet strength and cash-flow durability in any companies or sectors they invest in.
- The US economy enters the second half of 2026 with positive growth, stable employment and continued capital spending, but the expansion is less uniform than headline data suggests.
- Inflation has moderated from its post-pandemic peak, but by May 2026 had returned to its highest in three years. We can blame services, housing, tariffs and energy for the stalled progress toward the Federal Reserve's 2% inflation goal.
- With benchmark rates at 3.5% to 3.75%, monetary policy is restrictive, but not uniformly effective: large cash-rich companies continue investing, while smaller firms, commercial real estate borrowers and lower-income households feel the pain of higher rates.
- Investors in the US market should no longer expect rapid rate cuts, but prioritise quality, diversification, balance-sheet strength and cash-flow durability in any companies or sectors they invest in.
Rates unlikely to fall, so be selective about your US stock choices
The US economy enters the second half of 2026 in a stronger position than many economists expected a year ago. Economic growth remains positive, unemployment remains relatively low, and large corporations continue to invest heavily in artificial intelligence infrastructure (including cloud computing and data-centre capacity). This momentum is all the more impressive given inflation has not fallen as quickly as policymakers hoped and interest rates remain restrictive.
While this economic strength means we cannot expect more rapid rate cuts in the US, it's also the case that inflation is not low enough to allow the Federal Reserve to declare victory. As a result, as we enter the second half of 2026, investors should prepare for moderate growth, persistent inflation and interest rates to stay higher, with increasing expectation they may rise this year.
In this environment, retail investors should focus less on economic headlines and more on company quality, cash-flow strength and portfolio diversification. The broad economy may continue to grow, but not all sectors will benefit equally.
And data support this middle-ground view. The Bureau of Economic Analysis reported real gross domestic product growth of 1.6% annualised in the first quarter of 2026, after 0.5% growth in the last three months of 2025, indicating slower but still positive activity.[1] The unemployment rate was 4.3% in May, according to Federal Reserve Economic Data based on the Bureau of Labor Statistics series.[2] At the same time, the headline personal consumption expenditure price index rose to 3.8% year-on-year in April and the core PCE reached 3.3% (still well above the Fed's target).[3]
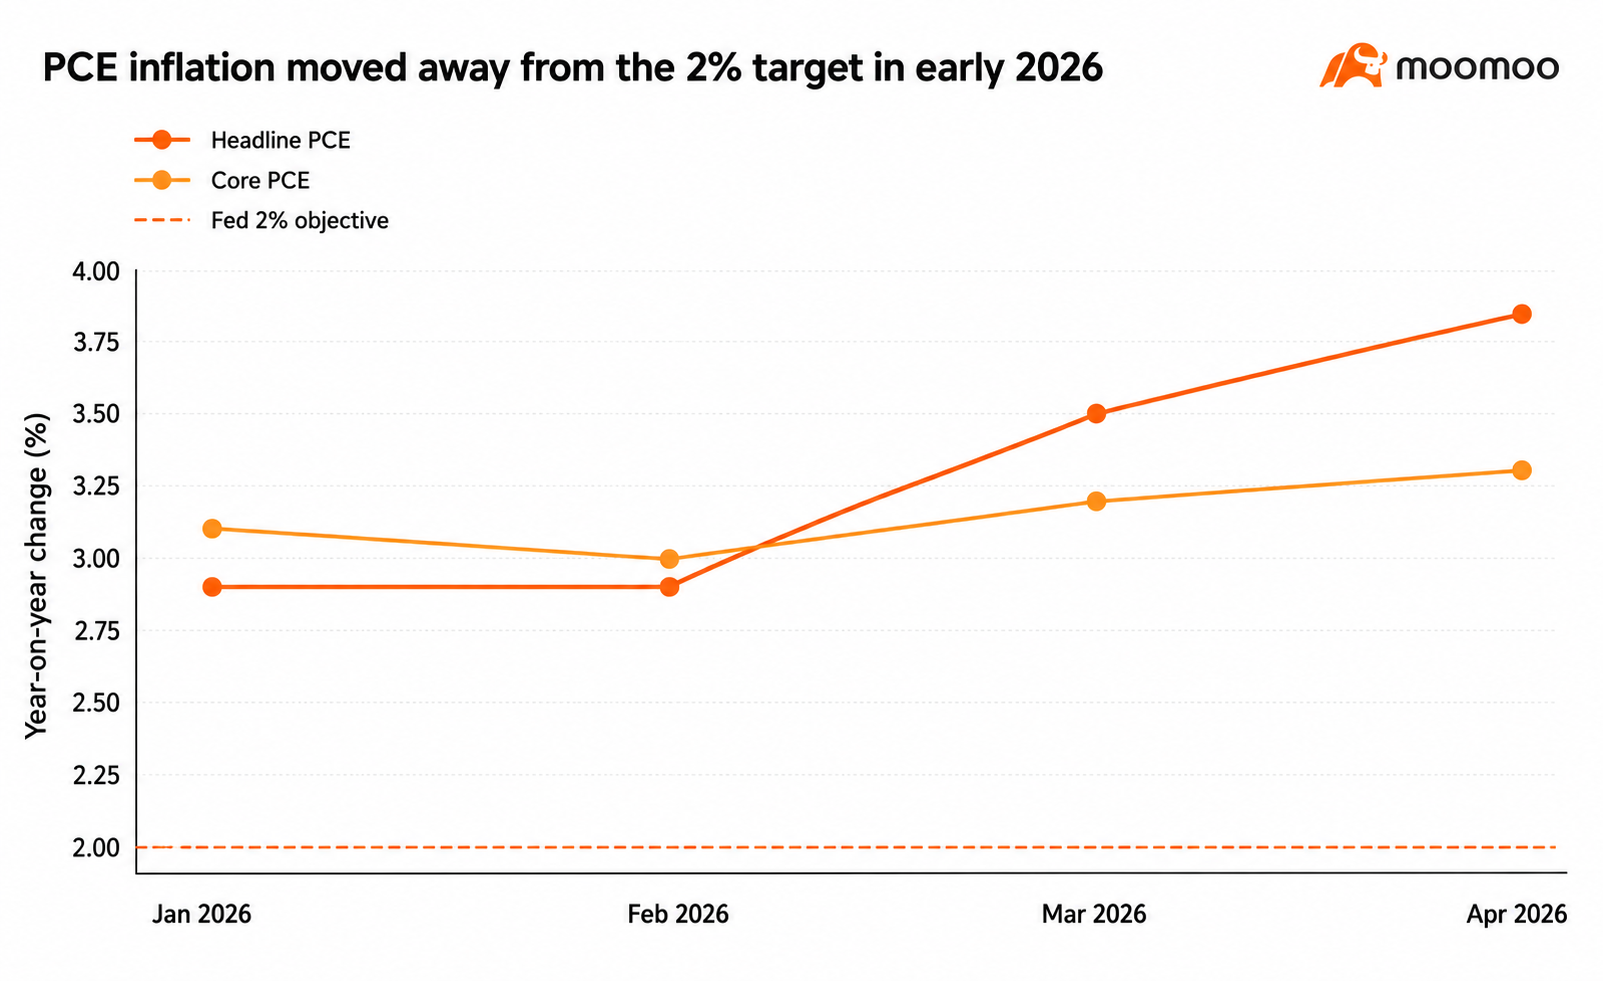
Figure 1. Headline and core PCE inflation, January to April 2026. Source: Bureau of Economic Analysis, Personal Consumption Expenditures price index releases.
Lower-income households are clearly finding it tougher
Consumer spending remains the foundation of the US economy. Recent retail sales and personal consumption data show Americans continue to spend. However, aggregate numbers tell only part of the story.
Higher-income households have benefited from the rising sharemarket, elevated savings yields and strong housing wealth. These households continue to spend on travel, entertainment, luxury goods and premium services. Their spending power has helped support overall US economic activity.
Lower and middle-income households face a different reality. For many, their excess savings accumulated during the pandemic have been depleted. Housing costs, insurance premiums, healthcare expenses and everyday living costs remain significantly higher than before the inflation surge of 2021-23. While wages have increased, many households feel income growth has not offset their higher living costs.
And we're seeing credit data point to increasing pressure on these households. Credit-card balances have risen and delinquency rates among lower-credit-quality borrowers have moved higher. These trends do not necessarily indicate a crisis, but they show some households are becoming more sensitive to interest rates and economic uncertainty.
For investors, the implication is important. Consumer spending may remain resilient overall, but companies serving different income groups could experience very different outcomes. Businesses targeting affluent consumers may continue to perform well, while firms relying on more financially stressed customers could face greater challenges.
In April, we saw US personal consumption expenditure rise 0.5%, a slowdown from March's 1% gain. In fact, real personal consumption expenditure rose only 0.1% in April, while real disposable personal income fell 0.5%.[4] This means households continued to spend but their real purchasing power weakened.
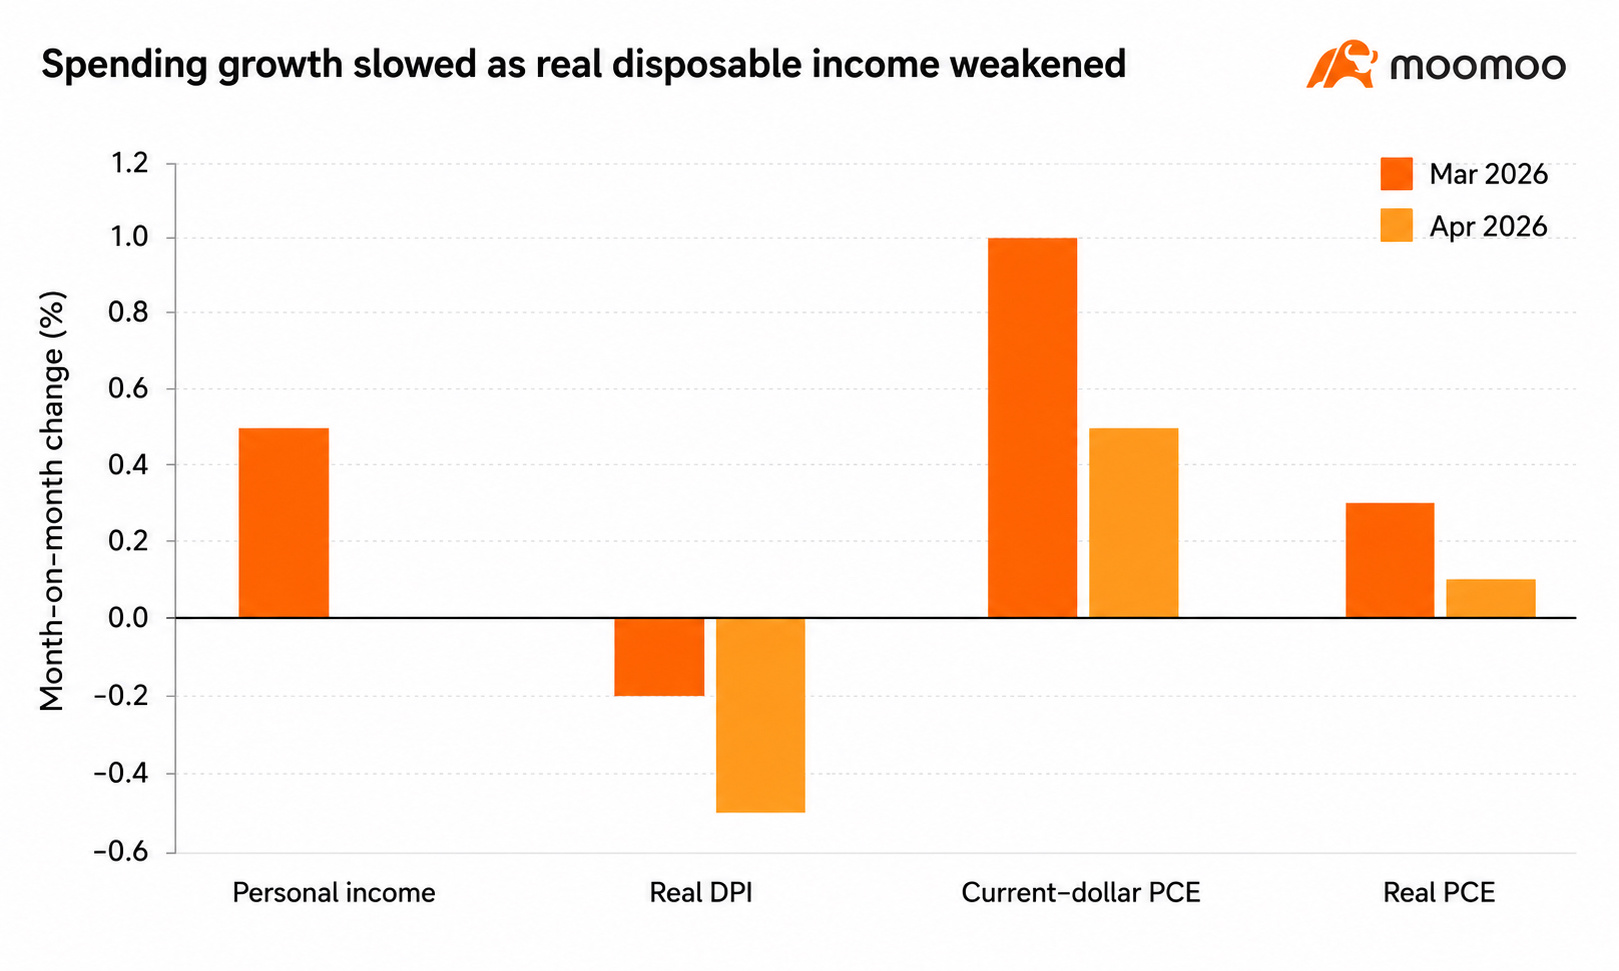
Figure 2. Consumer income and spending momentum, March-April 2026. Source: Bureau of Economic Analysis, Personal Income and Outlays, April 2026.
The credit backdrop is also more fragile than the aggregate spending number implies. The New York Fed reported total household debt of about US$18.78 trillion in the first three months of 2026. Mortgage debt remains the largest component at US$13.19 trillion, while auto loans and student loans each stood near US$1.7 trillion.[5] Student-loan stress is especially visible: the student-loan delinquency rate increased to 10.3% of balances 90 or more days delinquent in the first quarter, up from 9.6% in the last quarter of 2025.[6]
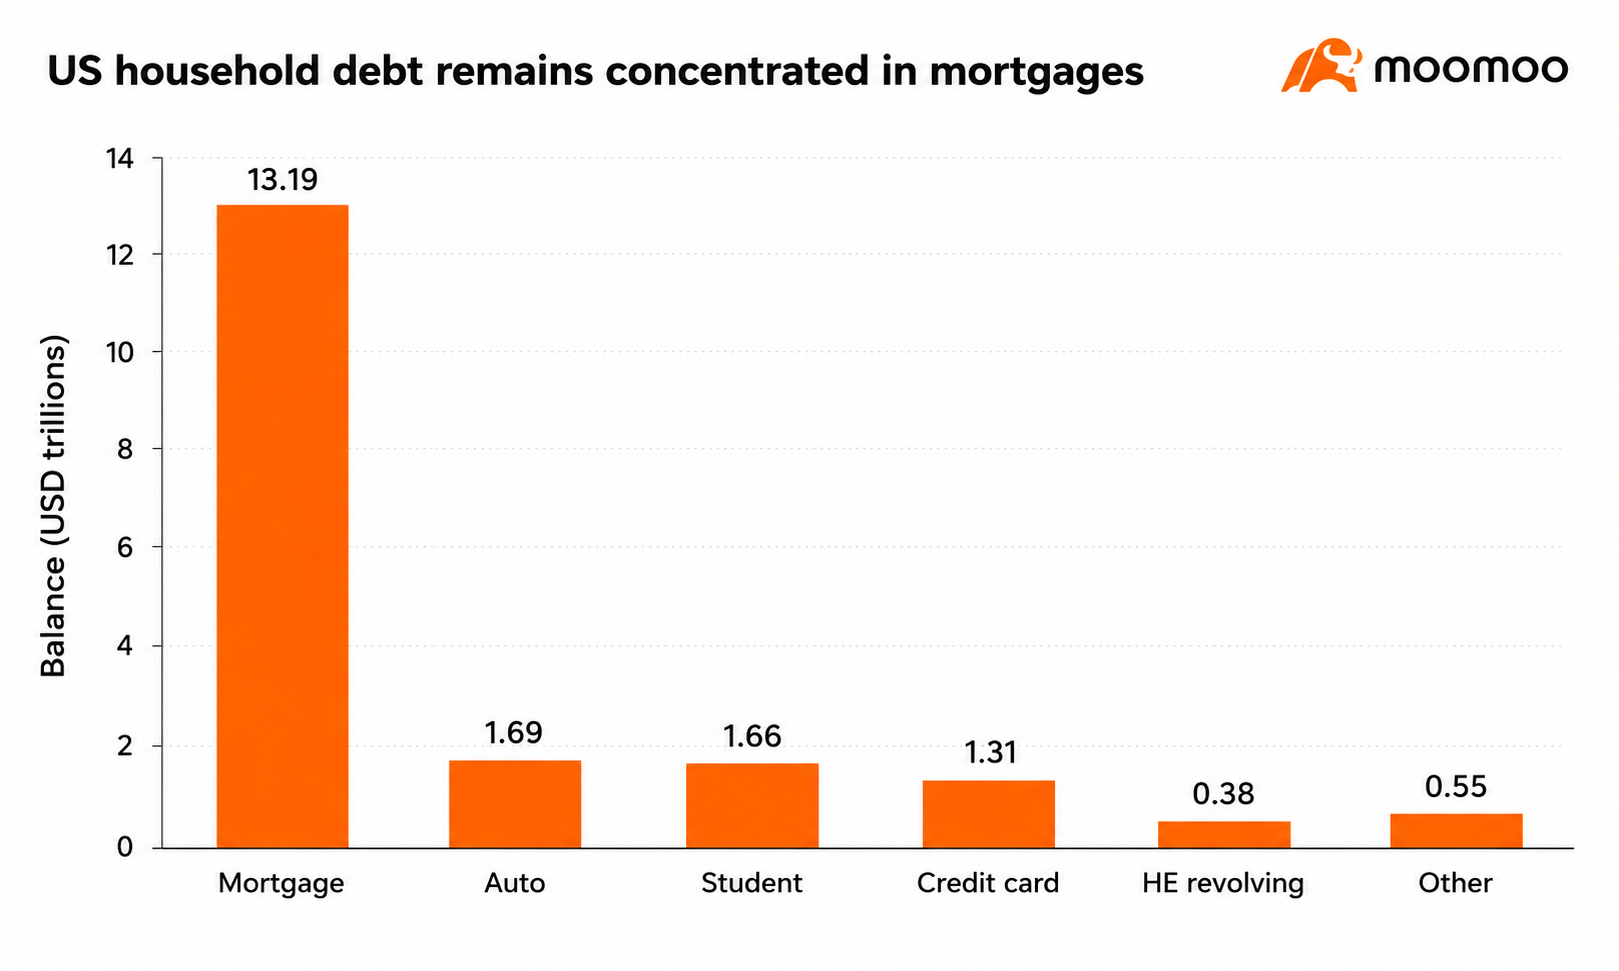
Figure 3. Household debt composition, Q1 2026. Source: Federal Reserve Bank of New York Household Debt and Credit Report. Credit card, HE revolving and other balances are rounded from reported composition shares.
Soaring petrol prices are keeping overall inflation higher
Inflation has declined significantly from its post-pandemic peak, yet progress toward the Federal Reserve's 2% target has slowed. And there's a few reasons for this.
First, prices for services are rising at an elevated pace. Unlike goods, the prices of services depend heavily on labour costs. Sectors such as healthcare, insurance, hospitality and personal services continue to experience wage pressure. As long as labour markets remain relatively healthy, services inflation may decline only gradually.
Second, housing-related costs continue to influence inflation measures. Although market rents have cooled in many regions, official inflation indicators often adjust with a lag. This means housing costs can continue affecting inflation statistics even after conditions have improved.
Third, global supply-side risks remain present – trade policies, tariffs, shipping disruptions and geopolitical tensions can all increase costs for businesses. Companies often absorb these costs initially, but eventually some of the burden is passed to consumers through higher prices.
Finally, energy markets remain a wildcard. Oil and fuel prices influence transportation, logistics and production costs across the economy. A significant energy shock, which we saw in recent months, quickly changes the inflation outlook.
While we should assume inflation is likely to move lower over time, the journey may be slower and less predictable than many investors expect.
The most recent price data underscores that point. Federal Reserve Economic Data shows the headline consumer price index was at 2.4% on an annualised basis, in January 2026. By May it was up to 4.2%. Why had it increased so substantially? That was made clear when we look at the energy index component, which was up 23.5%. (While the index excluding food and energy rose only 2.9% year-on-year.[8]) It shows that headline inflation pressure can move quickly when energy prices move.
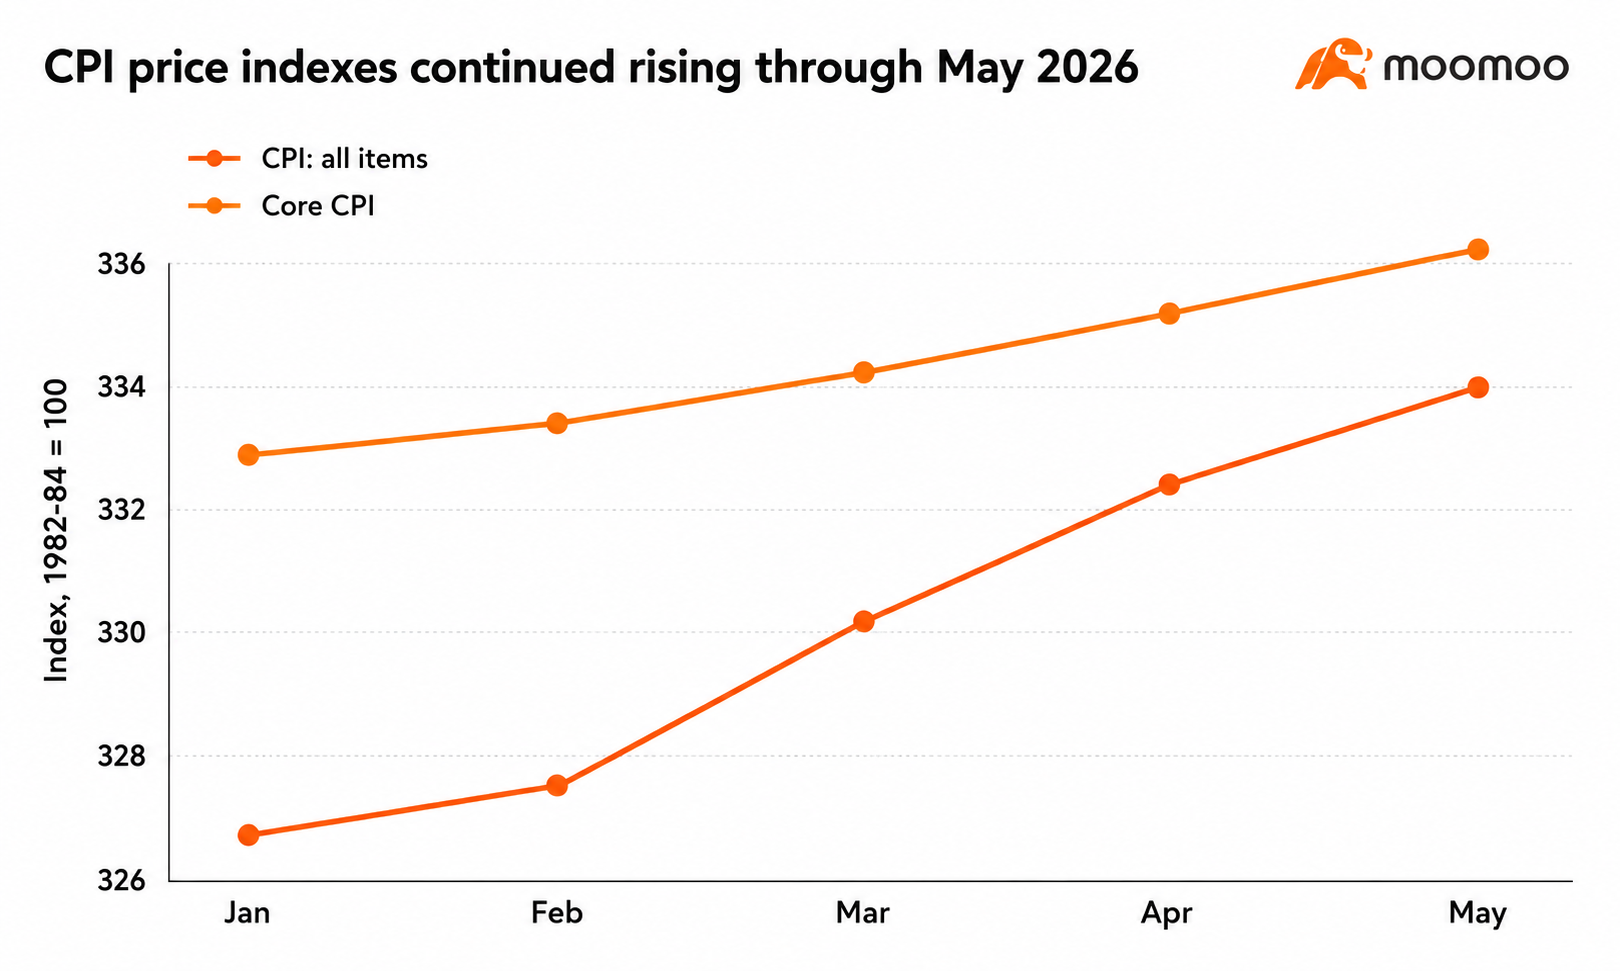
Figure 4. CPI and core CPI indexes, January-May 2026. Source: FRED, using BLS CPIAUCSL and CPILFESL series.
Not-so-hidden inflation forces: tariffs, supply chains and energy
Tariffs and supply-chain disruptions rarely appear in consumer prices all at once. Importers, wholesalers and retailers often absorb part of the shock through inventories, hedging contracts, supplier negotiations or temporarily lower margins. Over several quarters, however, those buffers tend to diminish. At that point, cost increases are passed into retail prices, especially in categories where businesses have pricing power or where substitutes are limited.
This is why a benign month of goods inflation should not automatically be interpreted as though inflation is under control there. A tariff can initially look like a corporate-margin problem before becoming a consumer-price problem. For retail investors, the difference is important. Companies with strong brands and pricing power may preserve margins, while lower-margin retailers and manufacturers may be forced to choose between accepting weaker profits or increasing prices.
Energy markets create a separate but related channel. The Energy Information Administration reported the Brent crude oil spot price averaged US$107 per barrel in May 2026 and forecast Brent around US$105 per barrel in June and July, while estimating that global oil reserves would fall by 6.3 million barrels per day in the three months to the end of June 2026.[9] Elevated oil prices hit airfares, freight rates, delivery costs, plastics, chemicals and some food-production expenses. Even where energy is excluded from core inflation, it can still affect services through wages and logistics costs.

US central bank has a delicate, difficult job in setting rates
The US Federal Reserve faces a difficult balancing act. Policymakers must control inflation without causing unnecessary economic weakness.
If inflation remains above target, aggressive rate cuts could risk reigniting price pressures. On the other hand, keeping rates high for too long could slow credit creation, business investment and consumer spending.
One challenge is that monetary policy does not affect all parts of the economy equally. Large technology companies with substantial cash reserves are less dependent on borrowing and can continue investing even when rates are high. Smaller businesses, commercial real estate borrowers and households carrying variable-rate debt are much more sensitive to financing costs.
Because of this uneven transmission mechanism, economic growth may continue even while some sectors experience considerable pressure.
Our base case is that the Federal Reserve maintains a cautious approach through the remainder of 2026. Rate changes may occur, but they are likely to be gradual rather than aggressive. Any investor who expected a rapid return to near-zero rates is very likely to be disappointed.
This view is consistent with the recent policy and market backdrop. Federal Reserve Economic data shows the effective federal funds rate near 3.63%-3.64% from January through to May 2026, while the federal funds target-range upper limit stood at 3.75% in mid-June.[10] And of course, at its June rate-setting meeting, the Federal Reserve did not change rates, though almost half of the committee members expect to increase them this year.
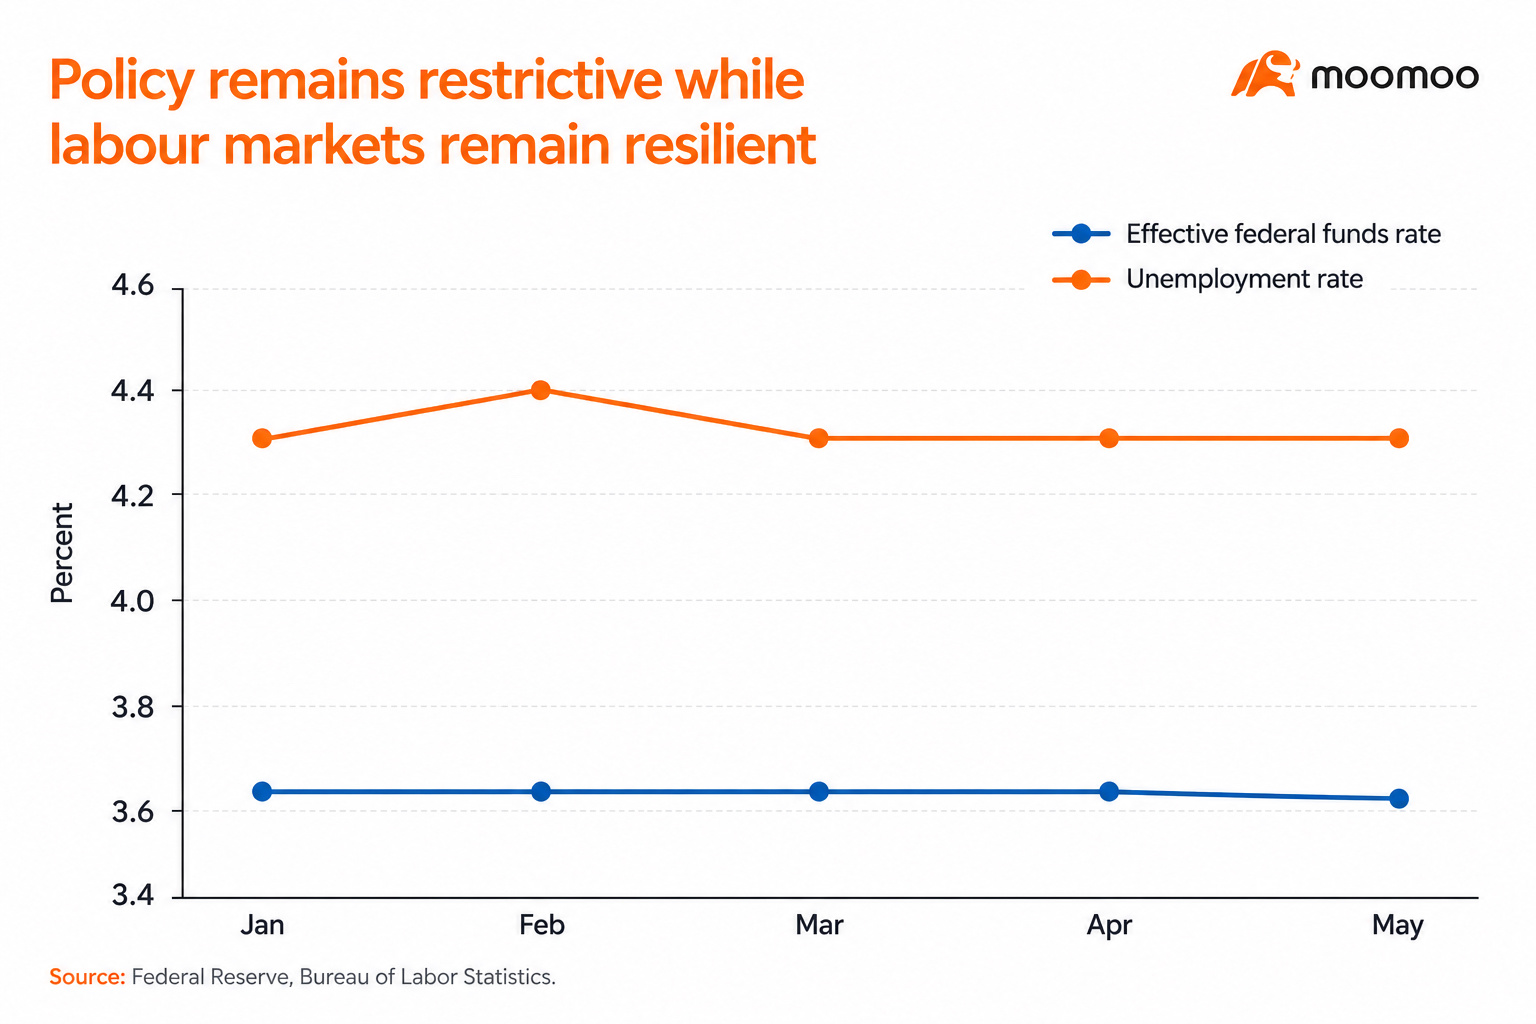
Figure 5. Effective federal funds rate and unemployment rate, January-May 2026. Source: FRED, Federal Reserve/BLS series.
There's plenty of reason to be optimistic about the US market
Several risks could materially alter the outlook for the US market. These include a major geopolitical event, a sharp rise in energy prices, unexpected labour-market deterioration, fiscal policy uncertainty or financial stress within commercial real estate or regional banking systems.
Despite these risks, the most likely outcome remains one of moderate economic expansion rather than recession. The US economy continues to benefit from innovation, strong corporate profitability and relatively healthy household balance sheets at the upper end of income distribution.
For retail investors, the central lesson is straightforward: avoid making investment decisions based solely on expectations of rapid interest-rate cuts. Instead, focus on portfolio quality, diversification and long-term fundamentals. Economic conditions may remain uneven, but disciplined investing remains the most reliable strategy for navigating uncertainty.
Three possible outcomes for the US economy as 2026 rolls on
Base case (55% probability): Economic growth remains positive but below long-term averages. Inflation gradually moderates toward 3%. Interest rates decline only modestly. Equity markets generate positive but more moderate returns than in recent years.
Bull case (20% probability): Productivity gains from artificial intelligence investment accelerate economic growth while inflation falls more quickly than expected. The Federal Reserve gains flexibility to reduce rates, supporting both equities and fixed income.
Bear Case (25% probability): Inflation remains stubbornly high due to energy prices, services inflation or supply disruptions. The Federal Reserve delays easing, financial conditions tighten further and economic growth slows significantly.
Scenario | Probability | Growth | Inflation | Fed policy |
Base | 55% | 1.5%-2.0% | 2.8%-3.2% | Limited easing |
Bull | 20% | >2.5% | <2.5% | Faster cuts |
Bear | 25% | <1.0% | >3.5% | Higher for longer |
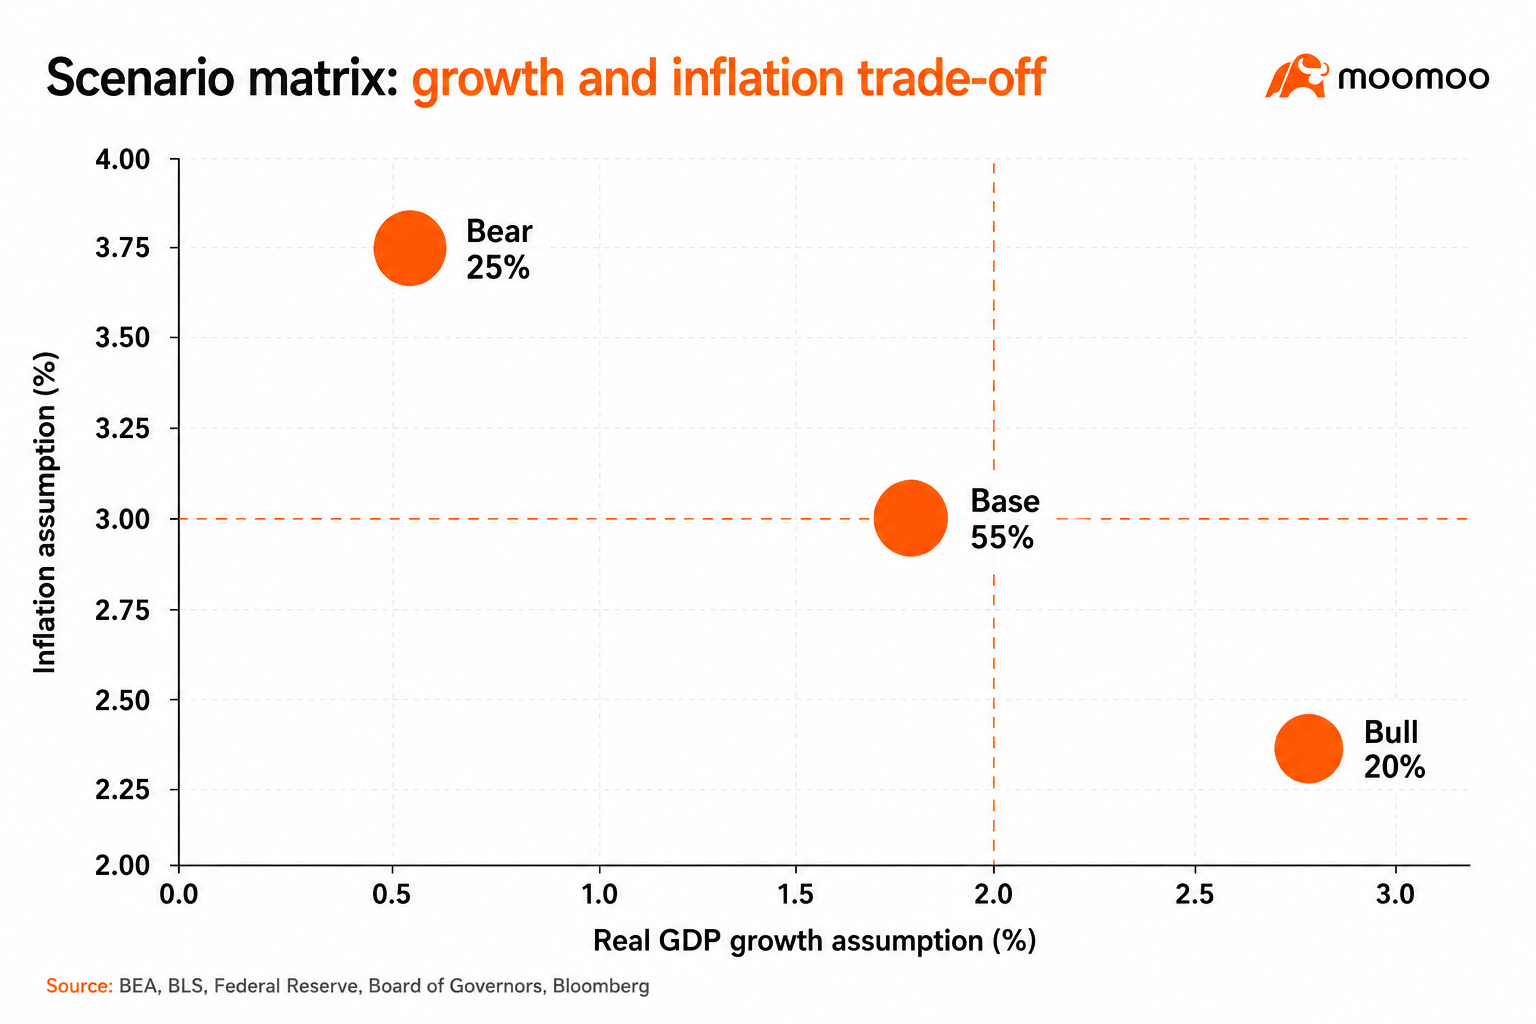
Figure 6. Scenario matrix. Source: Assumptions based on public macroeconomic indicators cited in this research.
Alternative view: why the soft-landing case could still work
A more optimistic interpretation should not be dismissed. The US economy has repeatedly absorbed shocks better than expected since 2020. Household balance sheets, although uneven, are not uniformly weak. Labour markets remain resilient, and corporate profits remain strong in several sectors. If energy prices decline, businesses limit passing on their tariff costs and productivity gains from AI investment accelerate, inflation could fall without a material deterioration in US employment.
Under that scenario, the Federal Reserve would gain more flexibility to reduce rates gradually while preserving expansion. Equities could continue to perform well, especially if earnings growth broadens beyond the largest technology companies. The caveat is, current inflation and credit data leave less margin for policy error than investors enjoyed during the low-inflation period after the global financial crisis.
Methodology
Sources referenced for this research include the Federal Reserve, Federal Reserve Bank of New York, Bureau of Labor Statistics (BLS), Bureau of Economic Analysis (BEA), Energy Information Administration (EIA), Congressional Budget Office (CBO), IMF research publications and Federal Reserve Economic Data (FRED).
This research combines public macroeconomic data with qualitative investment analysis. The main quantitative inputs are BEA GDP and personal income data, BEA PCE inflation data, BLS CPI and employment data accessed through FRED where available, New York Fed Household Debt and Credit Report data, EIA energy market data and CME FedWatch market-implied policy expectations. Scenario probabilities are subjective assessments designed to frame risk rather than point forecasts.
Data were selected from the latest available releases as of mid-June 2026. Some charts combine monthly observations with the most recent official release dates. Where a data series was not directly comparable across sources, the chart caption states the source and unit. Figures should therefore be read as research illustrations based on official data inputs rather than as a full econometric forecast model.
Footnotes
[1] Bureau of Economic Analysis, GDP Second Estimate and Corporate Profits, Q1 2026; FRED real GDP growth series A191RL1Q225SBEA.
[2] FRED unemployment rate series UNRATE, May 2026.
[3] Bureau of Economic Analysis, Personal Consumption Expenditures Price Index and Core PCE Price Index, April 2026.
[4] Bureau of Economic Analysis, Personal Income and Outlays, April 2026.
[5] Federal Reserve Bank of New York, Quarterly Report on Household Debt and Credit, 2026Q1.
[6] Federal Reserve Bank of New York, Household Debt and Credit Report, student loan delinquency data, 2026Q1.
[7] FRED CPIAUCSL and CPILFESL series, January-May 2026.
[8] Bureau of Labor Statistics, Consumer Price Index Summary, May 2026.
[9] U.S. Energy Information Administration, Short-Term Energy Outlook, Global Oil Markets, June 2026.
[10] FRED FEDFUNDS and DFEDTARU series.
[11] CME FedWatch, market-implied federal funds target probabilities, June 2026.
References
Bureau of Economic Analysis. (2026). GDP (Second Estimate) and Corporate Profits, 1st Quarter 2026.
Bureau of Economic Analysis. (2026). Personal Income and Outlays, April 2026.
Bureau of Economic Analysis. (2026). Personal Consumption Expenditures Price Index.
Bureau of Labor Statistics. (2026). Consumer Price Index Summary, May 2026.
Federal Reserve Bank of New York. (2026). Quarterly Report on Household Debt and Credit, 2026Q1.
Federal Reserve Bank of St. Louis FRED. (2026). CPIAUCSL, CPILFESL, FEDFUNDS, UNRATE and related series.
U.S. Energy Information Administration. (2026). Short-Term Energy Outlook: Global Oil Markets.
CME Group. (2026). CME FedWatch Tool.
Congressional Budget Office. (2026). The Budget and Economic Outlook: 2026 to 2036.
International Monetary Fund. (2025-2026). Research publications on tariff pass-through and inflation dynamics.
Appendix: source data used in charts
Data point | Jan 2026 | Feb 2026 | Mar 2026 | Apr 2026 | May 2026 |
Headline PCE YoY | 2.9% | 2.9% | 3.5% | 3.8% | n/a |
Core PCE YoY | 3.1% | 3.0% | 3.2% | 3.3% | n/a |
CPI index | 326.588 | 327.460 | 330.293 | 332.407 | 333.979 |
Core CPI index | 332.793 | 333.512 | 334.165 | 335.423 | 336.121 |
Fed funds rate | 3.64% | 3.64% | 3.64% | 3.64% | 3.63% |
This presentation is for informational and educational use only and is not a recommendation or endorsement of any particular investment or investment strategy. Investment information provided in this content is general in nature, strictly for illustrative purposes, and may not be appropriate for all investors. Read more