2026 Investment Outlook for Major Assets

Executive summary: 2026 marks a shift from liquidity-driven returns to more selective allocation. As global growth slows but remains resilient, asset performance is increasingly shaped by rate differentials, policy shifts and earnings durability rather than broad liquidity support. The US dollar remains under pressure as interest rate gaps narrow, though relatively stronger US growth and AI-led productivity gains may limit further downside. In equities, stretched valuations and fading liquidity favour a more selective approach, with stable cash flows, earnings certainty and a barbell exposure to leading AI beneficiaries and defensive sectors. In fixed income, conditions favour the front end of the US Treasury curve, while precious metals remain supported, with gold underpinned by structural drivers and silver retaining higher beta due to tight supply and industrial demand.
In 2025, global asset markets were defined by a retreating dollar, an about turn in interest rates, a surge in gold, and a bull market in momentum stocks.
By December 10, the U.S. Dollar Index had fallen more than 9%, contrary to market projections prior to Trump taking office. After nearly nine months on hold, the Federal Reserve restarted its easing cycle in September. The U.S. 10-year Treasury yield rose from 4.57% at the start of the year to about 4.8% before retreating in waves, now holding near 4.2%. U.S. equities are exhibiting pronounced structural divergence, even as abundant liquidity continues to support broader market conditions. Gold hit all-time highs.
Heading into 2026, the global economy is entering a critical phase of slower growth but retained resilience. Investors should be alert to rising unemployment and other long-tail black-swan risks across asset classes.
U.S. Dollar Index: Narrower U.S.-Europe and U.S.-Japan rate gaps may pressure the dollar
The dollar’s slide in 2025 stemmed from the triple shock of Fed rate cuts, debt risks, and de-dollarization. In 2026, debt risks may ease at the margin, but the U.S.-Japan rate differential becomes a new variable. According to Bloomberg statistics, the market consensus is for two Fed rate cuts in 2026, bringing the federal funds rate down to 3.0%–3.25%, while Japan is expected to hike twice. Beyond Japan, Canada and Australia may also enter hiking cycles. Australia’s policy rate could overtake the U.S. federal funds rate. U.S.-Europe, U.S.-Japan, and U.S.-Canada rate differentials are set to narrow significantly. See the chart below for the projected global interest rates:
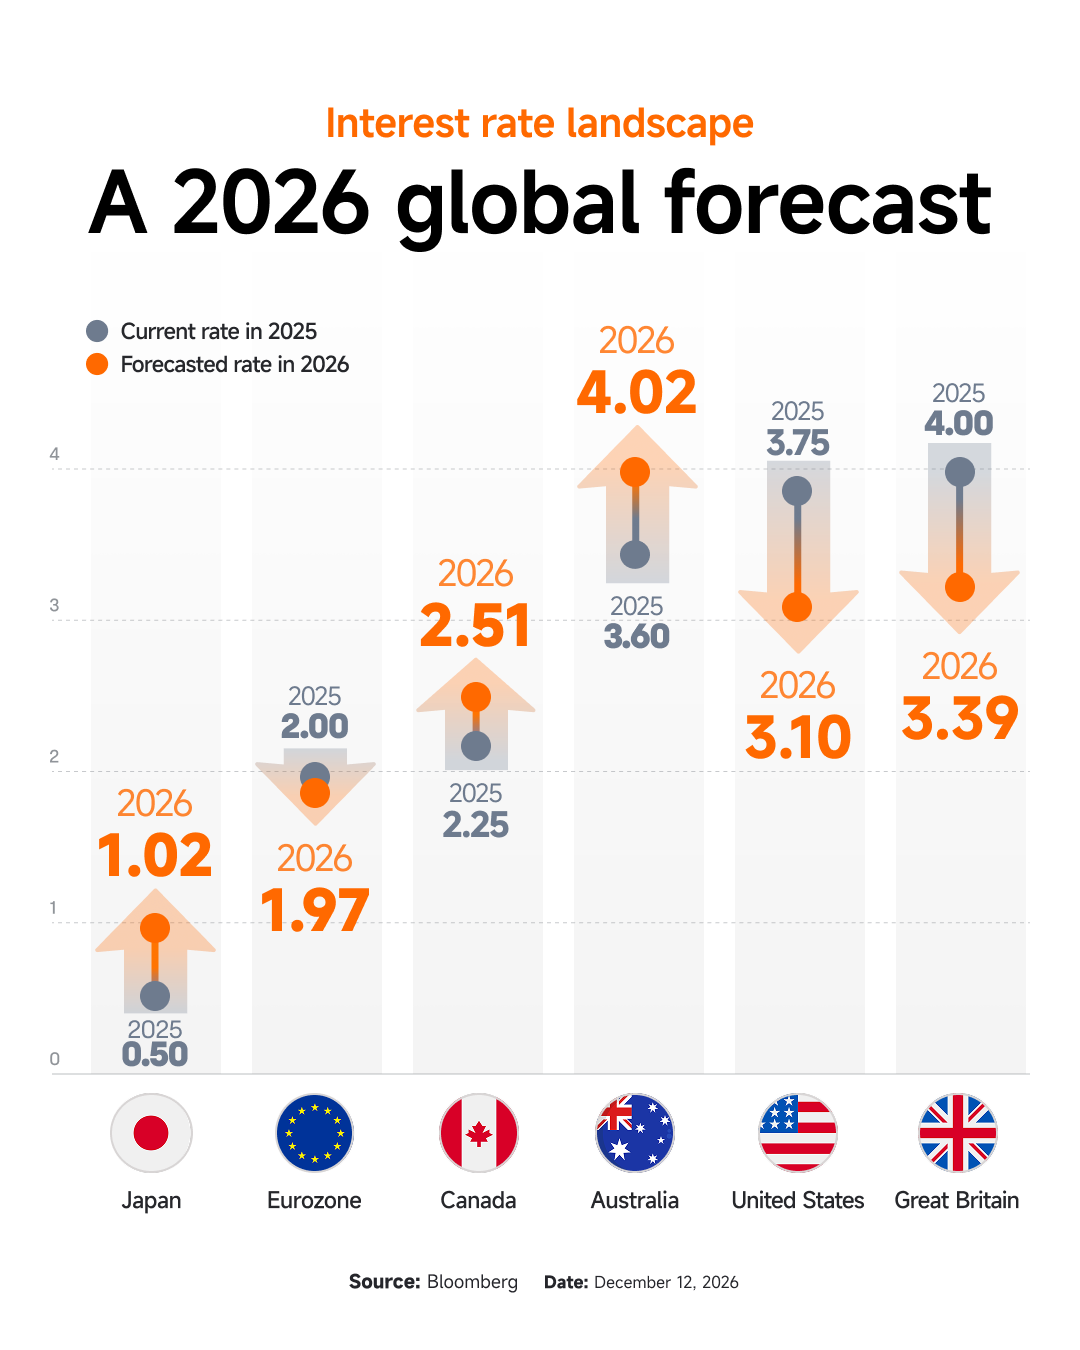
If the dollar continues to weaken, overseas investors in U.S. stocks will effectively see higher holding costs, reducing the appeal of non-core assets within U.S. equities. Fortunately, according to the IMF, the US GDP growth rate is expected to remain stable at around 2%, which is still higher than that of the Eurozone and Japan. Although global de-dollarization continues, central bank gold buying and non-dollar settlement are largely gradual substitutions. If the U.S. achieves a soft landing, the Dollar Index may not repeat the magnitude of its 2025 decline, and the AI industry’s dividends should provide a floor of support for the dollar.
U.S. stocks: saying goodbye to excess liquidity
In moomoo’s 2025 Annual Outlook last year, we anticipated flows would favor small and mid caps in 2025. A year on, 2025 indeed proved a breakout year for momentum names. Sectors such as nuclear energy, space stocks, quantum computing, and crypto stocks, which require a long-term investment horizon, have seen successive price increases, with valuation expansion outpacing earnings growth in U.S. equities.
However, by late 2025, pullbacks in these names signaled early signs of liquidity ebbing, and small/mid caps face overvaluation risks. With midterms approaching, both parties may roll out pro-growth policies and marginally ease regulatory pressure on tech megacaps.

Contrary to last year’s moomoo outlook, we suggest that in 2026 investors refocus on companies with stable cash flows, the highest value certainty, and the ability to deliver results quickly, and adopt a barbell allocation strategy: concentrate on leading, less-cyclical AI names and defensive sectors.
Trump’s “Made in America” agenda will deeply reshape the geographic distribution of tech profits. U.S. high-tech firms benefiting from semiconductor reshoring are likely to continue riding the wave of data-center buildouts and chip manufacturing, supporting a structural market in U.S. equities. Meanwhile, defensive sectors such as consumer staples and healthcare are less exposed to the cycle and offer greater earnings stability.
Risk Warning: If corporate earnings growth undershoots expectations and triggers a de-rating, or if the lagged pass-through of tariff policy to inflation disrupts the Fed’s easing cadence, U.S. stocks could suffer a volatile drawdown.
U.S. Treasuries: short-term bonds may see a larger drop in yields
As the U.S. inventory restocking cycle enters its latter half, markets may reprice recession risk, pointing to a bull steepening in the curve—short-maturity yields falling more than long-maturity yields, widening term spreads. Short-end yields are more sensitive because they are directly driven by Fed easing expectations, while core inflation is expected to hover around 2.5%, above the Fed’s 2% target, supporting the long end.
According to the latest official budget baseline from the Congressional Budget Office (CBO), the U.S. federal deficit in FY2026 is projected at $1.713 trillion, about $87 billion (4.8%) lower than the actual $1.8 trillion deficit in FY2025; it is also around $187 billion (9.8%) lower than the CBO’s January 2025 projection of a $1.9 trillion deficit for FY2025. A smaller deficit implies lighter Treasury supply pressure in 2026. In addition, as the 2026 midterms approach, both parties may pause aggressive fiscal expansion, marginally easing issuance pressure and downward pressure on Treasuries versus 2025.
Beyond these factors, the Federal Reserve’s Reserve Management Purchases (RMP) announced at the December FOMC meeting could also help push Treasury yields lower.
Precious metals: silver’s beta remains higher than gold's
Gold rose from $2,624.4/oz at the end of 2024 to around $4,200 currently, a gain of more than 60%; silver prices doubled in 2025. The support framework for precious metals in 2026 has not materially changed—weak dollar, falling rates, and central bank gold purchases—but prior gains have front-loaded some of the upside.
Gold’s price remains strongly inversely correlated with real yields, its core driver. Gold purchases by emerging-market central banks continue to underpin demand, as shown by the World Gold Council. Under recession expectations, retail allocations to gold ETFs should rise alongside heightened risk aversion.
Wall Street street sign in New York City with American flags in the background, symbolising U.S. financial markets, equities, and global investing.
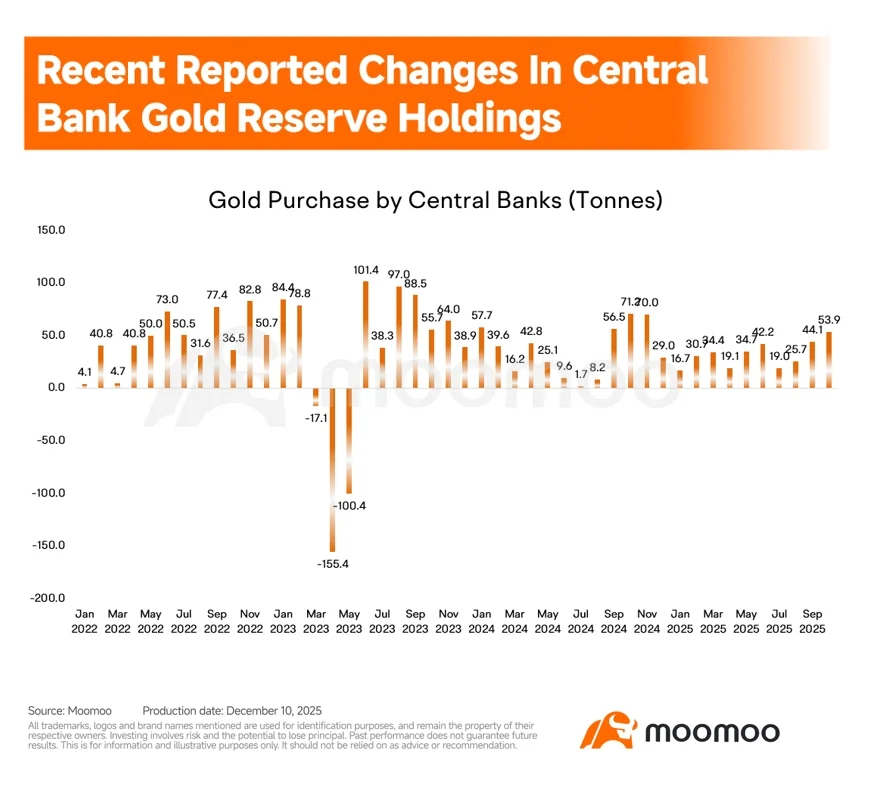
Silver, with its industrial character and key role as a photovoltaic input, exhibits greater beta. Signs of recovery in the solar PV industry in 2025 are likely to extend into 2026. Global silver inventories are low, and supply tightness has not meaningfully eased. Its price beta may remain higher than gold’s.
This information is general in nature and has been prepared without considering your financial objectives, situation or needs. Consider the appropriateness of this information in light of your personal circumstances before making investment decisions.
This presentation is for informational and educational use only and is not a recommendation or endorsement of any particular investment or investment strategy. Investment information provided in this content is general in nature, strictly for illustrative purposes, and may not be appropriate for all investors. Read more