Comparing all-in-one equity ETFs for Canadian investors
There are various types of ETFs, with all-in-one ETFs being some of the most popular.
If you don't want to put all your eggs in one basket, all-in-one ETFs are a good choice because they invest in different assets and provide exposure to multiple markets.
In this article, we'll analyze and compare some of the top all-in-one ETFs available to Canadian investors.
What is all-in-one ETFs
Known as "funds of funds", all-in-one ETFs typically include four to eight underlying ETFs, pooling stocks and bonds worldwide into one simple, automatically rebalancing investment solution.
There are three main types of all-in-one ETFs:
1. Equity All-in-One ETFs: These are ideal for investors seeking long-term capital growth. They usually allocate more to equities and invest less in bonds, offering exposure to a wide range of Canadian and global stocks.
2. Balanced All-in-One ETFs: These ETFs strike a balance between risk and reward by investing in both equities and fixed-income securities. They aim to provide a mix of capital appreciation and income, making them suitable for investors with moderate risk tolerance.
3. Conservative All-in-One ETFs: These focus on preserving capital and generating income. They typically have a higher allocation to bonds and a smaller allocation to equities, offering diversified exposure to global bonds and stocks with an emphasis on Canadian fixed-income securities.
Today, we’ll examine the equity version, which is suitable for investors with a higher risk tolerance.
Among the many options available, the most popular ones are the Vanguard All-Equity ETF Portfolio (TSX: $VANGUARD INVESTMENTS CANADA INC VANGUARD ALL EQUITY ETF (VEQT.CA)$ ), iShares Core Equity ETF Portfolio (TSX: $ISHARES CORE EQUITY ETF PORTFOLIO UNITS CAD (XEQT.CA)$ ), and BMO All-Equity ETF (TSX: $BMO ALL EQUITY ETF UNIT CAD (ZEQT.CA)$ ).
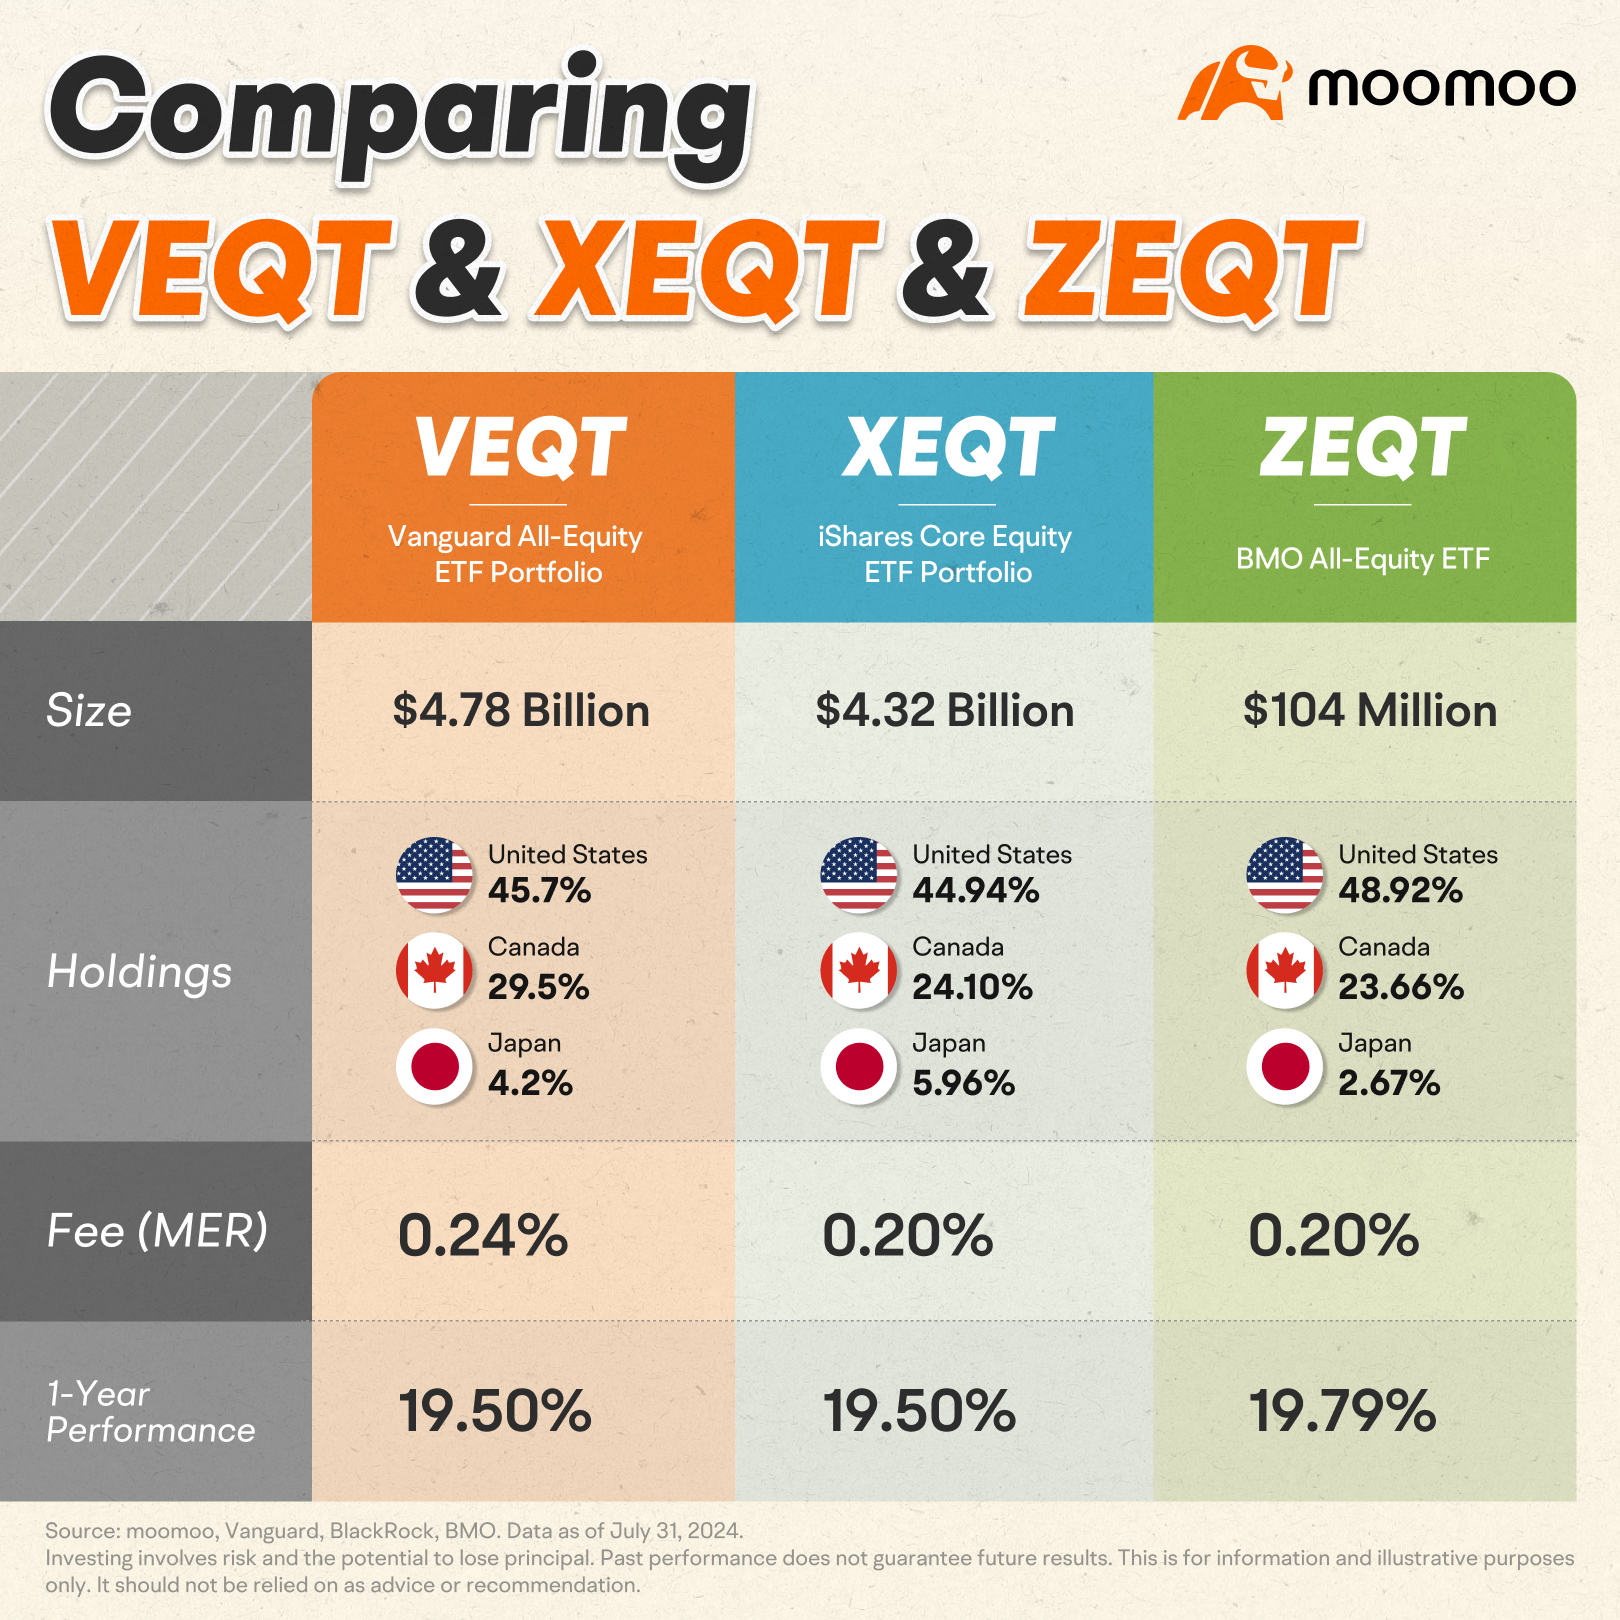
Let's compare these three ETFs based on size, holdings, fees, and history performance, so you can make a more informed investment decision.
Popular all-in-one ETFs For Canadian investors
VEQT, XEQT, and ZEQT are all listed on the Toronto Stock Exchange and are traded in CAD.
1. Vanguard All-Equity ETF Portfolio (VEQT)
The Vanguard All-Equity ETF Portfolio (VEQT) is a popular all-in-one ETF, managing $4.78 billion CAD in assets, making it one of the largest funds in Canada.
VEQT offers exposure to around 13,490 stocks from domestic and international markets. However, it consists of just four underlying Vanguard ETFs, each targeting different global market segments, including the U.S., Canadian, and international markets.
About 75% of its assets are allocated to North America, with 45.7% in the United States and 29.5% in Canada, while the remaining holdings are primarily in markets like Japan and Europe.
With a management expense ratio of 0.24%, investors pay $2.4 for every $1,000 invested annually.
Over the past year, VEQT has achieved a total return of 19.12%, outperforming the Canadian stock market.
Key Facts:
Size: $4.78 billion CAD
Holdings: 13,490 stocks
Exposure Breakdowns: United States (45.7%), Canada (29.5%), Japan (4.2%)
Fee: 0.24% MER
1 year performance: 19.5%
Source: moomoo, Vanguard. Data as of July 31, 2024.
2. iShares Core Equity ETF Portfolio (XEQT)
The iShares Core Equity ETF Portfolio (XEQT) is an all-in-one ETF managing nearly $4.32 billion CAD in assets. XEQT targets different global market segments, including the U.S., Canadian, and international markets, investing in approximately 8,950 stocks.
XEQT has slightly less exposure in North America than VEQT, with about 70% of its assets allocated to this region. Specifically, 44.94% of its assets are in the United States and 24.10% in Canada, while the remaining holdings are primarily in developed markets such as Japan and Europe.
XEQT has a lower management expense ratio (MER) than VEQT, at 0.2%, meaning investors pay $2 for every $1,000 invested annually. Over the past year, XEQT has delivered a total return of 19.5%, similar to VEQT's performance.
Key Facts:
Size: $4.32 billion CAD
Holdings: 8945 stocks
Exposure Breakdowns: United States (44.94%), Canada (24.10%), Japan (5.96%)
Fee: 0.20% MER
1 year performance: 19.50%
Source: moomoo, BlackRock. Data as of July 31, 2024.
3. BMO All-Equity ETF (ZEQT)
ZEQT is an emerging all-equity option in Canada. It manages around $104 million in assets, making it smaller than XEQT and VEQT.
ZEQT offers investors well-rounded exposure to both domestic and international equities through six underlying BMO ETFs. This includes ETFs tracking the S&P 500, mid-caps, and small caps, offering comprehensive U.S. market coverage alongside global exposure.
Allocations are similar to other all-equity ETFs, ensuring broad global market coverage. About 72.58% of its assets are allocated to North America, with 48.92% in the United States and 23.66% in Canada. The remaining holdings are primarily in Europe.
With a competitive management expense ratio (MER) of 0.20%, investors pay $2 for every $1,000 invested annually. Over the past year, ZEQT has delivered a total return of 19.79%, slightly higher than both XEQT and VEQT.
Key Facts:
Size: $104 million CAD
Exposure Breakdowns: United States (48.92%), Canada (23.66%), United Kingdom(2.67%)
Fee: 0.20% MER
1 year performance: 19.79%
Source: moomoo, BMO. Data as of July 31, 2024.
Comparison summary
The choice between VEQT, XEQT, and ZEQT will largely depend on personal preferences for brand, historical performance, and fee structure. All three are solid choices for investors seeking a diversified, all-equity portfolio.
Size: VEQT and XEQT are more established with larger asset sizes, while ZEQT is newer but growing.
Holdings: All three ETFs offer similar diversification across Canada, the US, and other developed and emerging markets.
Fee: XEQT and ZEQT have lower MERs (around 0.20%) than VEQT (0.24%).
Historical Performance: VEQT and XEQT have longer track records, while ZEQT is still establishing its history.
This presentation is for informational and educational use only and is not a recommendation or endorsement of any particular investment or investment strategy. Investment information provided in this content is general in nature, strictly for illustrative purposes, and may not be appropriate for all investors. Read more