

Moomoo Insights
Jul 16 15:38
TSMC Earnings: AI Demand Is Stronger Than the Chip Selloff Suggests
Moomoo Insights
Sep 30 05:04
Live Take | Anthropic’s $518B Compute Bet: Who Wins From the AI Buildout?
The rate of change (ROC) is a momentum indicator that measures the percentage change in a security's price.
In general, the ROC shows whether the price is rising or falling, and the movement of the ROC indicates the price trend.
ROC signals include centerline crossovers, as well as overbought-oversold and divergence readings.
The ROC is a momentum oscillator that measures the percentage change between the current closing price and the previous closing price over a certain period of days.
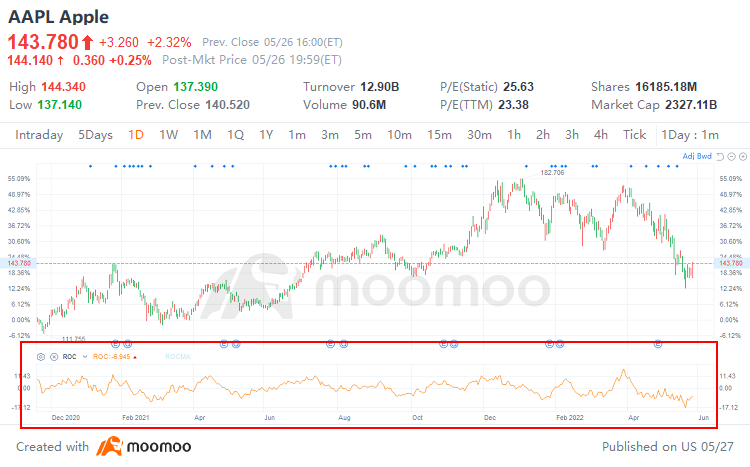
(Images provided are not current and any securities are shown for illustrative purposes only.)
For example, the closing price of $Apple (AAPL.US)$ was $143.11 on May 23, 2022, and $156.54 on May 05, 2022, then the 12-day ROC is -8.579, calculated as [(143.11-156.54)/156.54]*100.
This formula can be expressed as:
Trend Identification
As a momentum-based price indicator, the ROC measures the trend and strength of price changes.
In general, prices are rising as long as the ROC remains positive. Conversely, prices are falling when the ROC is negative.
Furthermore, a rising ROC above zero shows that the speed of the uptrend is accelerating, while a falling ROC above zero indicates that the speed of the uptrend is slowing down.
There is no upward boundary on the ROC but there is a downward limit because the price has a maximum decline of 100%.
The ROC crossing the zero line in either direction may indicate a trend change. However, ROC can easily hover around the zero line. Therefore, this signal mainly alerts the trader that the price may be trending instead of providing a trading signal.
Overbought or Oversold Signal
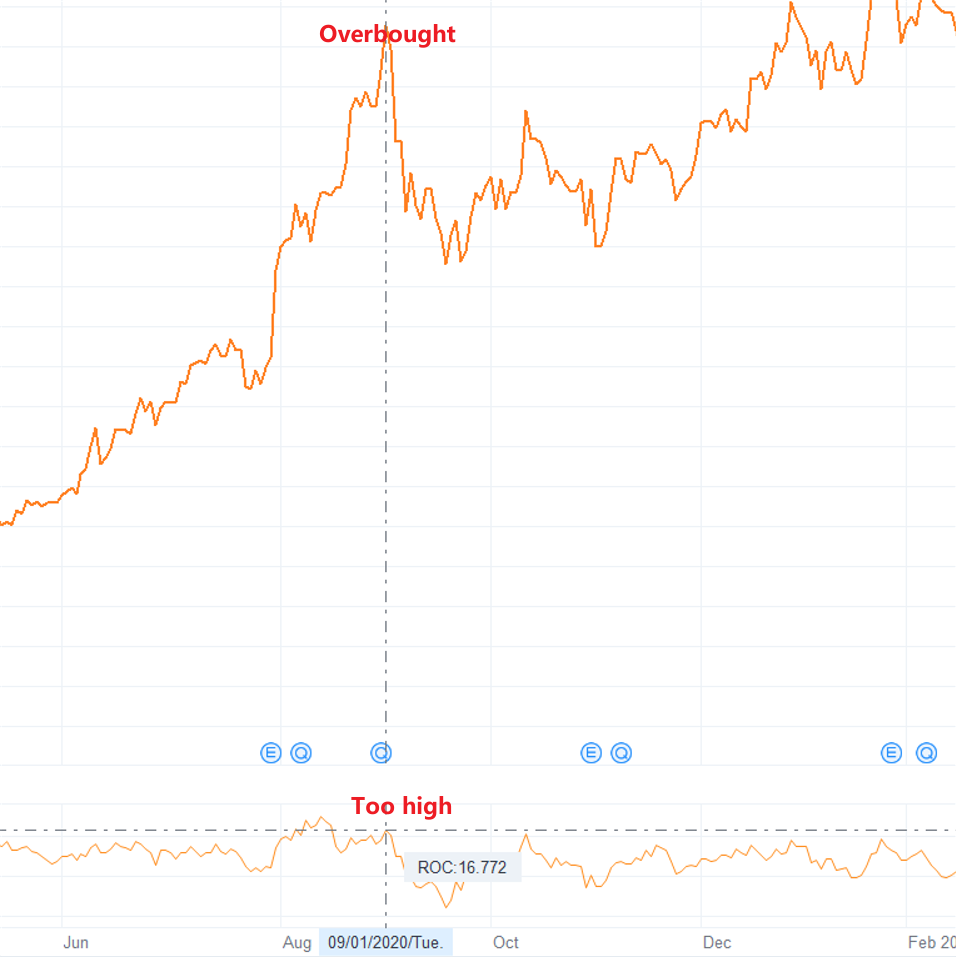
The ROC can be used to identify extreme cases and predict turning points. When the ROC rises to a relatively high level, it indicates that the stock is overbought and is usually seen as a sell signal.
(Images provided are not current and any securities are shown for illustrative purposes only.)
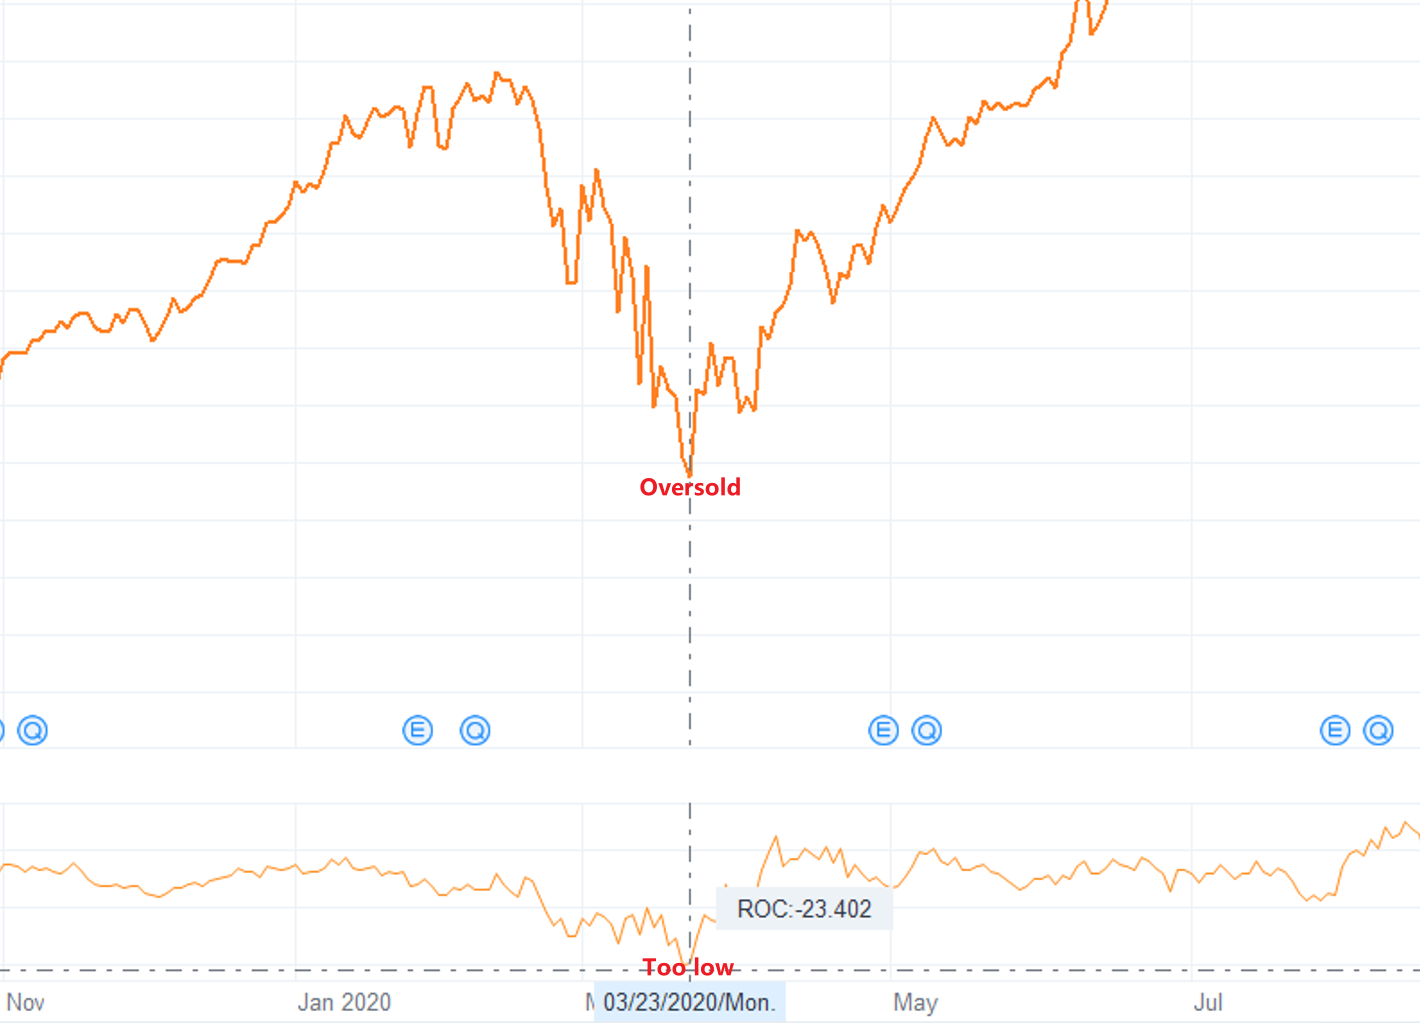
Conversely, when the ROC falls to a relatively low level, indicating that the stock is oversold, it is often seen as a buy signal.
(Images provided are not current and any securities are shown for illustrative purposes only.)
Divergence Indicator
The ROC is also widely used as a divergence indicator that signals a possible upcoming trend change.
In most cases, the ROC moves in a similar direction to the stock price.
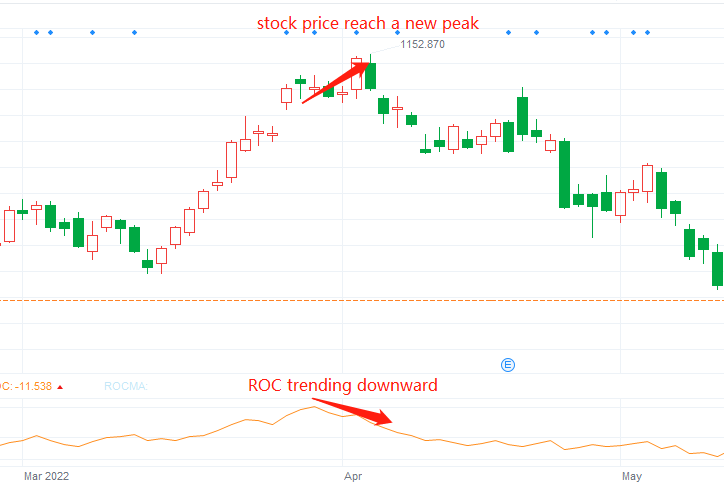
However, if the ROC curve is trending downward, but the stock price has a new peak, a divergence occurs, indicating that the stock price may not be able to maintain an upward trend in the future. This situation is shown in the chart below of Tesla's stock price.
(Images provided are not current and any securities are shown for illustrative purposes only.)
Nevertheless, ROC divergences sometimes give false signals. When the ROC starts to diverge, the price can still run in the trending direction for some time, so a trader should also look at other indicators and analysis methods to further confirm a trend change.
This presentation is for informational and educational use only and is not a recommendation or endorsement of any particular investment or investment strategy. Investment information provided in this content is general in nature, strictly for illustrative purposes, and may not be appropriate for all investors. Read more
Recommend
What is Net Worth?
What is Volume-Weighted Average Price (VWAP)?
What is the OBV?

What is Scalp Trading?
What is the Equity Ratio?
What Is A Pattern Day Trader (PDT)?
What is the PEG Ratio?
What is a Trailing Stop Limit Order?
What are Support and Resistance?
What is a 401(k)?
What is Capitulation?
What is Net Income?
What is the Risk/Reward Ratio?
What is Short Selling?
What is the rate of change?
What is Opportunity Cost?
What is the Short Squeeze?
What is a Sunk Cost?
What is a Golden Cross?
What is a Stock Split?
What is Gross Margin?
What is a block trade?
What is the Dead Cat Bounce?
What are the Safe-haven Assets?
What is the Relative Strength Index (RSI)?
What is Return on Equity (ROE)?
What is Momentum Trading?
What are Bollinger Bands?
What is After-hour Trading?
What is the KDJ?
What Is a Dividend?
What is PE ratio?
What is a Delisting?
What is Return on Assets (ROA)?
What is a SPAC?
What is the Quick Ratio?
What is the Current Ratio?
What is Free Cash Flow to Firm(FCFF)?
What is Book Value per Share (BVPS)?
What is Margin Trading?
What is Net Worth?
What is Volume-Weighted Average Price (VWAP)?
What is the OBV?
What is Scalp Trading?
What is the Equity Ratio?
What Is A Pattern Day Trader (PDT)?
What is the PEG Ratio?
What is a Trailing Stop Limit Order?
What are Support and Resistance?
What is a 401(k)?
What is Capitulation?
What is Net Income?
What is the Risk/Reward Ratio?
What is Short Selling?
What is the rate of change?
What is Opportunity Cost?
What is the Short Squeeze?
What is a Sunk Cost?
What is a Golden Cross?
What is a Stock Split?
What is Gross Margin?
What is a block trade?
What is the Dead Cat Bounce?
What are the Safe-haven Assets?
What is the Relative Strength Index (RSI)?
What is Return on Equity (ROE)?
What is Momentum Trading?
What are Bollinger Bands?
What is After-hour Trading?
What is the KDJ?
What Is a Dividend?
What is PE ratio?
What is a Delisting?
What is Return on Assets (ROA)?
What is a SPAC?
What is the Quick Ratio?
What is the Current Ratio?
What is Free Cash Flow to Firm(FCFF)?
What is Book Value per Share (BVPS)?
What is Margin Trading?

