
Moomoo Insights
Jul 16 15:38
TSMC Earnings: AI Demand Is Stronger Than the Chip Selloff Suggests
Moomoo Insights
Sep 30 05:04
Live Take | Anthropic’s $518B Compute Bet: Who Wins From the AI Buildout?
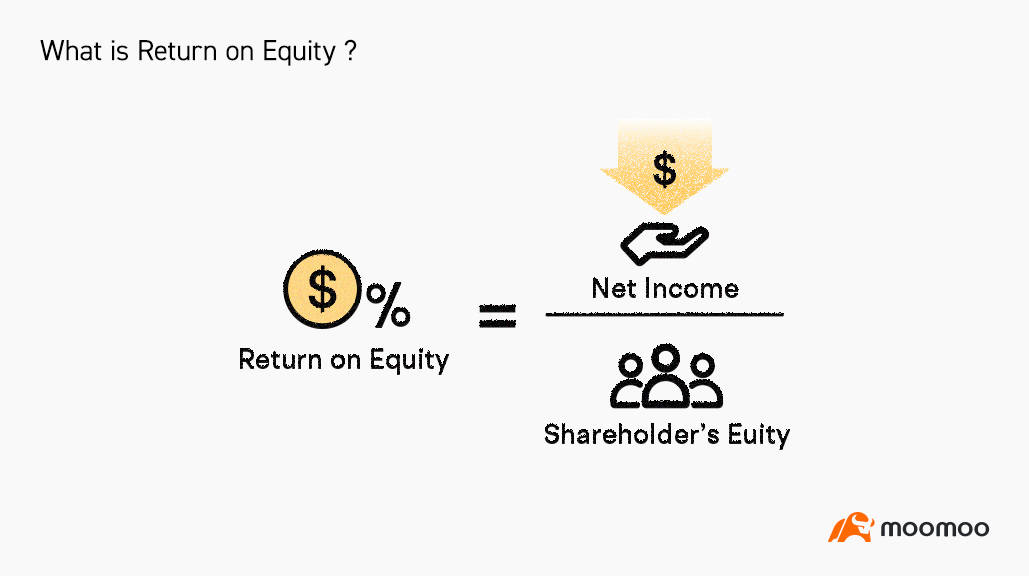
A company's Return on Equity (ROE) is a financial ratio calculated by dividing its net income by its average shareholders' equity
ROE can be used to measure how efficiently a company utilizes its equity to generate profit
Generally speaking, the higher the ROE, the better. However, an outsized ROE might indicate problems like inconsistent profits or excessive debt
Return on Equity (ROE) refers to a financial ratio that indicates how profitable a company is relative to its shareholders' equity.
ROE is calculated by dividing a firm's net income by the average of its shareholders' equity for a given period(usually in an annual period). Expressed as a percentage, ROE can be calculated for any company if its net income and equity are both positive numbers.
Its formula can be expressed as:
where,
ROE is considered the return on net assets since shareholders' equity is equal to a company's assets minus its liabilities.
ROE can be used to measure how efficiently a company utilizes its equity to generate profit. Generally speaking, the higher the ROE, the better.
But a high ROE might not always be a good thing. An outsized ROE might indicate some problems—such as inconsistent profits or excessive debt. Also, a negative ROE due to the company having a net loss or negative shareholders' equity is not a helpful metric to analyze the firm, nor can it be compared against companies with a positive ROE.
Relatively high or low ROE ratios will vary significantly from one industry group or sector to another. Therefore, a company's ROE must be compared with that of its peers in the same industry.
Below is the balance sheet from Apple's 10K statement showing the total shareholders' equity for the fiscal years ended September 24, 2022 and September 25, 2021.
The total shareholders' equity of Apple at the end of FY2022 was $ 50.672 Billion
The total shareholders' equity of Apple at the end of FY2021 was $ 63.09 Billion
Apple's total average shareholders equity for FY2022=($50.672 Billion+$63.09 Billion)÷ 2=$56.881 Billion
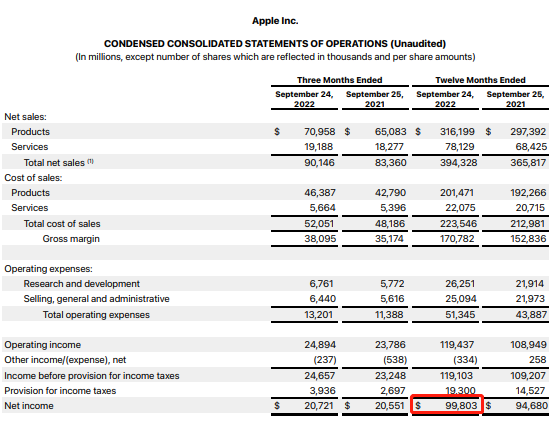
Below is the income statement for the fiscal year 2022 (for the year ended September 24, 2022) of Apple according to its 10K statement:
Apple reported net income of $99.803 billion for FY2022.
Apple's ROE=$99.803 Billion ÷ $56.881 Billion=175.46%
This means that for every dollar of shareholders' equity during 2022, Apple generated 1.75(rounded) dollars in profit.
Both ROA and ROE measure how efficiently the company generates its profits. However, whereas ROE compares net income to the company's net assets, ROA refers to its net income relative to its assets in total, without deducting its liabilities.
ROA factors in how leveraged a company is or how much debt it carries. After all, its total assets include any capital it borrows to run its operations. On the other hand, ROE only measures the return on a company's equity, which leaves out its liabilities.
In general, the more leverage or debt a company takes on, the higher its ROE relative to ROA. Thus, when a company takes on more debt, its ROE would be higher than its ROA.
This presentation is for informational and educational use only and is not a recommendation or endorsement of any particular investment or investment strategy. Investment information provided in this content is general in nature, strictly for illustrative purposes, and may not be appropriate for all investors. Read more
Recommend
What is Net Worth?
What is Volume-Weighted Average Price (VWAP)?
What is the OBV?

What is Scalp Trading?
What is the Equity Ratio?
What Is A Pattern Day Trader (PDT)?
What is the PEG Ratio?
What is a Trailing Stop Limit Order?
What are Support and Resistance?
What is a 401(k)?
What is Capitulation?
What is Net Income?
What is the Risk/Reward Ratio?
What is Short Selling?
What is the rate of change?
What is Opportunity Cost?
What is the Short Squeeze?
What is a Sunk Cost?
What is a Golden Cross?
What is a Stock Split?
What is Gross Margin?
What is a block trade?
What is the Dead Cat Bounce?
What are the Safe-haven Assets?
What is the Relative Strength Index (RSI)?
What is Return on Equity (ROE)?
What is Momentum Trading?
What are Bollinger Bands?
What is After-hour Trading?
What is the KDJ?
What Is a Dividend?
What is PE ratio?
What is a Delisting?
What is Return on Assets (ROA)?
What is a SPAC?
What is the Quick Ratio?
What is the Current Ratio?
What is Free Cash Flow to Firm(FCFF)?
What is Book Value per Share (BVPS)?
What is Margin Trading?
What is Net Worth?
What is Volume-Weighted Average Price (VWAP)?
What is the OBV?
What is Scalp Trading?
What is the Equity Ratio?
What Is A Pattern Day Trader (PDT)?
What is the PEG Ratio?
What is a Trailing Stop Limit Order?
What are Support and Resistance?
What is a 401(k)?
What is Capitulation?
What is Net Income?
What is the Risk/Reward Ratio?
What is Short Selling?
What is the rate of change?
What is Opportunity Cost?
What is the Short Squeeze?
What is a Sunk Cost?
What is a Golden Cross?
What is a Stock Split?
What is Gross Margin?
What is a block trade?
What is the Dead Cat Bounce?
What are the Safe-haven Assets?
What is the Relative Strength Index (RSI)?
What is Return on Equity (ROE)?
What is Momentum Trading?
What are Bollinger Bands?
What is After-hour Trading?
What is the KDJ?
What Is a Dividend?
What is PE ratio?
What is a Delisting?
What is Return on Assets (ROA)?
What is a SPAC?
What is the Quick Ratio?
What is the Current Ratio?
What is Free Cash Flow to Firm(FCFF)?
What is Book Value per Share (BVPS)?
What is Margin Trading?