
Moomoo Insights
Jul 16 15:38
TSMC Earnings: AI Demand Is Stronger Than the Chip Selloff Suggests
Moomoo Insights
Sep 30 05:04
Live Take | Anthropic’s $518B Compute Bet: Who Wins From the AI Buildout?
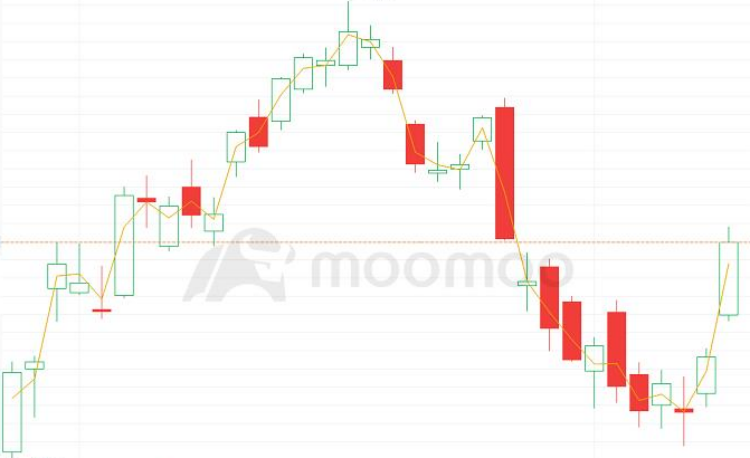
● Volume-Weighted Average Price(VWAP) measures the average asset price weighted by the total trading volume.
● VWAP is usually used on intraday charts.
● The current stock price is on the rise if it moves above the VWAP.
Volume-Weighted Average Price (VWAP) is a technical analysis tool to weight the average asset price by the total trading volume.
The basic formula for VWAP is as follows:
VWAP = ∑ (Typical Price * Volume) / ∑ Volume
Here, Typical Price = (High Price + Low Price + Closing Price) / 3.
VWAP is usually used on intraday charts to ascertain the basic intraday price moves.
VWAP is similar to SMA (Simple Moving Average).
When the stock price moves above the VWAP, it sends a bullish signal, where the current stock price is on the rise.
By contrast, when the stock price falls and moves below the VWAP, it suggests that the stock is in a downtrend.
VWAP reflects the average asset price relative to the trading volume within a specific time period.
As a lagging indicator, however, VWAP is unable to predict future prices.
As a result, many investors use it to analyze intraday trading.
This presentation is for informational and educational use only and is not a recommendation or endorsement of any particular investment or investment strategy. Investment information provided in this content is general in nature, strictly for illustrative purposes, and may not be appropriate for all investors. Read more
Recommend
What is Net Worth?
What is Volume-Weighted Average Price (VWAP)?
What is the OBV?

What is Scalp Trading?
What is the Equity Ratio?
What Is A Pattern Day Trader (PDT)?
What is the PEG Ratio?
What is a Trailing Stop Limit Order?
What are Support and Resistance?
What is a 401(k)?
What is Capitulation?
What is Net Income?
What is the Risk/Reward Ratio?
What is Short Selling?
What is the rate of change?
What is Opportunity Cost?
What is the Short Squeeze?
What is a Sunk Cost?
What is a Golden Cross?
What is a Stock Split?
What is Gross Margin?
What is a block trade?
What is the Dead Cat Bounce?
What are the Safe-haven Assets?
What is the Relative Strength Index (RSI)?
What is Return on Equity (ROE)?
What is Momentum Trading?
What are Bollinger Bands?
What is After-hour Trading?
What is the KDJ?
What Is a Dividend?
What is PE ratio?
What is a Delisting?
What is Return on Assets (ROA)?
What is a SPAC?
What is the Quick Ratio?
What is the Current Ratio?
What is Free Cash Flow to Firm(FCFF)?
What is Book Value per Share (BVPS)?
What is Margin Trading?
What is Net Worth?
What is Volume-Weighted Average Price (VWAP)?
What is the OBV?
What is Scalp Trading?
What is the Equity Ratio?
What Is A Pattern Day Trader (PDT)?
What is the PEG Ratio?
What is a Trailing Stop Limit Order?
What are Support and Resistance?
What is a 401(k)?
What is Capitulation?
What is Net Income?
What is the Risk/Reward Ratio?
What is Short Selling?
What is the rate of change?
What is Opportunity Cost?
What is the Short Squeeze?
What is a Sunk Cost?
What is a Golden Cross?
What is a Stock Split?
What is Gross Margin?
What is a block trade?
What is the Dead Cat Bounce?
What are the Safe-haven Assets?
What is the Relative Strength Index (RSI)?
What is Return on Equity (ROE)?
What is Momentum Trading?
What are Bollinger Bands?
What is After-hour Trading?
What is the KDJ?
What Is a Dividend?
What is PE ratio?
What is a Delisting?
What is Return on Assets (ROA)?
What is a SPAC?
What is the Quick Ratio?
What is the Current Ratio?
What is Free Cash Flow to Firm(FCFF)?
What is Book Value per Share (BVPS)?
What is Margin Trading?

