
Moomoo Insights
Jul 16 15:38
TSMC Earnings: AI Demand Is Stronger Than the Chip Selloff Suggests
Moomoo Insights
Sep 30 05:04
Live Take | Anthropic’s $518B Compute Bet: Who Wins From the AI Buildout?

The equity ratio, also known as the net asset ratio, is an important metric for evaluating a company's debt-paying ability and financial structure.
Equity Ratio = (Shareholders' Equity / Total Assets) × 100%
A low equity ratio indicates excessive borrowing, which might weaken a company's ability to withstand external shocks. Conversely, a high equity ratio may suggest the company is not leveraging financial opportunities to expand its operations.
The equity ratio indicates the proportion of a company's assets financed by shareholders' equity, reflecting the company’s own capital and financial stability.
The formula for calculating the equity ratio is:
Equity Ratio = (Shareholders' Equity / Total Assets) ×100%
Both shareholders' equity and total assets are typically taken from the fiscal period end values.
A higher equity ratio means the company has a strong capacity to finance itself without relying heavily on debt, which is generally seen as a sign of financial health and lower risk. However, a very high equity ratio may indicate that the company is not leveraging financial opportunities to grow its operations.
Analyzing the equity ratio can help guide the optimization of a company's capital and debt structure. Generally, an equity ratio between 30% and 60% is considered appropriate. It's important to note that optimal capital structures may vary across industries, and comparing equity ratios between different industries might not be meaningful.
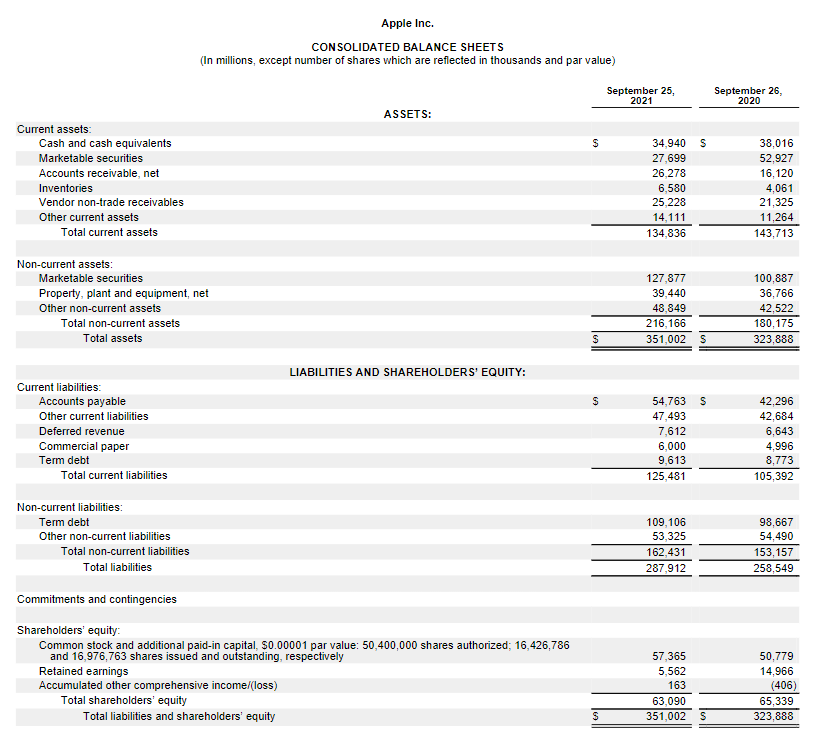
Let's take a look at $Apple (AAPL.US)$ Inc.'s balance sheet from its 2021 fiscal year report, ending on September 25, 2021:
The annual report shows that:
Shareholders' equity at the end of fiscal year 2021: $63.09 billion
Total assets at the end of fiscal year 2021: $351.02 billion
This gives us the equity ratio for Apple Inc. at the end of fiscal year 2021:
Equity Ratio = ($63.09 billion/$351.02 billion) ×100%=17.97%
This presentation is for informational and educational use only and is not a recommendation or endorsement of any particular investment or investment strategy. Investment information provided in this content is general in nature, strictly for illustrative purposes, and may not be appropriate for all investors. Read more
Recommend
What is Net Worth?
What is Volume-Weighted Average Price (VWAP)?
What is the OBV?

What is Scalp Trading?
What is the Equity Ratio?
What Is A Pattern Day Trader (PDT)?
What is the PEG Ratio?
What is a Trailing Stop Limit Order?
What are Support and Resistance?
What is a 401(k)?
What is Capitulation?
What is Net Income?
What is the Risk/Reward Ratio?
What is Short Selling?
What is the rate of change?
What is Opportunity Cost?
What is the Short Squeeze?
What is a Sunk Cost?
What is a Golden Cross?
What is a Stock Split?
What is Gross Margin?
What is a block trade?
What is the Dead Cat Bounce?
What are the Safe-haven Assets?
What is the Relative Strength Index (RSI)?
What is Return on Equity (ROE)?
What is Momentum Trading?
What are Bollinger Bands?
What is After-hour Trading?
What is the KDJ?
What Is a Dividend?
What is PE ratio?
What is a Delisting?
What is Return on Assets (ROA)?
What is a SPAC?
What is the Quick Ratio?
What is the Current Ratio?
What is Free Cash Flow to Firm(FCFF)?
What is Book Value per Share (BVPS)?
What is Margin Trading?
What is Net Worth?
What is Volume-Weighted Average Price (VWAP)?
What is the OBV?
What is Scalp Trading?
What is the Equity Ratio?
What Is A Pattern Day Trader (PDT)?
What is the PEG Ratio?
What is a Trailing Stop Limit Order?
What are Support and Resistance?
What is a 401(k)?
What is Capitulation?
What is Net Income?
What is the Risk/Reward Ratio?
What is Short Selling?
What is the rate of change?
What is Opportunity Cost?
What is the Short Squeeze?
What is a Sunk Cost?
What is a Golden Cross?
What is a Stock Split?
What is Gross Margin?
What is a block trade?
What is the Dead Cat Bounce?
What are the Safe-haven Assets?
What is the Relative Strength Index (RSI)?
What is Return on Equity (ROE)?
What is Momentum Trading?
What are Bollinger Bands?
What is After-hour Trading?
What is the KDJ?
What Is a Dividend?
What is PE ratio?
What is a Delisting?
What is Return on Assets (ROA)?
What is a SPAC?
What is the Quick Ratio?
What is the Current Ratio?
What is Free Cash Flow to Firm(FCFF)?
What is Book Value per Share (BVPS)?
What is Margin Trading?

