
Moomoo Insights
Jul 16 15:38
TSMC Earnings: AI Demand Is Stronger Than the Chip Selloff Suggests
Moomoo Insights
Sep 30 05:04
Live Take | Anthropic’s $518B Compute Bet: Who Wins From the AI Buildout?
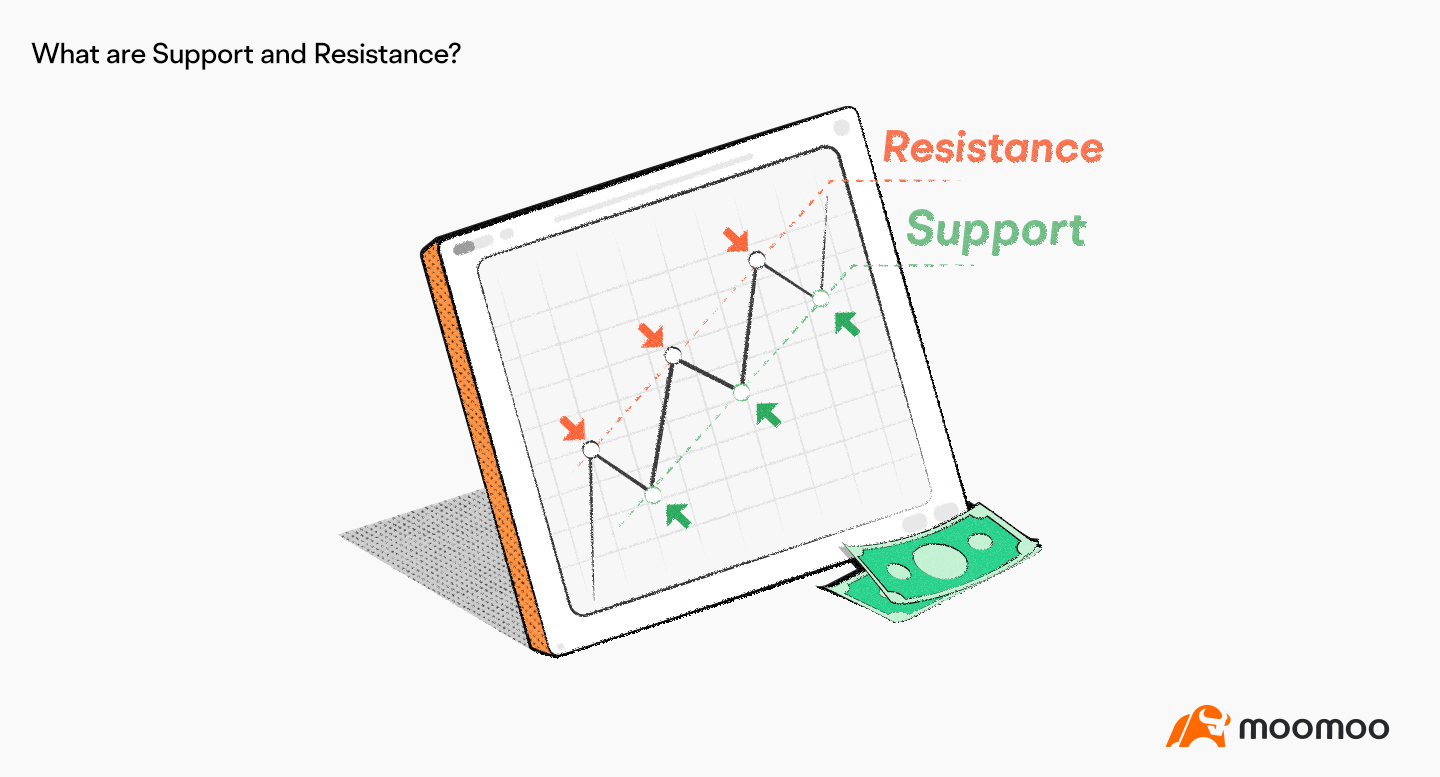
Support is a price level where potential support may stop a downtrend.
Resistance is a price level where potential resistance may reverse an uptrend.
Three factors to refer to when identifying support and resistance: historical prices, previous support and resistance, and technical indicators.
Support and resistance are two concepts commonly used in technical analysis.
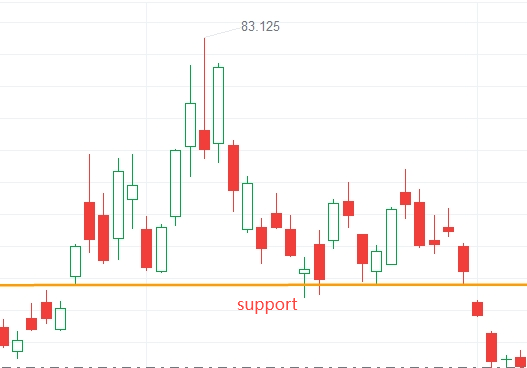
Support refers to a price level where there's potential support to stop a downtrend.
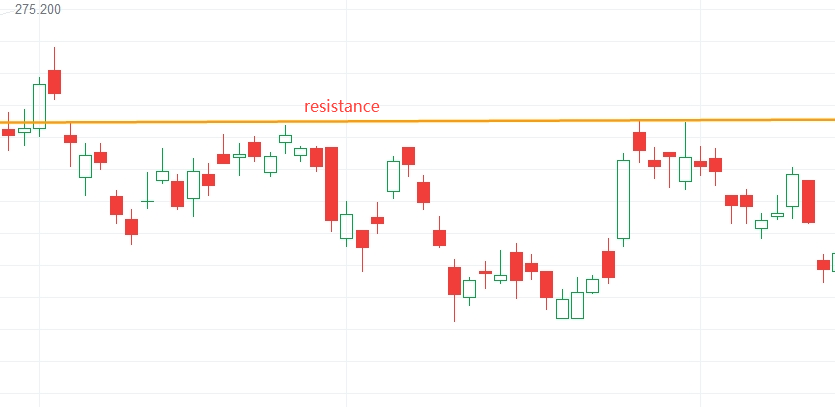
Resistance is a price level where there's potential resistance to reverse an uptrend.
Support and resistance usually appear under the following circumstances.
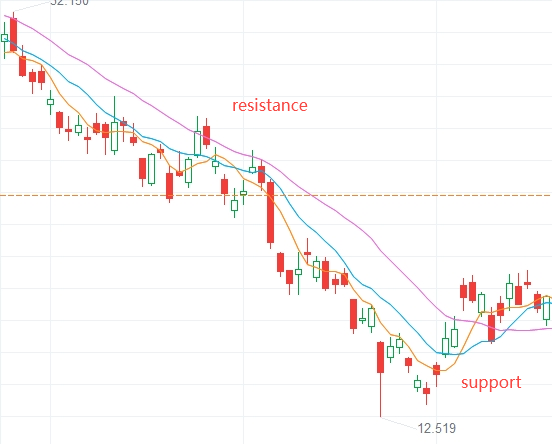
Moving averages, such as the 5-day, 10-day, and 20-day moving averages, create support and resistance.
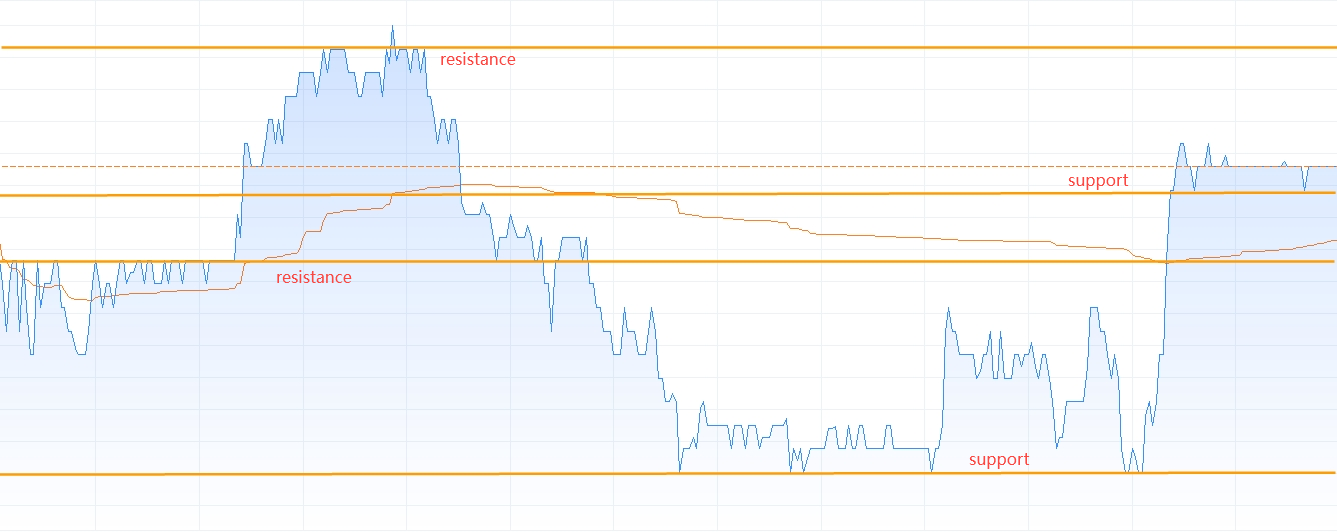
In an intraday trendline, the high and low points form support and resistance.
When a gap opening happens (i.e., the opening price is substantially higher or lower than the previous day's closing price), an upward gap serves as support and a downward gap functions as resistance.
Support and resistance can also be found in existing ascending or descending channels.
Several factors can be considered when we're identifying support and resistance: historical prices, previous support and resistance, and technical indicators.
In a moving average chart, the nearest moving average above a high price provides short-term resistance, while the nearest one below a low price creates short-term support. Increasing volume with price breaking through resistance presents a bullish signal, whereas rising volume with price breaking through support suggests a bearish signal.
In an intraday trendline, opening, closing, high, and low prices all form corresponding short-term support or resistance. Day traders could draw the trendline on the 1-min time frame to identify resistance and support.
In terms of a gap opening, an upward gap provides support and a downward gap resistance.
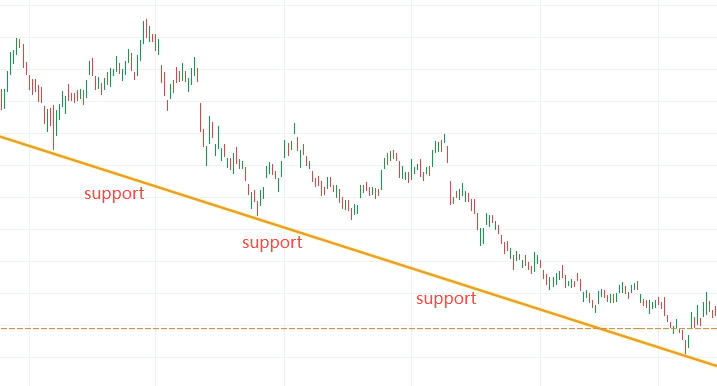
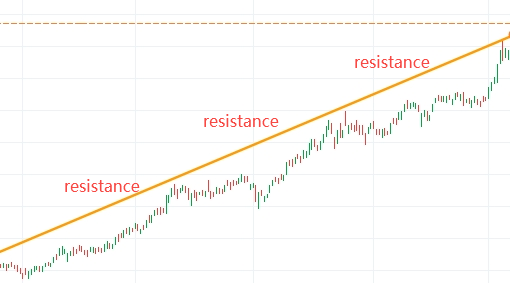
In an existing ascending channel, connecting high prices can help identify resistance; in a descending channel, connecting low prices can help identify support.
Support and resistance analysis is an entry-level strategy for investing in the stock market, which can be used to help set stop-loss and take-profit targets and determine entry and exit points. However, as there're many other factors affecting stock prices, and support and resistance are often broken, we need to take the overall market situation into consideration before deciding the effectiveness of the two price levels.
This presentation is for informational and educational use only and is not a recommendation or endorsement of any particular investment or investment strategy. Investment information provided in this content is general in nature, strictly for illustrative purposes, and may not be appropriate for all investors. Read more
Recommend

What is Net Worth?
What is Volume-Weighted Average Price (VWAP)?
What is the OBV?

What is Scalp Trading?
What is the Equity Ratio?
What Is A Pattern Day Trader (PDT)?
What is the PEG Ratio?
What is a Trailing Stop Limit Order?
What are Support and Resistance?
What is a 401(k)?
What is Capitulation?
What is Net Income?
What is the Risk/Reward Ratio?
What is Short Selling?
What is the rate of change?
What is Opportunity Cost?
What is the Short Squeeze?
What is a Sunk Cost?
What is a Golden Cross?
What is a Stock Split?
What is Gross Margin?
What is a block trade?
What is the Dead Cat Bounce?
What are the Safe-haven Assets?
What is the Relative Strength Index (RSI)?
What is Return on Equity (ROE)?
What is Momentum Trading?
What are Bollinger Bands?
What is After-hour Trading?
What is the KDJ?
What Is a Dividend?
What is PE ratio?
What is a Delisting?
What is Return on Assets (ROA)?
What is a SPAC?
What is the Quick Ratio?
What is the Current Ratio?
What is Free Cash Flow to Firm(FCFF)?
What is Book Value per Share (BVPS)?
What is Margin Trading?
What is Net Worth?
What is Volume-Weighted Average Price (VWAP)?
What is the OBV?
What is Scalp Trading?
What is the Equity Ratio?
What Is A Pattern Day Trader (PDT)?
What is the PEG Ratio?
What is a Trailing Stop Limit Order?
What are Support and Resistance?
What is a 401(k)?
What is Capitulation?
What is Net Income?
What is the Risk/Reward Ratio?
What is Short Selling?
What is the rate of change?
What is Opportunity Cost?
What is the Short Squeeze?
What is a Sunk Cost?
What is a Golden Cross?
What is a Stock Split?
What is Gross Margin?
What is a block trade?
What is the Dead Cat Bounce?
What are the Safe-haven Assets?
What is the Relative Strength Index (RSI)?
What is Return on Equity (ROE)?
What is Momentum Trading?
What are Bollinger Bands?
What is After-hour Trading?
What is the KDJ?
What Is a Dividend?
What is PE ratio?
What is a Delisting?
What is Return on Assets (ROA)?
What is a SPAC?
What is the Quick Ratio?
What is the Current Ratio?
What is Free Cash Flow to Firm(FCFF)?
What is Book Value per Share (BVPS)?
What is Margin Trading?