


Moomoo Insights
Jul 16 15:38
TSMC Earnings: AI Demand Is Stronger Than the Chip Selloff Suggests
Moomoo Insights
Sep 30 05:04
Live Take | Anthropic’s $518B Compute Bet: Who Wins From the AI Buildout?

The Relative Strength Index (RSI) is a momentum indicator that measures the speed and magnitude of price movements.
The RSI is generally considered overbought when above 70 and oversold when below 30.
RSI divergence and failure swings can also generate trading signals.
The Relative Strength Index (RSI), developed by J. Welles Wilder, is a momentum indicator to measure the magnitude of recent price changes to indicate whether a stock or other asset price is overbought or oversold. The formula for the RSI is
where RS = Average Gain of n days up / Average Loss of n days down
According to Welles (1978), the standard n is 14, but this can be lowered to increase sensitivity or raised to decrease sensitivity. The parameters also depend on the volatility of the security.
Overbought and Oversold
In terms of market analysis and trading signals, it is considered a bullish indicator when the RSI moves above the 30 reference level. Conversely, when the RSI falls below the 70 reference level is regarded as a bearish signal. Since some assets are more volatile and move faster than others, values of 80 and 20 are also commonly used for overbought and oversold assets.
(Images provided are not current and any securities are shown for illustrative purposes only.)
Divergence
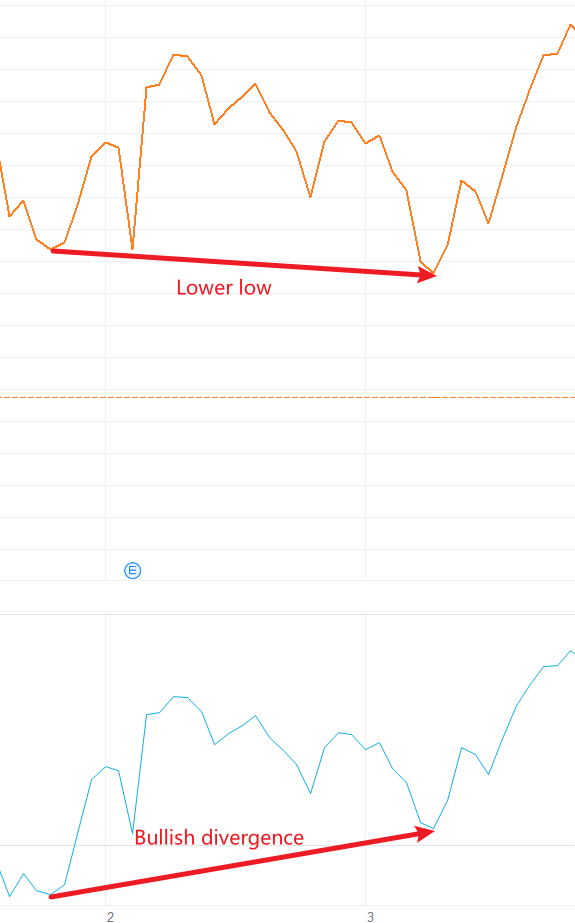
Divergence is a term technical analysts use to describe price signals moving in the opposite direction of a technical indicator. A bullish divergence occurs when the price of a security reaches a lower low, and the RSI forms a higher low. The RSI has yet to confirm a lower low, which suggests building momentum.
(Images provided are not current, and any securities are shown for illustrative purposes only.)
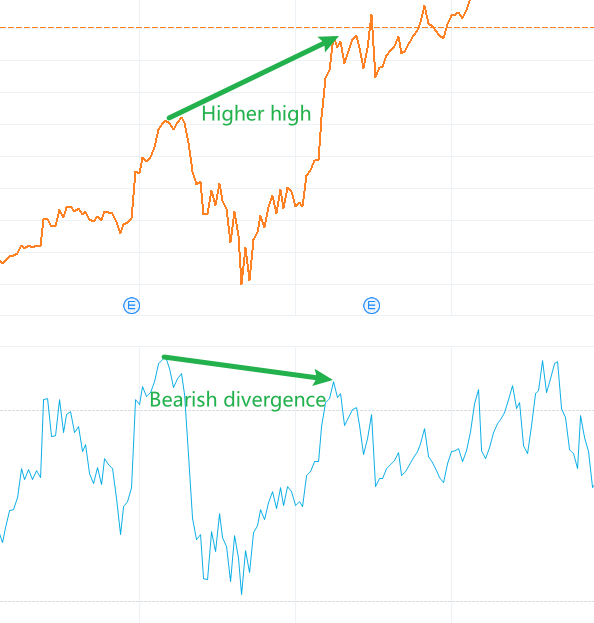
A bearish divergence is identified when a security reaches a higher high, and the RSI forms a lower high. The RSI did not confirm new highs, suggesting that momentum is waning.
(Images provided are not current, and any securities are shown for illustrative purposes only.)
Failure Swings
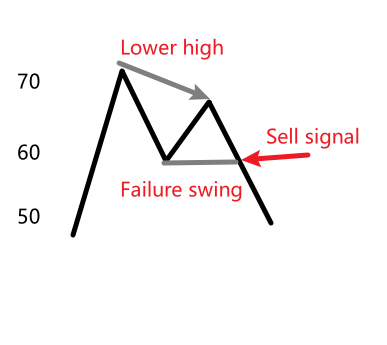
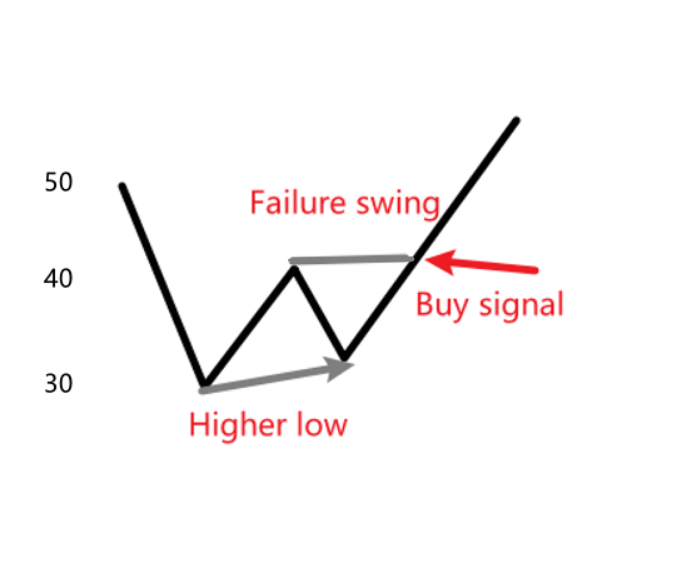
Failure swings made by RSI signal a price reversal that is entirely independent of price and relies on RSI. Failure swings occur when the RSI does not follow the highs in an uptrend or the lows in a downtrend, considered to be either bearish or bullish failure.
A bearish failure swing
RSI rises above 70 and drops back below 70.
RSI rises slightly but remains below 70.
RSI drops lower than its previous low.
(Images provided are not current, and any securities are shown for illustrative purposes only.)
A bullish failure swing
RSI drops below 30 and rises back above 30.
RSI retracts but remains above 30.
RSI breaks out above its previous high.
(Images provided are not current, and any securities are shown for illustrative purposes only.)
RSI is a useful momentum indicator that measures the magnitude of the price movement. However, here are a few limitations when using RSI.
When the trend is strong, the RSI can become less accurate. While RSI may still provide some value in a strong trend, it should be used cautiously.
RSI is not a good tool for confirming or executing trades. Most traders find the RSI most valuable as an initial indicator to identify trading opportunities and facilitate further research and evaluation. This is because the RSI does an excellent job identifying overbought or oversold conditions. Still, it does not provide strong evidence to determine whether these conditions reflect good trading opportunities.
This presentation is for informational and educational use only and is not a recommendation or endorsement of any particular investment or investment strategy. Investment information provided in this content is general in nature, strictly for illustrative purposes, and may not be appropriate for all investors. Read more
Recommend

What is Net Worth?
What is Volume-Weighted Average Price (VWAP)?
What is the OBV?

What is Scalp Trading?
What is the Equity Ratio?
What Is A Pattern Day Trader (PDT)?
What is the PEG Ratio?
What is a Trailing Stop Limit Order?
What are Support and Resistance?
What is a 401(k)?
What is Capitulation?
What is Net Income?
What is the Risk/Reward Ratio?
What is Short Selling?
What is the rate of change?
What is Opportunity Cost?
What is the Short Squeeze?
What is a Sunk Cost?
What is a Golden Cross?
What is a Stock Split?
What is Gross Margin?
What is a block trade?
What is the Dead Cat Bounce?
What are the Safe-haven Assets?
What is the Relative Strength Index (RSI)?
What is Return on Equity (ROE)?
What is Momentum Trading?
What are Bollinger Bands?
What is After-hour Trading?
What is the KDJ?
What Is a Dividend?
What is PE ratio?
What is a Delisting?
What is Return on Assets (ROA)?
What is a SPAC?
What is the Quick Ratio?
What is the Current Ratio?
What is Free Cash Flow to Firm(FCFF)?
What is Book Value per Share (BVPS)?
What is Margin Trading?
What is Net Worth?
What is Volume-Weighted Average Price (VWAP)?
What is the OBV?
What is Scalp Trading?
What is the Equity Ratio?
What Is A Pattern Day Trader (PDT)?
What is the PEG Ratio?
What is a Trailing Stop Limit Order?
What are Support and Resistance?
What is a 401(k)?
What is Capitulation?
What is Net Income?
What is the Risk/Reward Ratio?
What is Short Selling?
What is the rate of change?
What is Opportunity Cost?
What is the Short Squeeze?
What is a Sunk Cost?
What is a Golden Cross?
What is a Stock Split?
What is Gross Margin?
What is a block trade?
What is the Dead Cat Bounce?
What are the Safe-haven Assets?
What is the Relative Strength Index (RSI)?
What is Return on Equity (ROE)?
What is Momentum Trading?
What are Bollinger Bands?
What is After-hour Trading?
What is the KDJ?
What Is a Dividend?
What is PE ratio?
What is a Delisting?
What is Return on Assets (ROA)?
What is a SPAC?
What is the Quick Ratio?
What is the Current Ratio?
What is Free Cash Flow to Firm(FCFF)?
What is Book Value per Share (BVPS)?
What is Margin Trading?

