A must-read: Five tips to quickly select your next stocks
Selecting stocks that align with your investment approach can be important. Let's explore moomoo's "Markets" section for some potentially useful features.
Takeaways:
● The Heap Map is a quick way to take a glance at sector trends.
● The Heat list helps you explore trending stocks.
● The Stock Screeners offers a large selection of indicators that allow you to customize stock selection strategies.
1. Heat Map: Visualize market trends and sector movements
Let's start with the Heat Map. It's a quick way to take a glance at sector trends. If you're considering investing in specific sectors, you can use the Heat Map to identify potential stocks.
To access the Heat Map: Go to Markets> Select a stock market> Tap Heat Map.
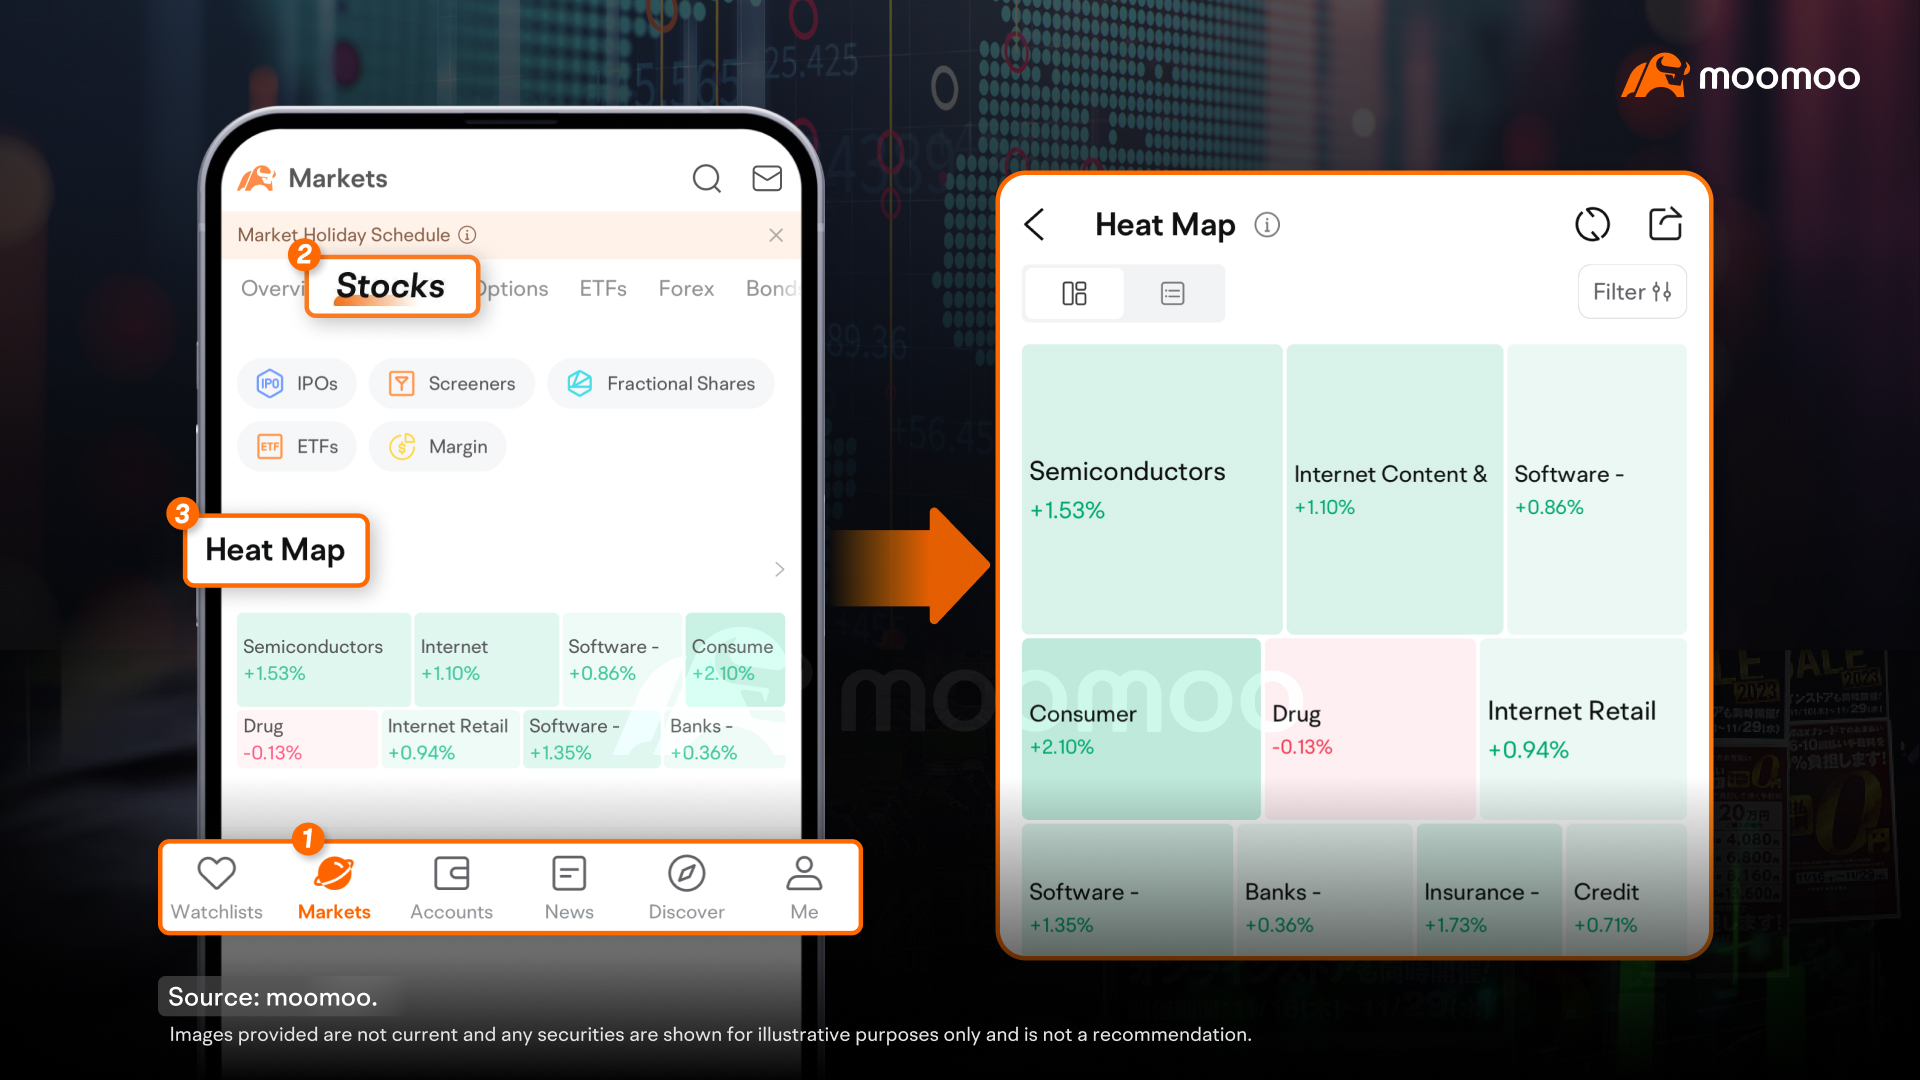
First, understand the sector area. By default, the sector area represents the total market capitalization for each sector. The larger the sector's market cap, the larger the sector area, and the more prominent its position.
This allows you to identify which sectors are significant to the overall market, such as Internet, Semiconductors, Software, etc. Tap a sector area to enter its Quotes page, where you can view its historical performance. Swipe up on the page to see the corresponding stocks.
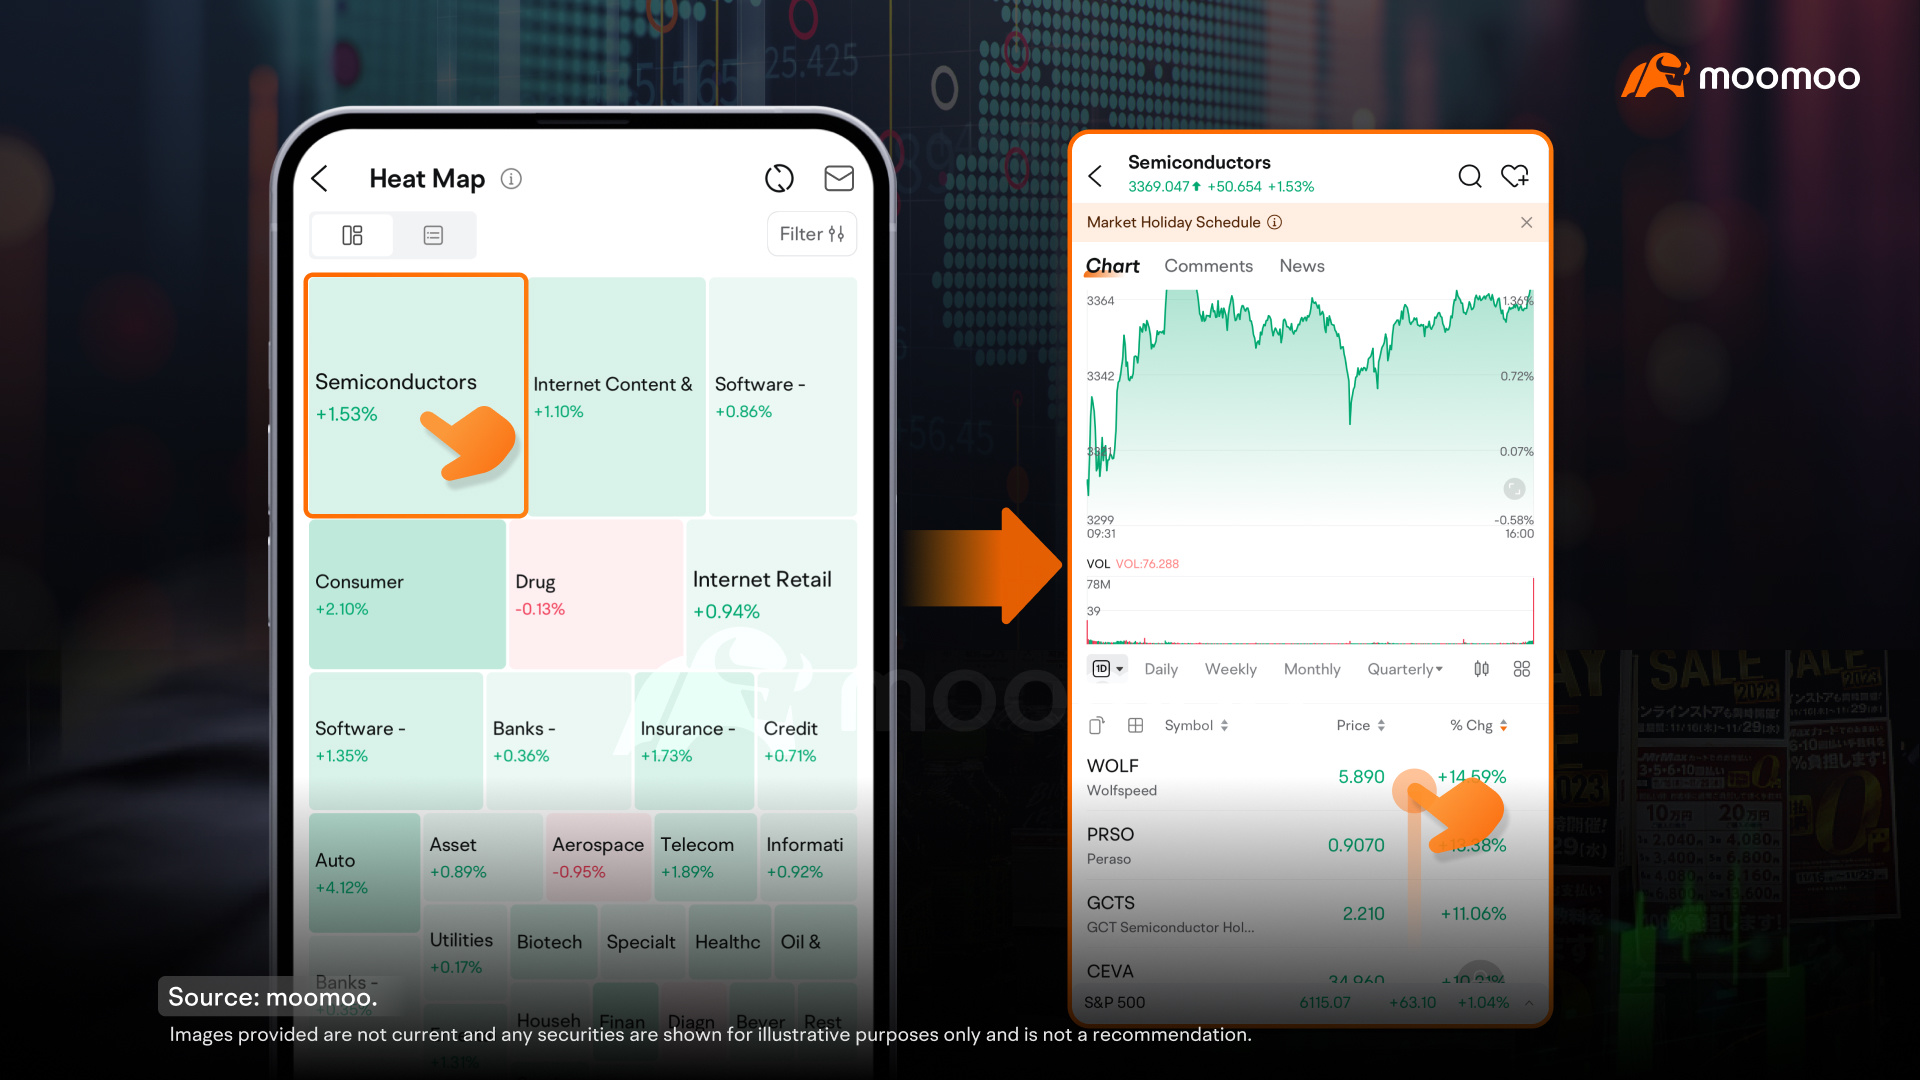
Second, observe the color of the sectors. The color indicates gains and losses of a sector. The greater the price move, the deeper the color.
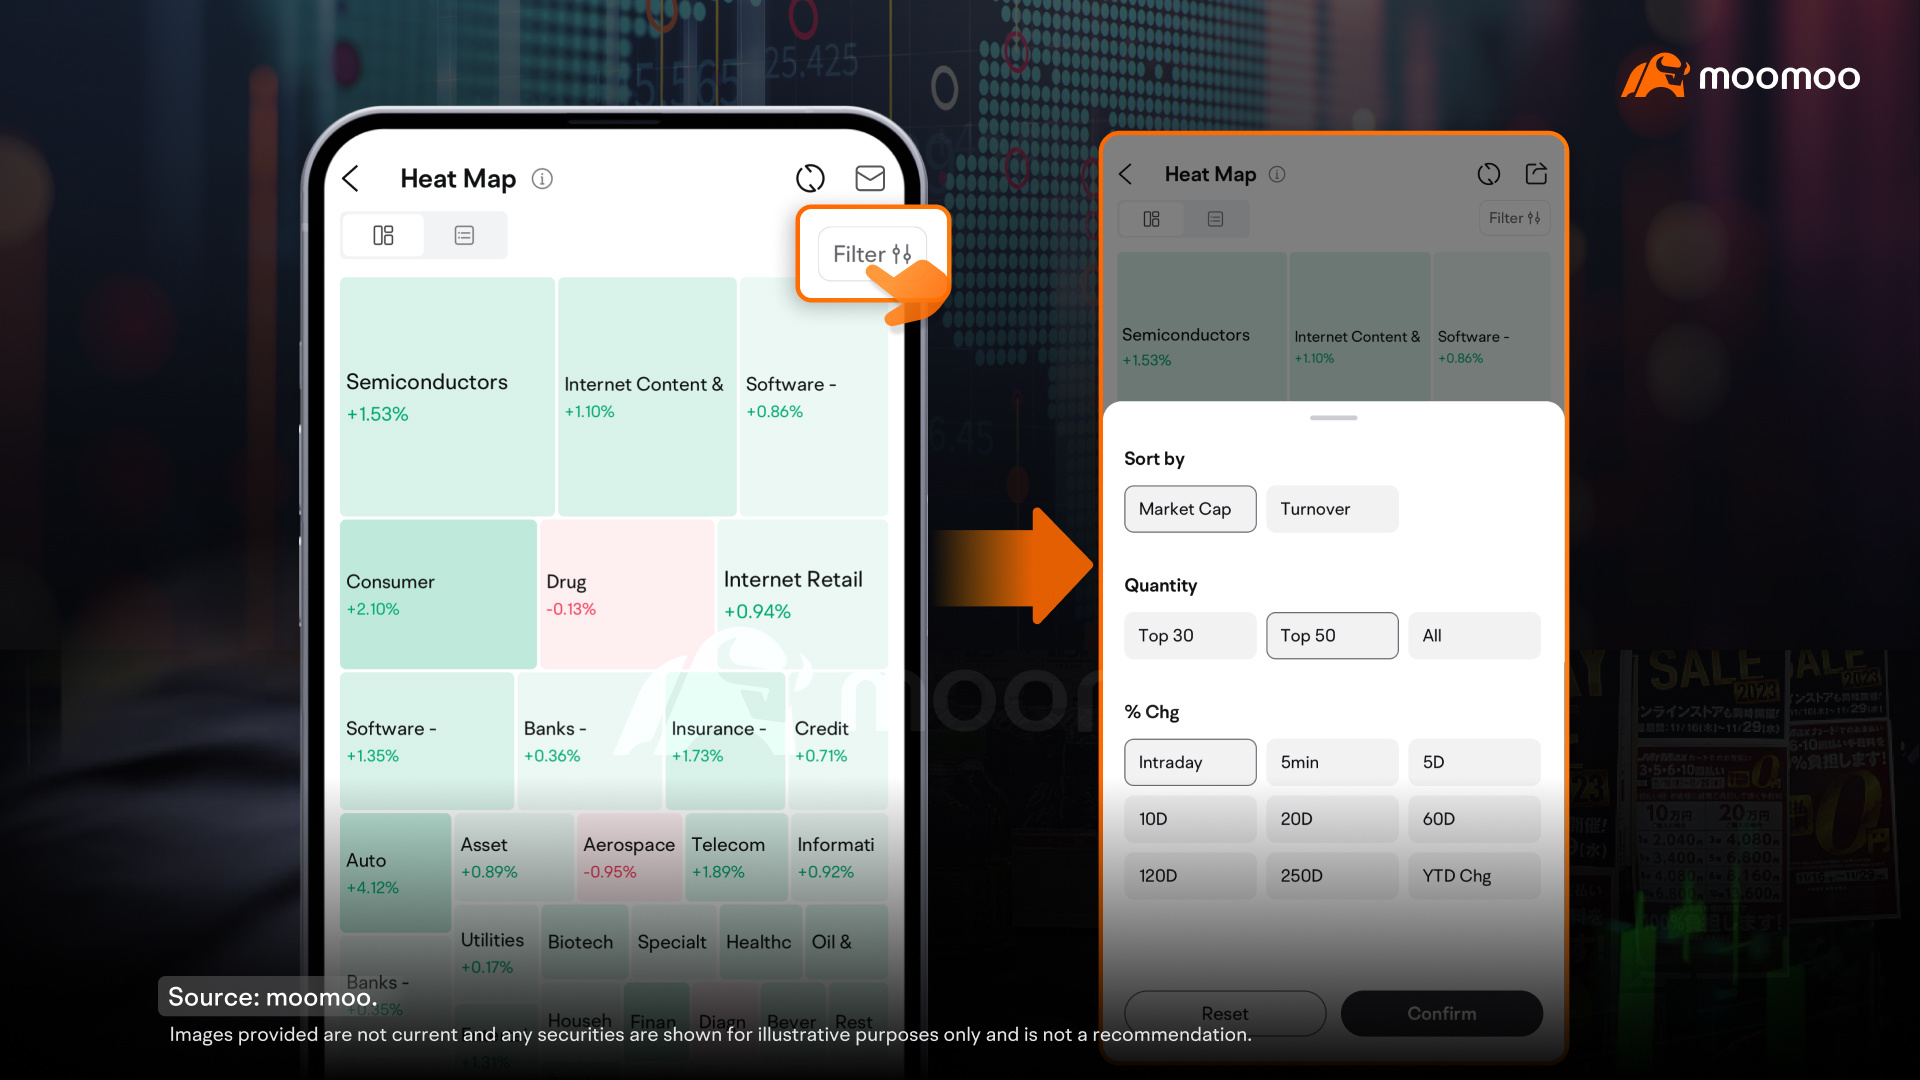
This provides a quick overview of performance across different sectors. To examine sector performance over longer periods, use the filter function. Here's how: Tap the Filter button at the top right> Set the percentage change to another time period> Tap Confirm to view the updated data.
2. Heat List: Identify trending stocks and stay informed about popular stocks
The second useful stock-selection feature in our list is the Heat List. It's based on important market factors, including news coverage, trading activity, and search frequency. If you're interested in exploring trending stocks, you can use the Heat List to identify potential options.
To access the Heat List: Go to Markets> Select a stock market> Tap Featured Lists.
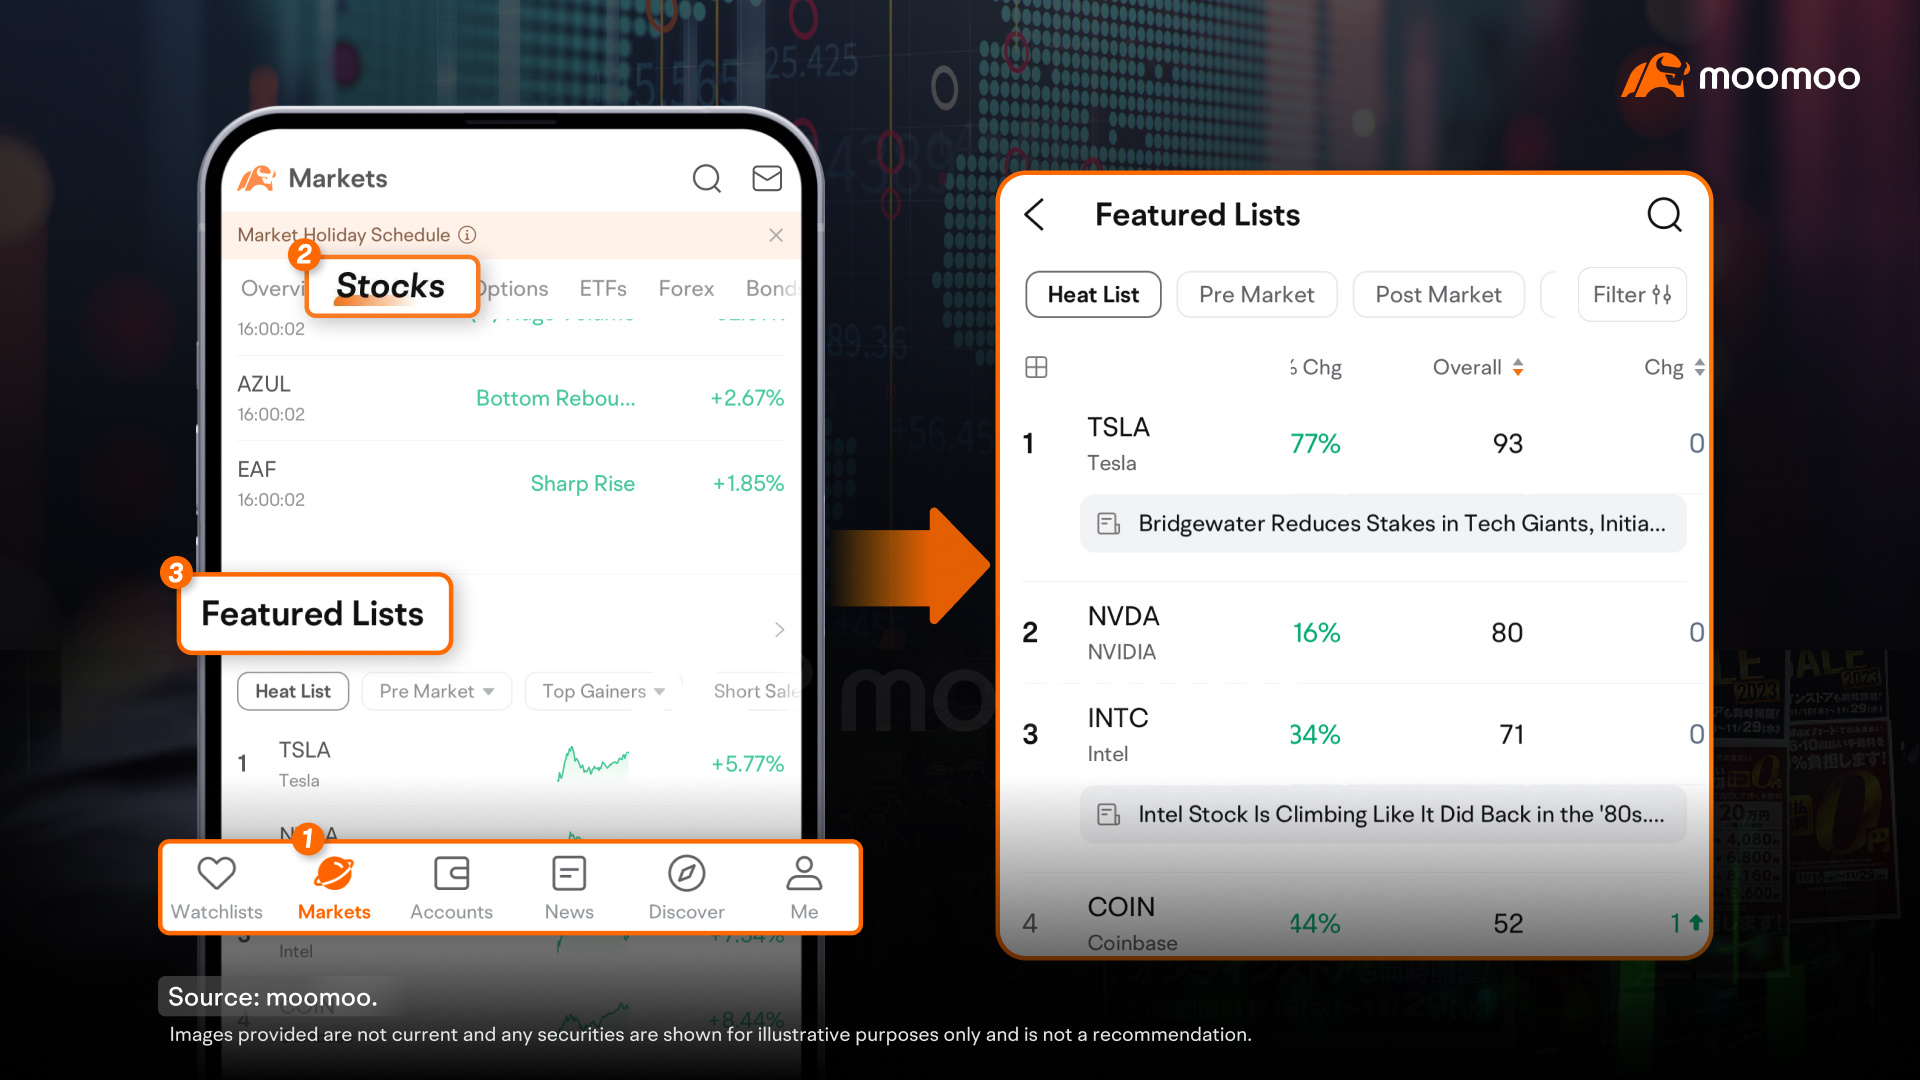
Generally, stocks appearing at the top of the Heat List represent those that have recently gained significant market attention, often influenced by certain news or events. You can follow these leads to investigate why their market popularity has increased and potentially identify investment opportunities.
For instance, tapping a news article in the Heat List allows you to read the company's recent news; or you can tap a symbol to enter its Quotes page, and then select "News" to view more related information.
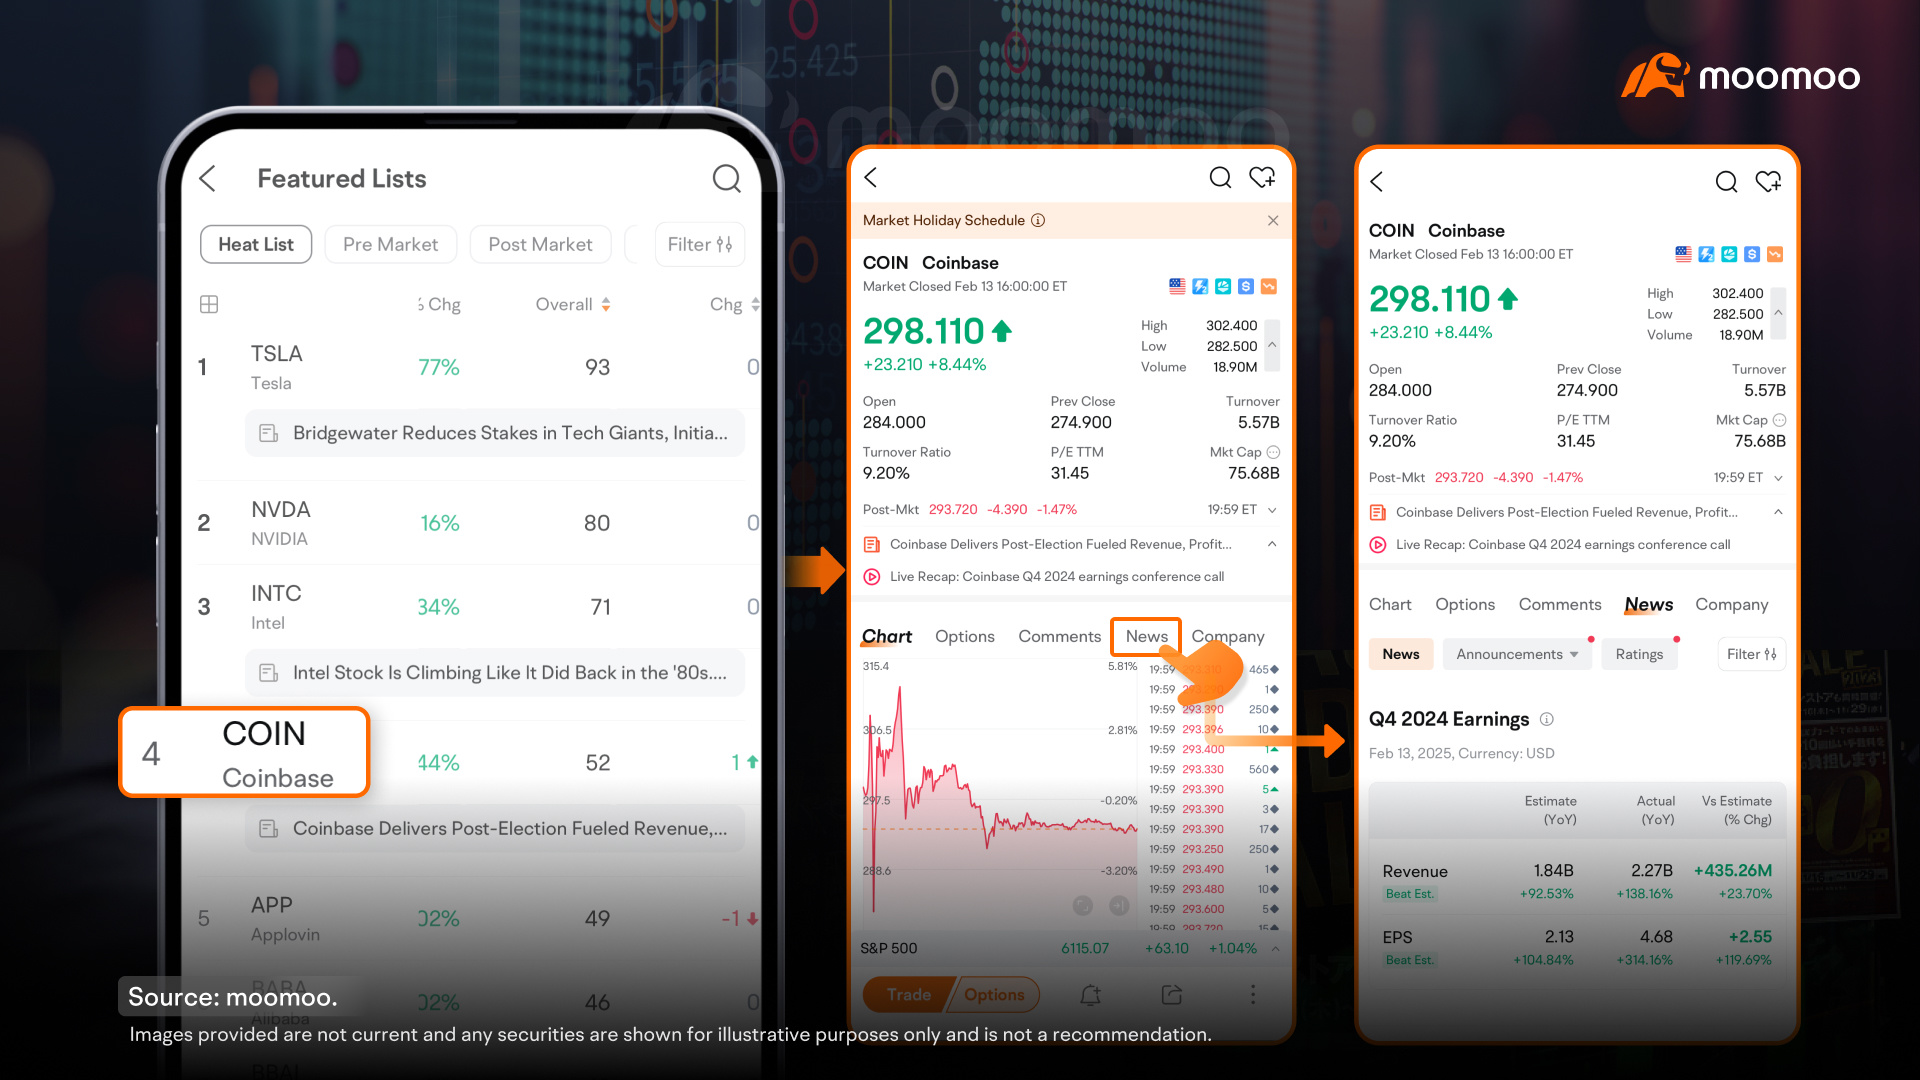
It's important to be aware that stocks ranking high on the Heat List have may have experienced increased price volatility, which could indicate potential higher trading risks.
3. Industry Chain: Examine supply chains and explore connections within industries
The third stock-selection feature to explore is the Industry Chain. It presents the upstream, midstream, and downstream relationships of industry chains and their corresponding stocks. If you're interested in exploring potential investment opportunities in a specific industry chain such as Electric Vehicles, Semiconductors or others, you can use it to identify relevant stocks and investment opportunities.
To access the Industry Chain: Go to Markets> Select a stock market> Tap "Industry Chain".

An industry chain represents a production and supply system, involving multiple divisions and participants who collaborate to complete the research, production, and sales processes of products or services.
An industry chain can generally be analyzed in three divisions: upstream, midstream, and downstream. The development of an industry might initially be driven by certain areas of a particular division, and over time, other divisions and areas could potentially benefit.
For example, when ChatGPT gained significant attention in 2023 and sparked interest in the Artificial Intelligence (AI) industry, the upstream AI infrastructure division saw notable growth. As the AI industry continues to develop, companies in the algorithm and application division may potentially see benefits, according to the Industry Chain.
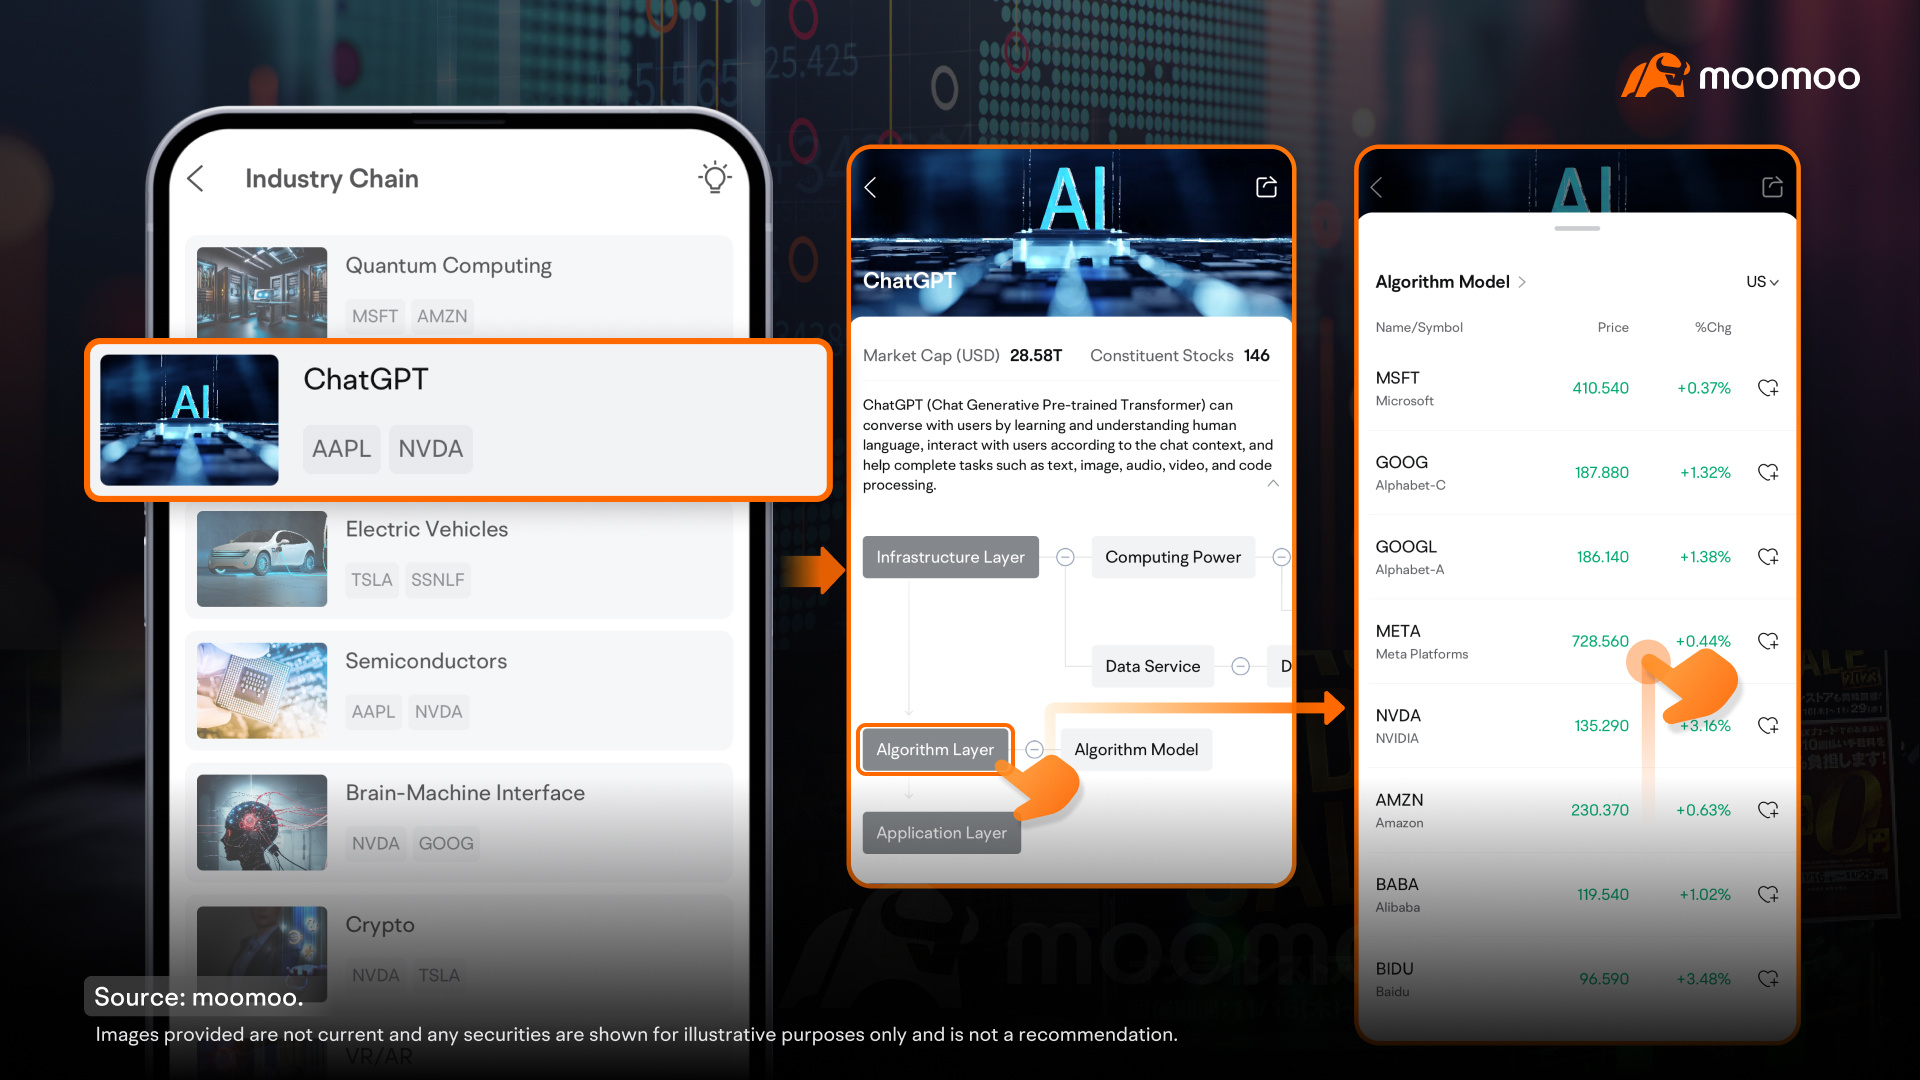
Note: Industry chain relationships are complex. The Industry Chain feature is for reference only and should not be used as the sole basis for investment decision-making.
4. Investment Themes: Follow market topics and discover stocks grouped by themes
The fourth stock-selection feature is the Investment Themes. It lists related stocks based on investment themes that have gained attention in the market. If you're interested in these themes, you can use the Investment Themes to explore potential stocks.
To access the Investment Themes: Go to Markets> Select a stock market> Tap Investment Themes.
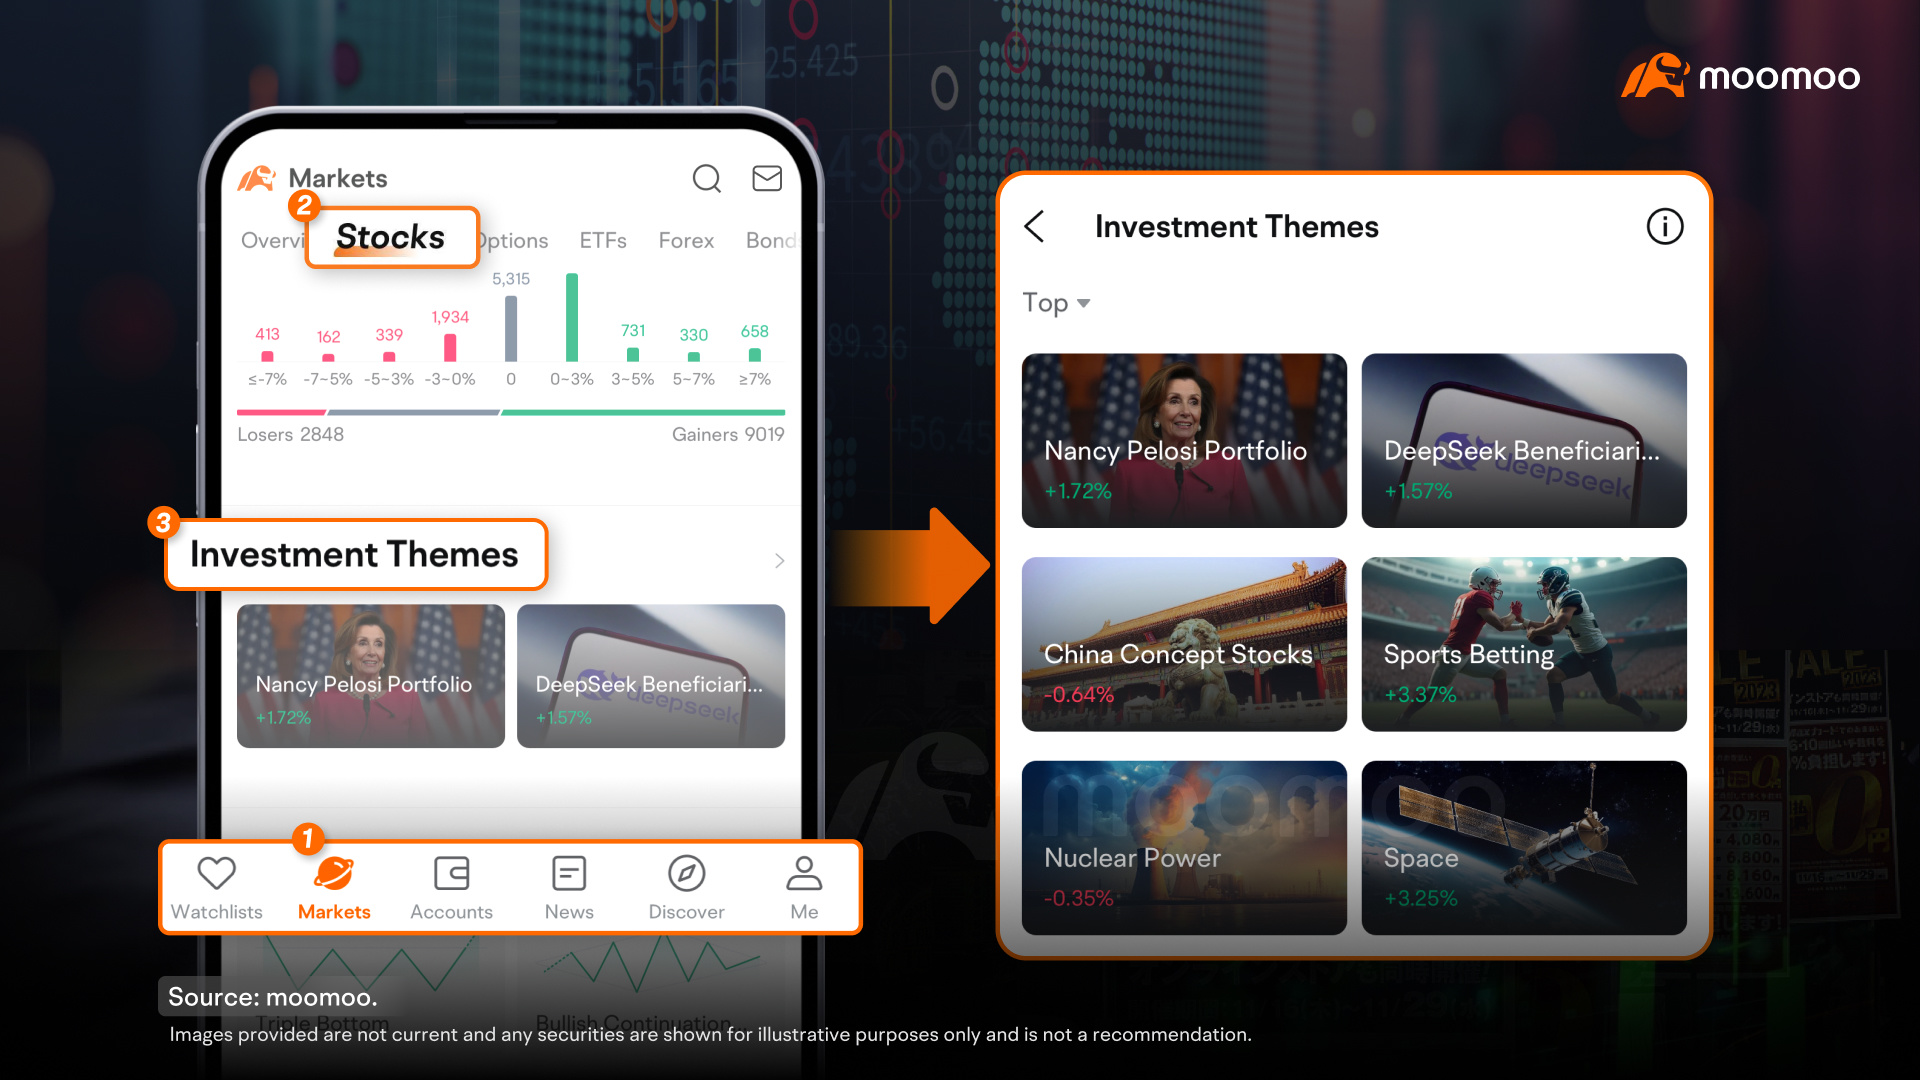
For instance, the Japanese stock market experienced significant growth in 2023, reaching levels not seen in over 30 years and attracting global interest. Some investors, including well-known value investor Warren Buffett, increased their investments in Japanese stocks. The Investment Themes include Japanese Companies, which covers the top 20 Japanese companies by market cap listed on U.S. stock exchanges.
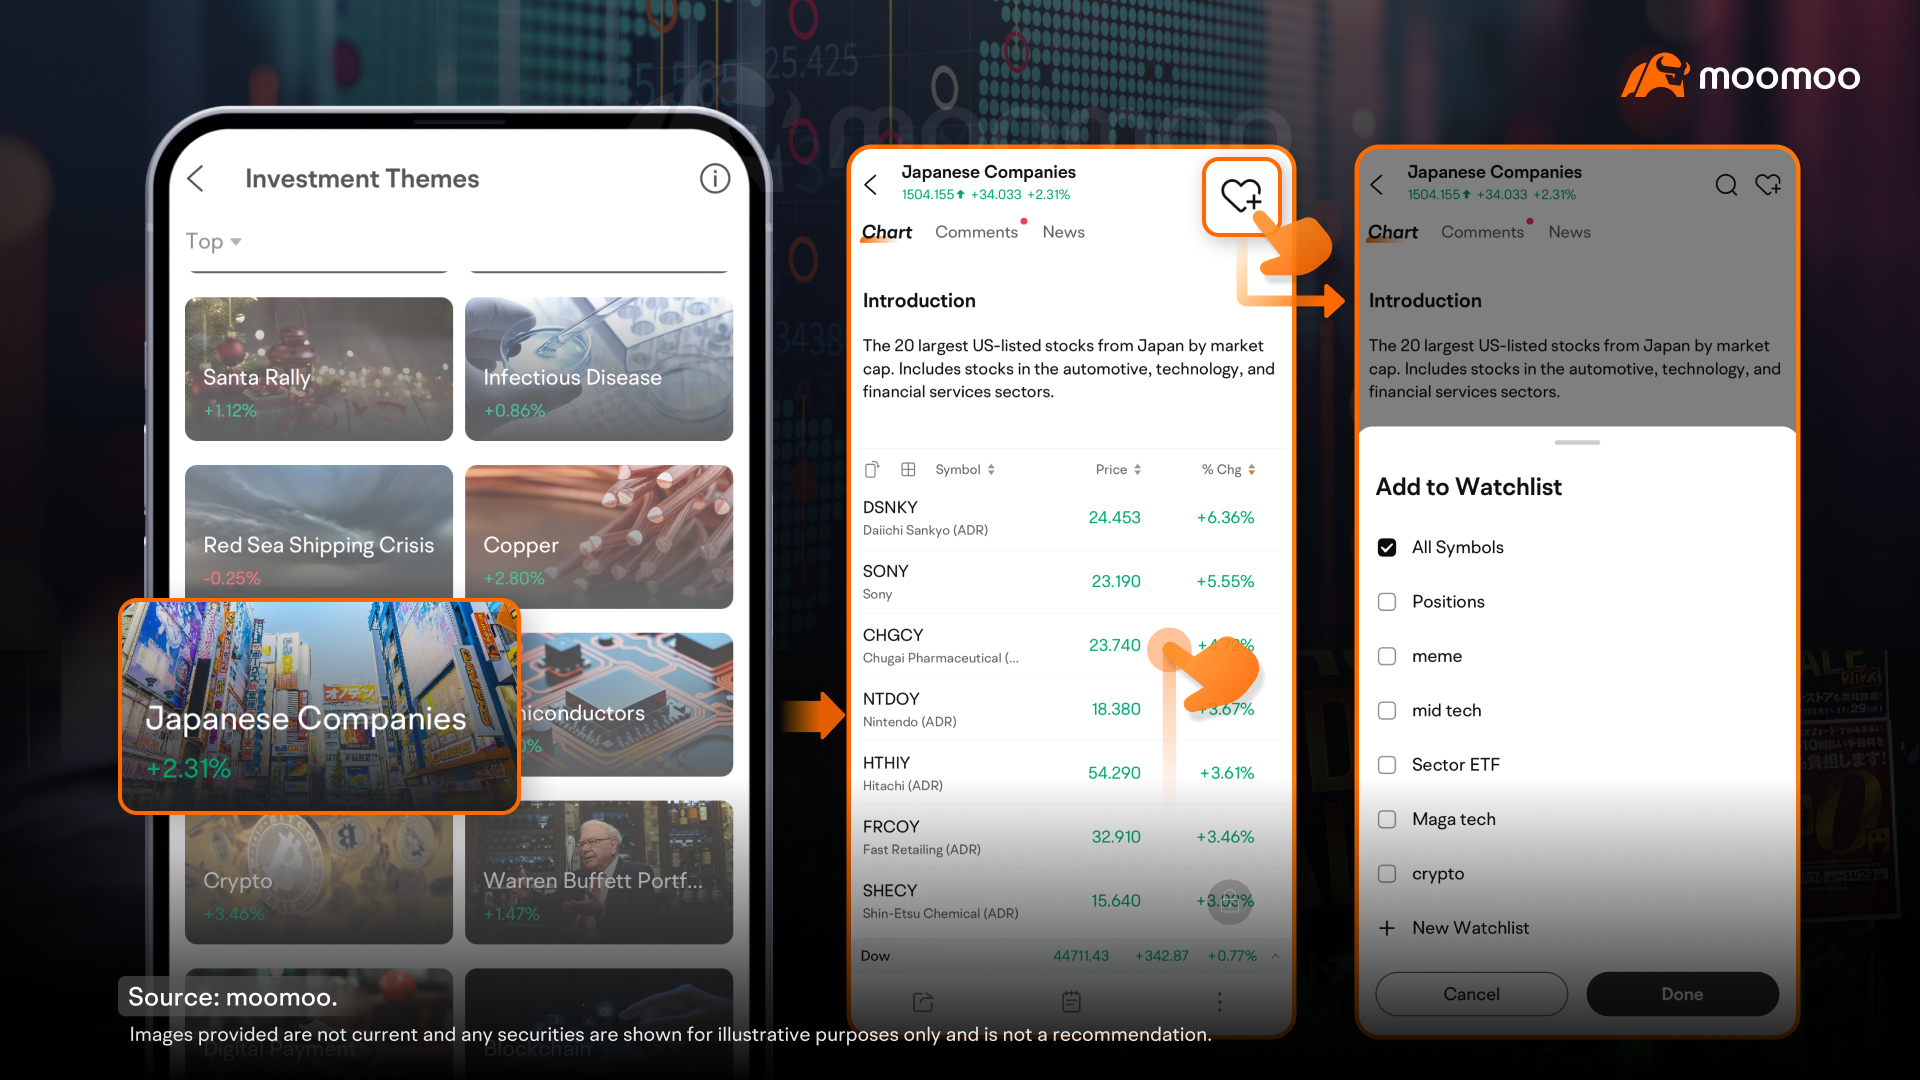
Tap an investment theme to enter its Quotes page, then tap the "Heart" button at the top right to add it to your Watchlists. This allows you to monitor the performance of multiple related stocks efficiently.
5. Stock Screeners: Customize your search and filter stocks based on specific criteria
The fifth stock-selection feature is the Stock Screeners. It offers a large selection indicators that allow you to customize stock selection strategies. If you have specific stock selection criteria in mind, you can create a screener and save it to your list. Or you can select one of the preset screeners.
Access the Stock Screeners: Tap Search at the top right> Select Screeners> Tap Create Screener.
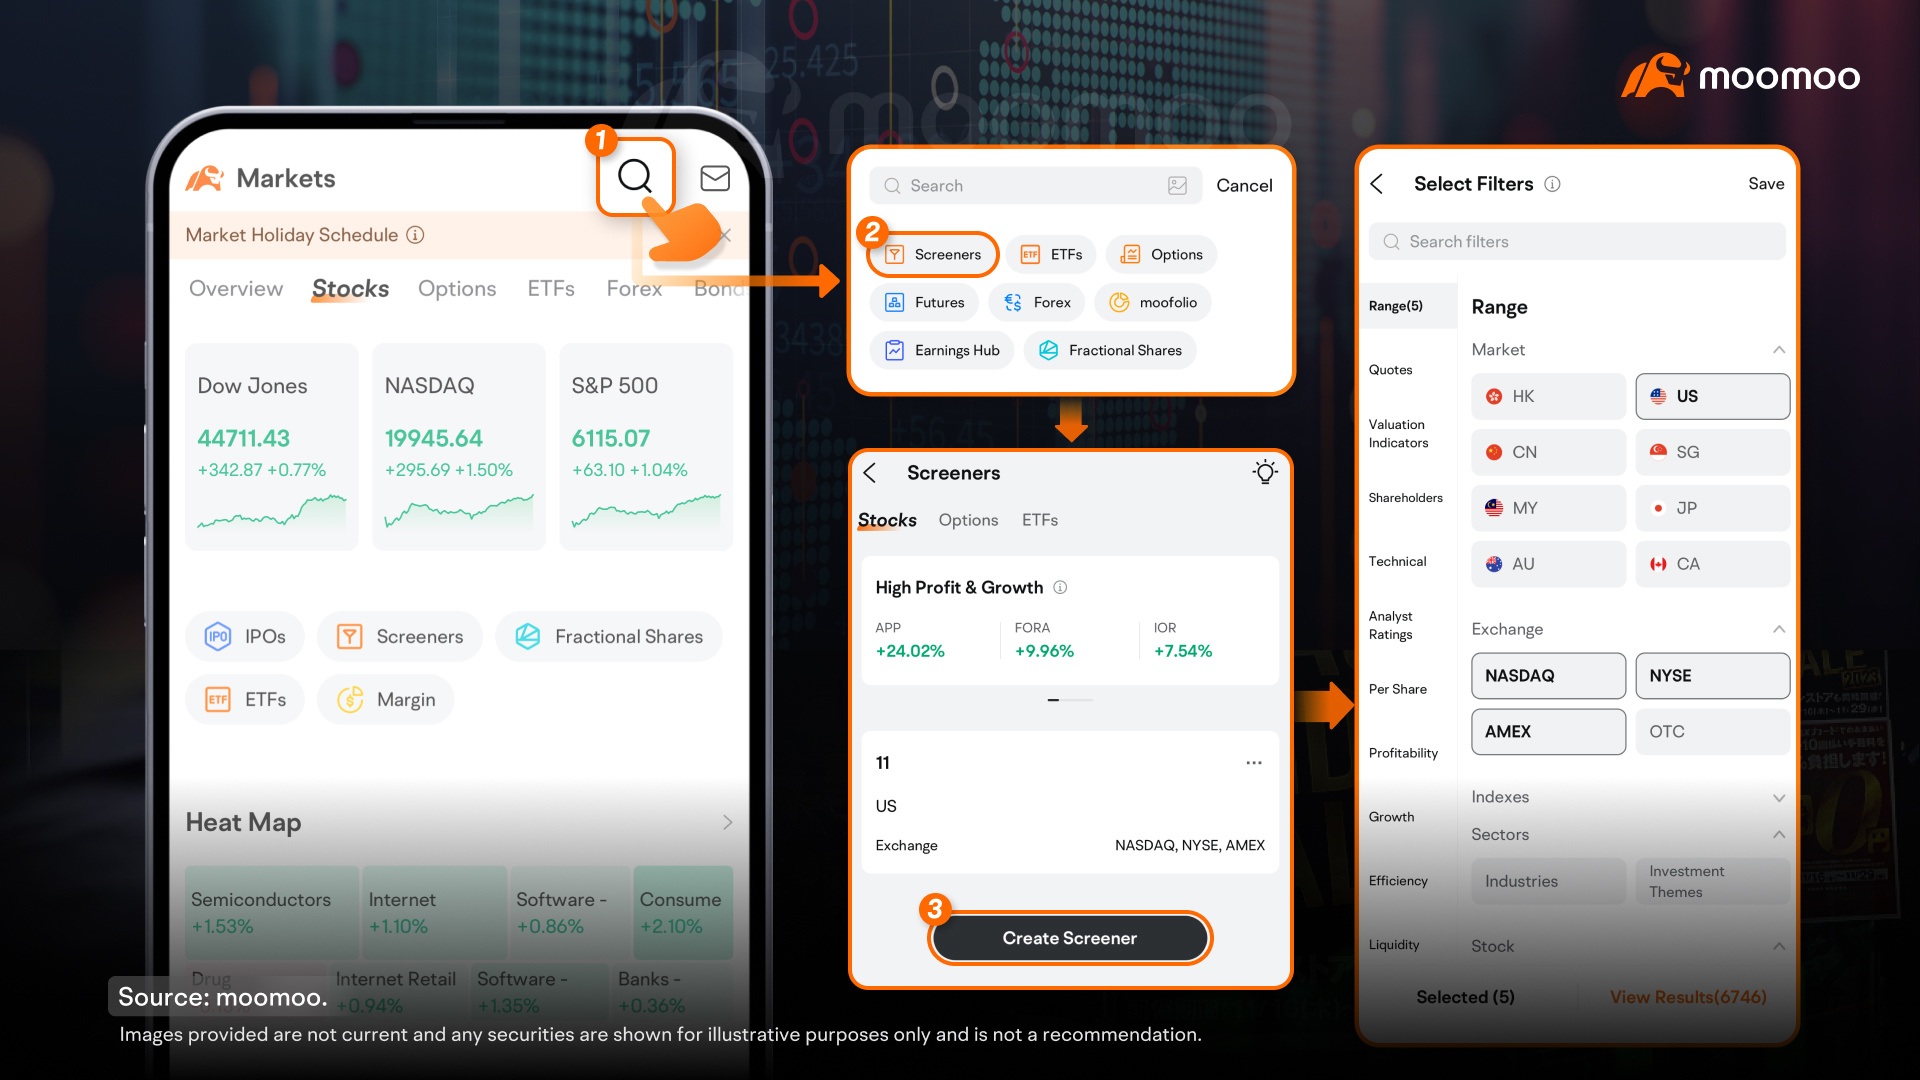
The Stock Screeners function as a filtering tool. You can select a series of conditions, such as industries, valuation indicators, profitability, etc., and it will help you identify stocks that meet these criteria simultaneously.
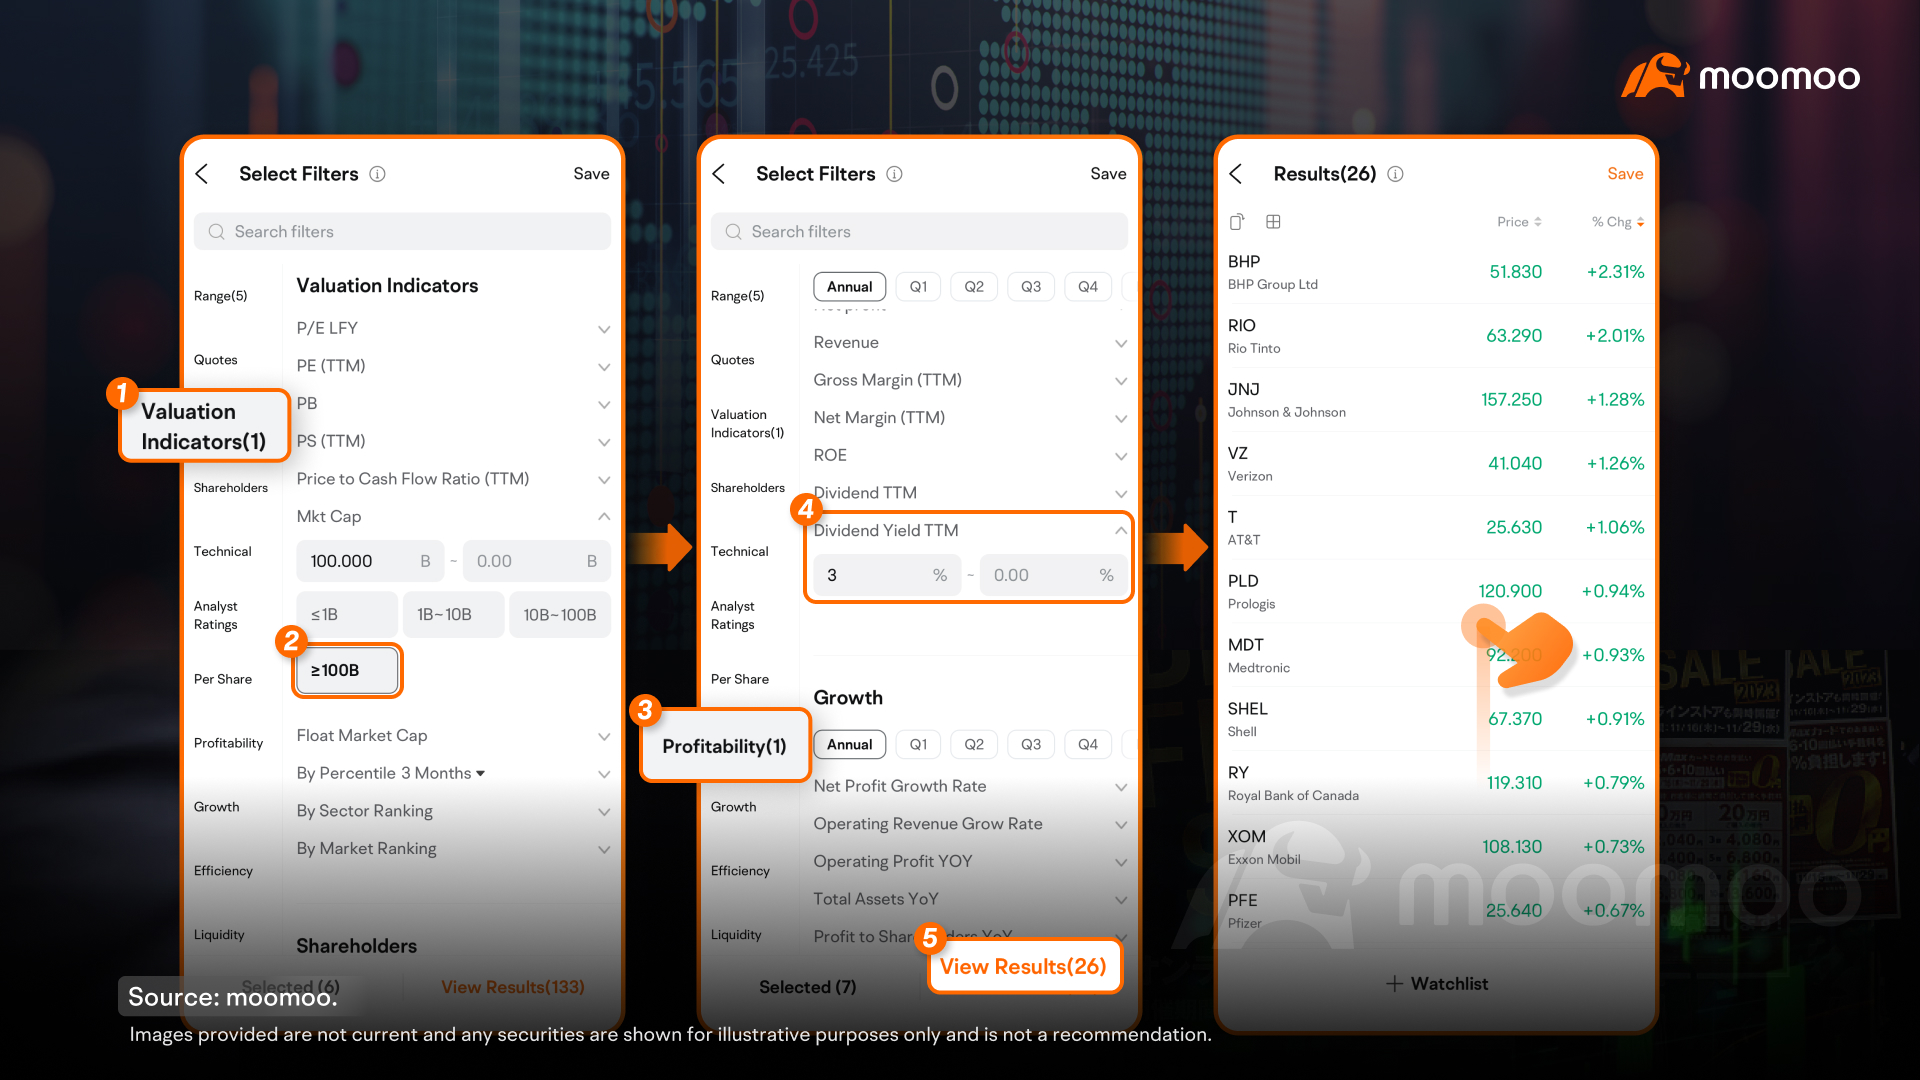
For instance, if you're looking for U.S. stocks with a market cap over $100 billion and a dividend yield over 3%, you can set up the screener as follows:
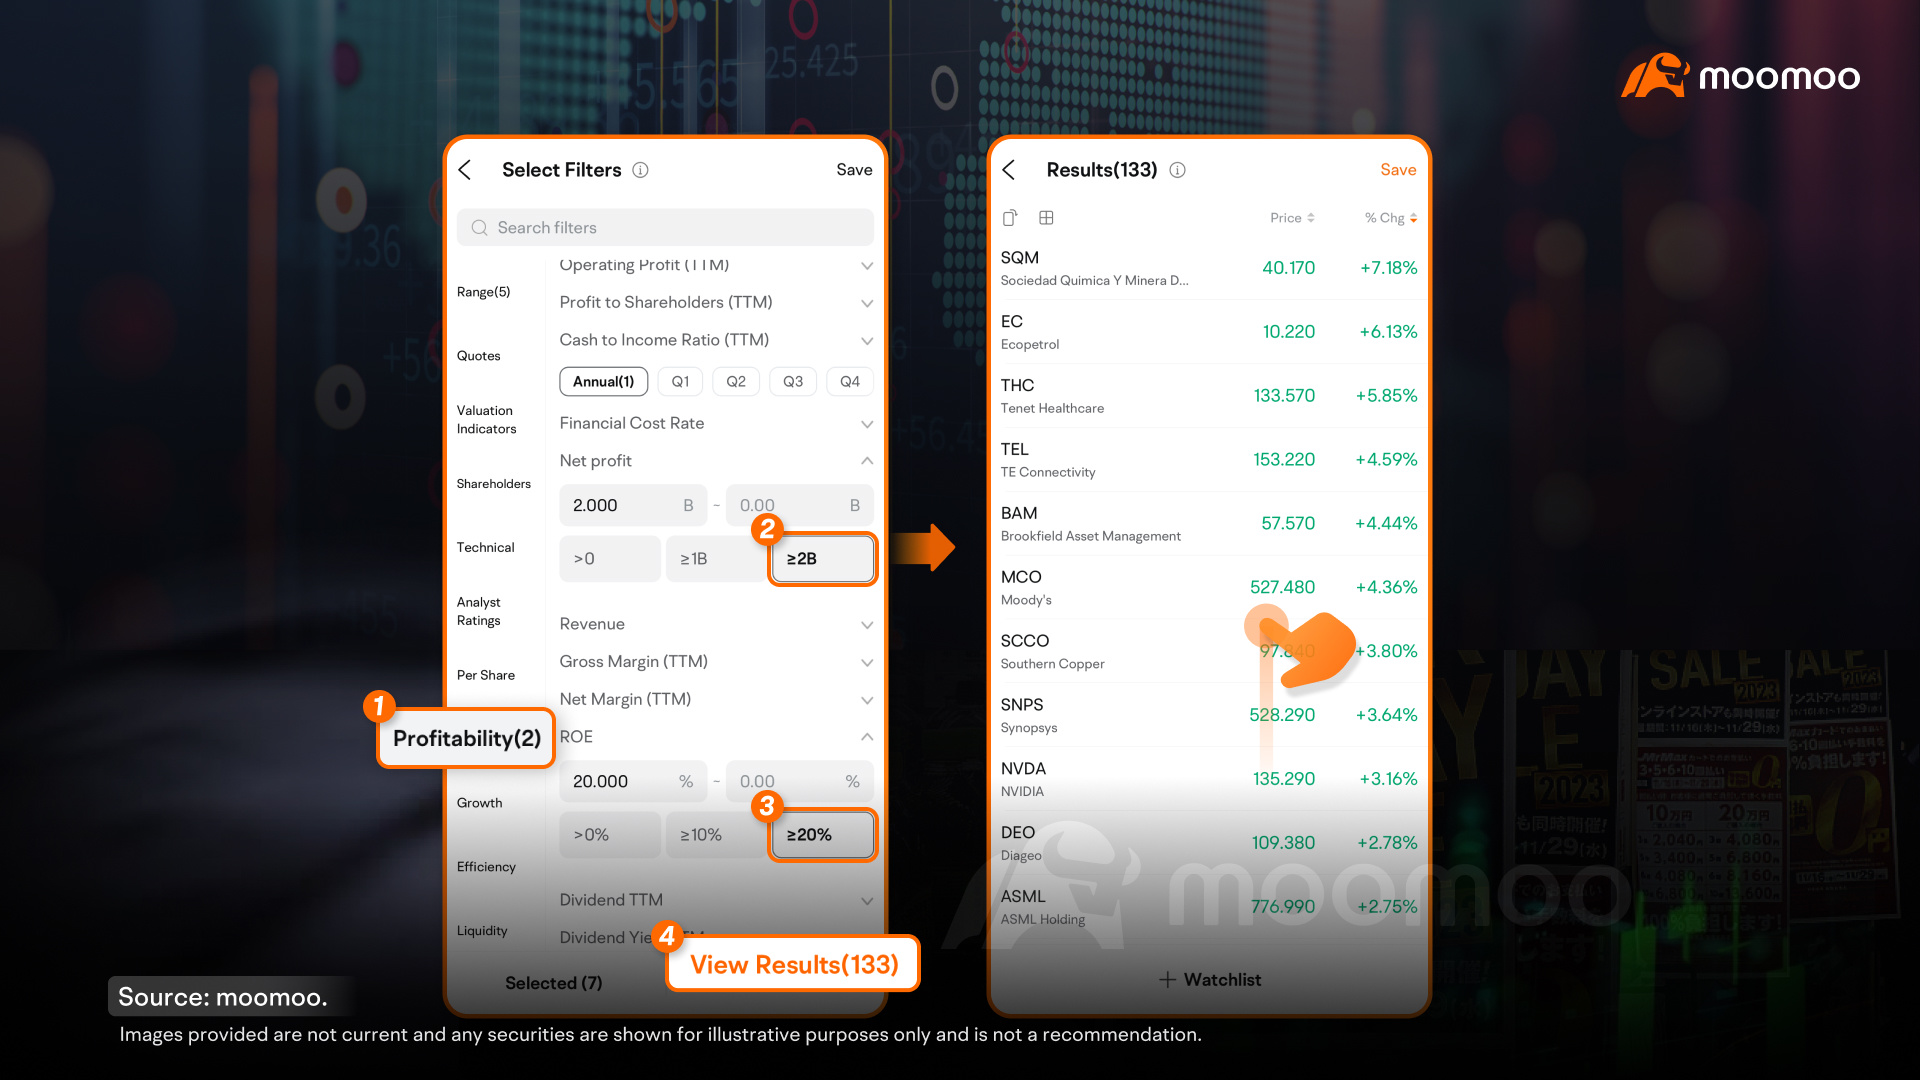
Another example: to find U.S. stocks with annual net profits over $2 billion and a return on equity (ROE) over 20%, you can configure the screener like this:
The Stock Screeners are versatile and can be a comprehensive stock-selection tool. There are several preset stock-selection strategies available on moomoo. You can tap the Info icon next to each strategy to view detailed information.
This presentation is for informational and educational use only and is not a recommendation or endorsement of any particular investment or investment strategy. Investment information provided in this content is general in nature, strictly for illustrative purposes, and may not be appropriate for all investors. Read more