What is Options Chain and How to Use?
Key Takeaways
- Options chain explained with strike prices, expirations, and premiums in one organized view for smarter options trading.
- Analyze trading opportunities by using risk-reward, volatility, and liquidity insights to build effective options strategies.
- Moomoo options chain provides real-time data, customizable layouts, and P/L analysis to trade with confidence.
- Options chain explained with strike prices, expirations, and premiums in one organized view for smarter options trading.
- Analyze trading opportunities by using risk-reward, volatility, and liquidity insights to build effective options strategies.
- Moomoo options chain provides real-time data, customizable layouts, and P/L analysis to trade with confidence.

What is an Options Chain?
Learning to read and analyze an options chain is one of the first steps for anyone entering the options market. An options chain shows all available contracts for a given stock or ETF, usually in a table sorted by expiration dates and strike prices. Each row provides key details such as current premiums, trading volume, and implied volatility (IV) for both calls and puts.
Although the layout may seem overwhelming at first, becoming familiar with it helps traders quickly evaluate opportunities and manage risk. With the growing popularity of options among retail investors, mastering the options chain has become a vital skill for expanding beyond traditional stock trading.
Why Use Options Chain to Find Profitable Trades?
Options chains bring together the most important data points in one place, making it easier to compare different contracts. By studying strike prices, liquidity levels, volatility measures, and Greeks, traders can uncover insights into market sentiment, identify mispriced options, and design strategies with favorable risk-reward profiles. In short, options chains provide the foundation for smarter, more informed trading decisions.
Comparing the Implied Volatility by the Options Chain
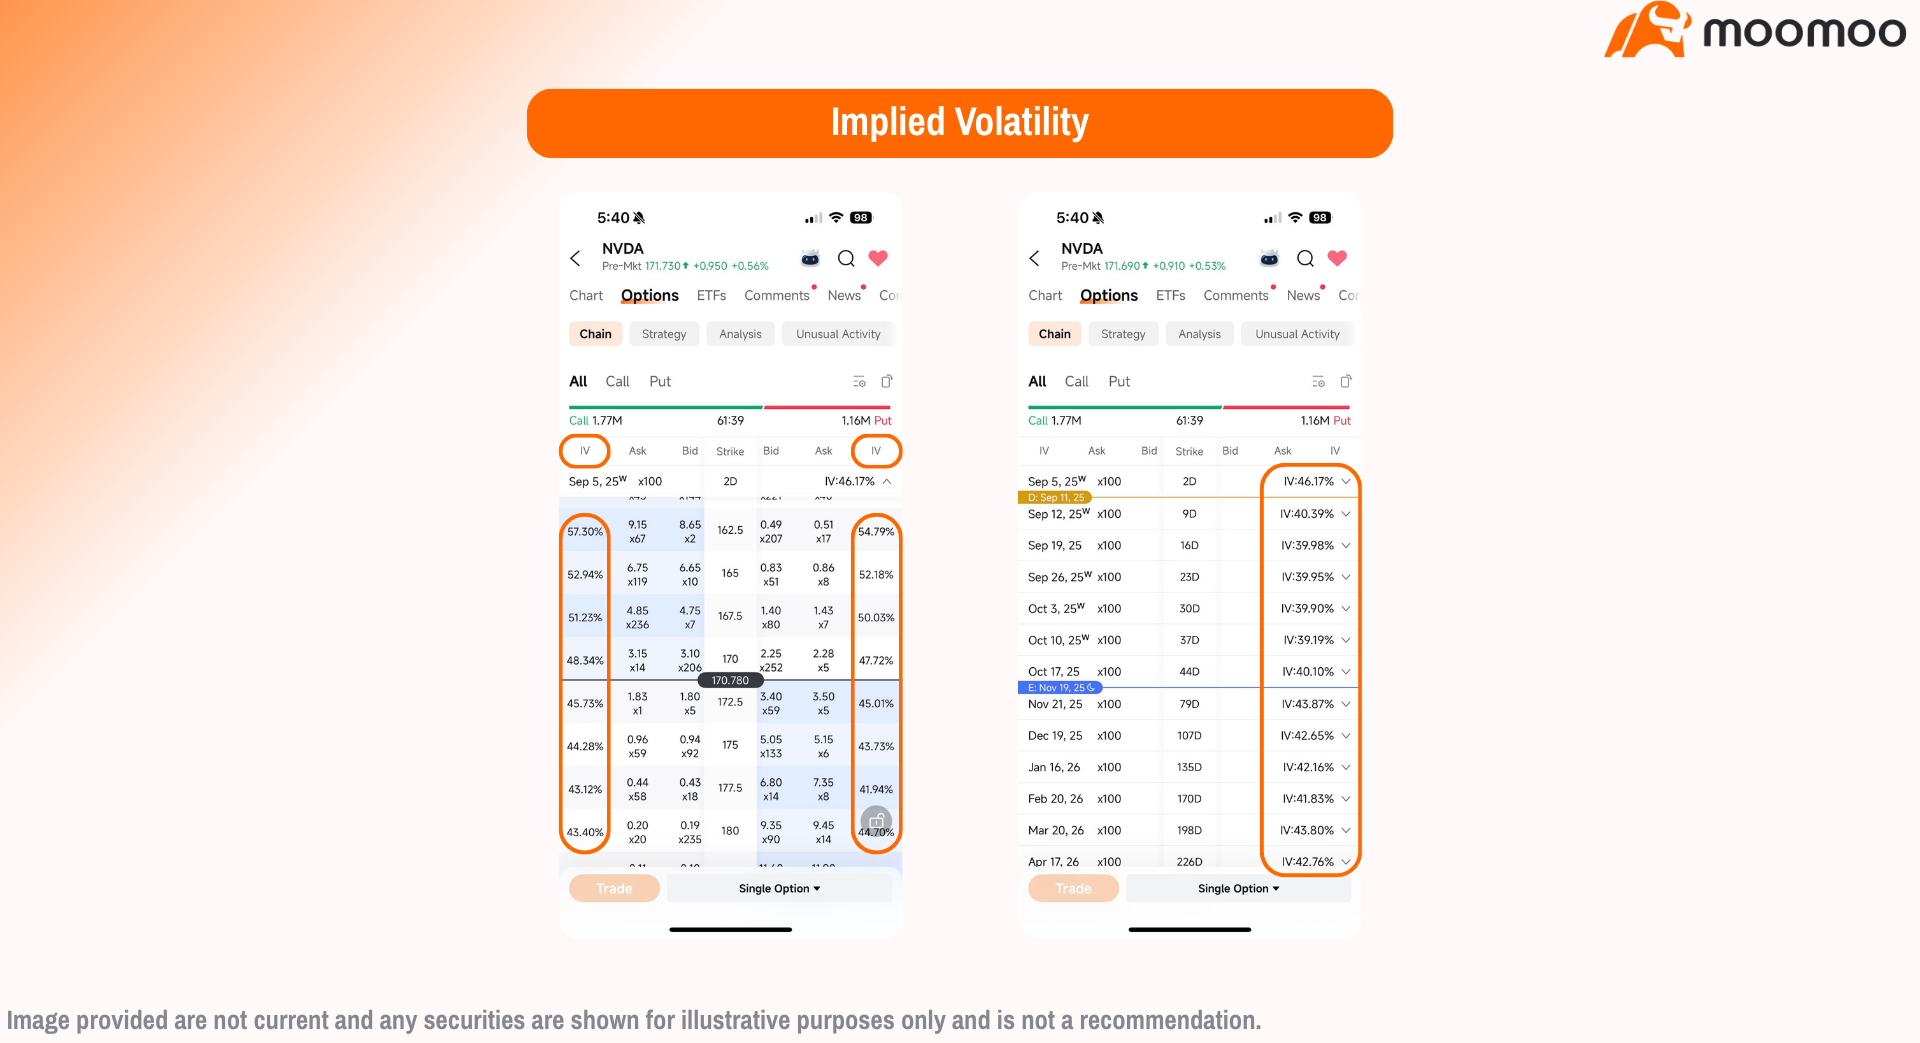
The options chain allows you to see the implied volatility (IV) for each individual strike and expiration. Comparing these IVs can help identify relative pricing differences between contracts. For example, if certain strikes show unusually high IV compared to nearby strikes, it may suggest the market is pricing at greater risk or potential movement for that price level. Conversely, a lower IV may indicate less expected movement.
By reviewing IV across strikes and expirations, traders can better assess which options are relatively expensive or cheap and identify opportunities for spreads, hedges, or other strategies.
Tips: While the chain shows IV at the strike level, moomoo's Volatility Analysis tool provides a broader view of the underlying security's IV trends, comparing current implied volatility with historical volatility and showing IV rank and percentile. Together, these tools give both detailed and big-picture insight into market expectations.
Risk-Reward Ratios Using Options Chain (P/L Curve)
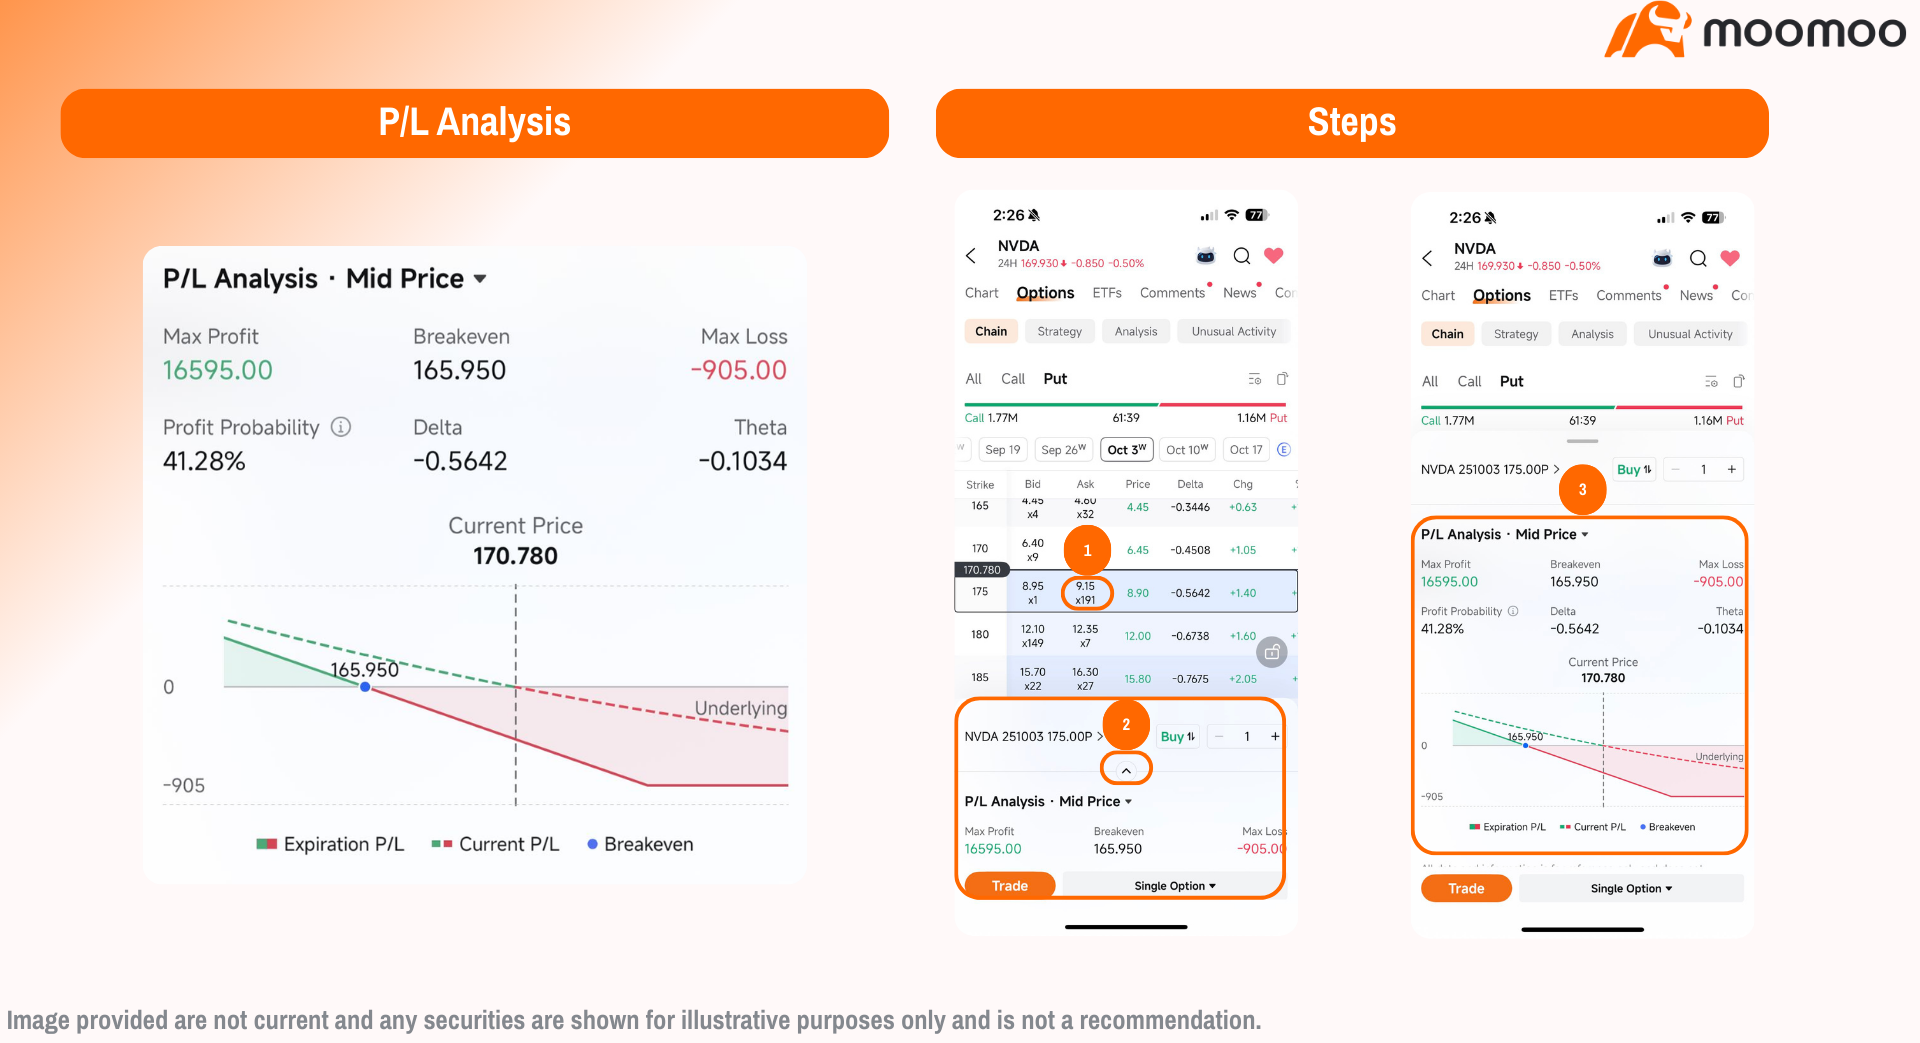
Moomoo's options chain lets traders explore potential profits and losses across a variety of strategies. The platform provides 12 built-in default strategies, including Single Option, Vertical Spreads, and others, as well as the ability to create custom strategies for any selected underlying stock or ETF.
To better understand how these strategies perform, the P/L Analysis tool can be used to visualize potential outcomes. It shows how strategies might perform at various underlying prices, both current and at expiration, and highlights breakeven points, potential gains, and potential losses (including maximum loss). This allows you to compare strategies side by side—for example, examining how the capped gains of a bull call spread contrast with the upside of a long call, while also seeing the maximum risk involved.
To explore a strategy, simply tap its bid or ask price. The trade dialog will appear at the bottom of the screen, and you can scroll up to view the full P/L analysis, providing a clear view of potential outcomes before placing an order.
How to Use the Options Chain: Step-by-Step Guide
Using an options chain effectively involves navigating its layout, filtering data, and leveraging platform-specific tools to make informed decisions. Below is a step-by-step guide, with a focus on utilizing moomoo's options chain for ease and efficiency. Moomoo's platform streamlines the process with intuitive features like real-time data, customizable views, and integrated analysis tools, making it accessible for both beginners and experienced traders.
Start with the Default View and Filter Calls or Puts
When you open the options chain, moomoo shows all options for the nearest expiration date by default, with calls and puts displayed side by side or in separate tabs, organized by strike prices. To focus on your analysis, use the toggle at the top to switch between Call or Put. This filtering narrows down the contracts, making it easier to analyze.
Choose Your Expiration Date
Tap the expiration selector above the chain to cycle through available dates, including weekly, monthly, or quarterly expirations. On moomoo, this selector is clearly displayed, helping you assess how time decay or implied volatility (IV) changes across expirations, so you can align your trade with your market outlook.
Spot ITM, ATM, and OTM Options
Moomoo uses color-coding to make option types clear: in-the-money (ITM) options are highlighted in blue, out-of-the-money (OTM) options appear in white, and at-the-money (ATM) options are near the current stock price. This visual aid helps you quickly identify ITM options or OTM options, streamlining your decision-making process.
Dive into Key Metrics in Options Chain
Scroll horizontally to view all essential data in one place, including bid/ask prices, volume, open interest, implied volatility, and Greeks. Moomoo's real-time updates let you align these metrics with your market outlook, making it easy to assess which contracts fit your strategy without navigating away from the chain.
Analyze and Select Strategies
At the bottom of the chain, switch to different options strategy views for a tailored display, such as vertical spreads, short puts, or covered calls. Moomoo supports 12 built-in strategies and custom setups. Tap a bid or ask price to open the trade bar, where you can adjust buy/sell, contract size, and preview P/L estimates using the integrated P/L Analysis tool. This tool visualizes breakeven points, potential gains, and maximum losses, helping you evaluate strategies
Preview and Execute Trades
After selecting a contract or strategy, tap the bid or ask price to open the trade bar and preview outcomes. Tapping Trade leads you to the Order Page, where you can adjust the order type (e.g., limit or market), price, contract size, and other advanced order settings (e.g., time-in-force). Once these details are set, tap Buy or Sell to place the order, streamlining the process from analysis to execution.
Where to Find the Options Chain
To begin using the options chain on Moomoo, follow these steps:
Open a stock's Detailed Quotes page by entering the stock's ticker symbol (e.g., NVDA for NVIDIA) in the Moomoo app or website.
Tap Options at the middle of the page, then select Chain to access the full options chain for the selected stock or ETF.
This straightforward navigation ensures you can quickly access the chain and start analyzing contracts without unnecessary steps.
How to Utilize the Options Chain Easily with Moomoo
Moomoo's options chain is designed for ease and efficiency, particularly through its highly customizable interface, which allows traders to tailor the layout to their specific needs. By accessing the Settings icon in the top right corner, you can filter by weekly, monthly, or quarterly expirations to focus on your preferred timeframe, adjust the scrolling direction for better readability, or limit the display to in-the-money (ITM) or out-of-the-money (OTM) options to reduce clutter. You can also rearrange columns to prioritize metrics like Turnover, Open Interest (OI), or Implied Volatility (IV), and toggle visual aids like call/put volume bars or price line markers to highlight key data. This flexibility ensures the options chain aligns perfectly with your trading style, whether you're focusing on specific expirations, liquidity, or volatility, making it a powerful tool for efficient decision-making.
How to Customize the Layout of Options Chain
To personalize the options chain, tap the Settings icon in the top right corner of Moomoo's chain interface. Here's how to make it fit your trading style:
Filter expirations using Expiration Type to select weekly, monthly, or quarterly options, focusing on timeframes that suit your strategy. You can also choose between tab view or list view for the expiration date layout to streamline navigation.
Adjust the scrolling direction to Mirror or Follow based on your preference, or tailor the overall layout with Straddle View or Parallel View for column arrangements, simplifying the comparison of calls and puts or strategy analysis.
For strikes, set Strike Settings to limit the number of contracts shown, display only in-the-money (ITM), out-of-the-money (OTM), or all options, sort them in ascending or descending order, or choose how many strike prices to display, keeping the chain clear and relevant.
Rearrange columns to prioritize metrics like Turnover, Open Interest (OI), or Implied Volatility (IV), placing the most important data front and center.
You could toggle visuals on or off, including Call & Put Volume bars, Underlying Price Bar, non-standard options, earnings release marking, and corporate action indicators, to highlight key information for your decisions.
Nvidia Options Chain Example
Suppose you own NVIDIA Corporation (NVDA) shares and want to explore put options to protect against a potential decline next month. Moomoo's options chain provides a suite of tools to analyze and execute this strategy efficiently for a high-liquidity. Here's how moomoo's option chain support your analysis:
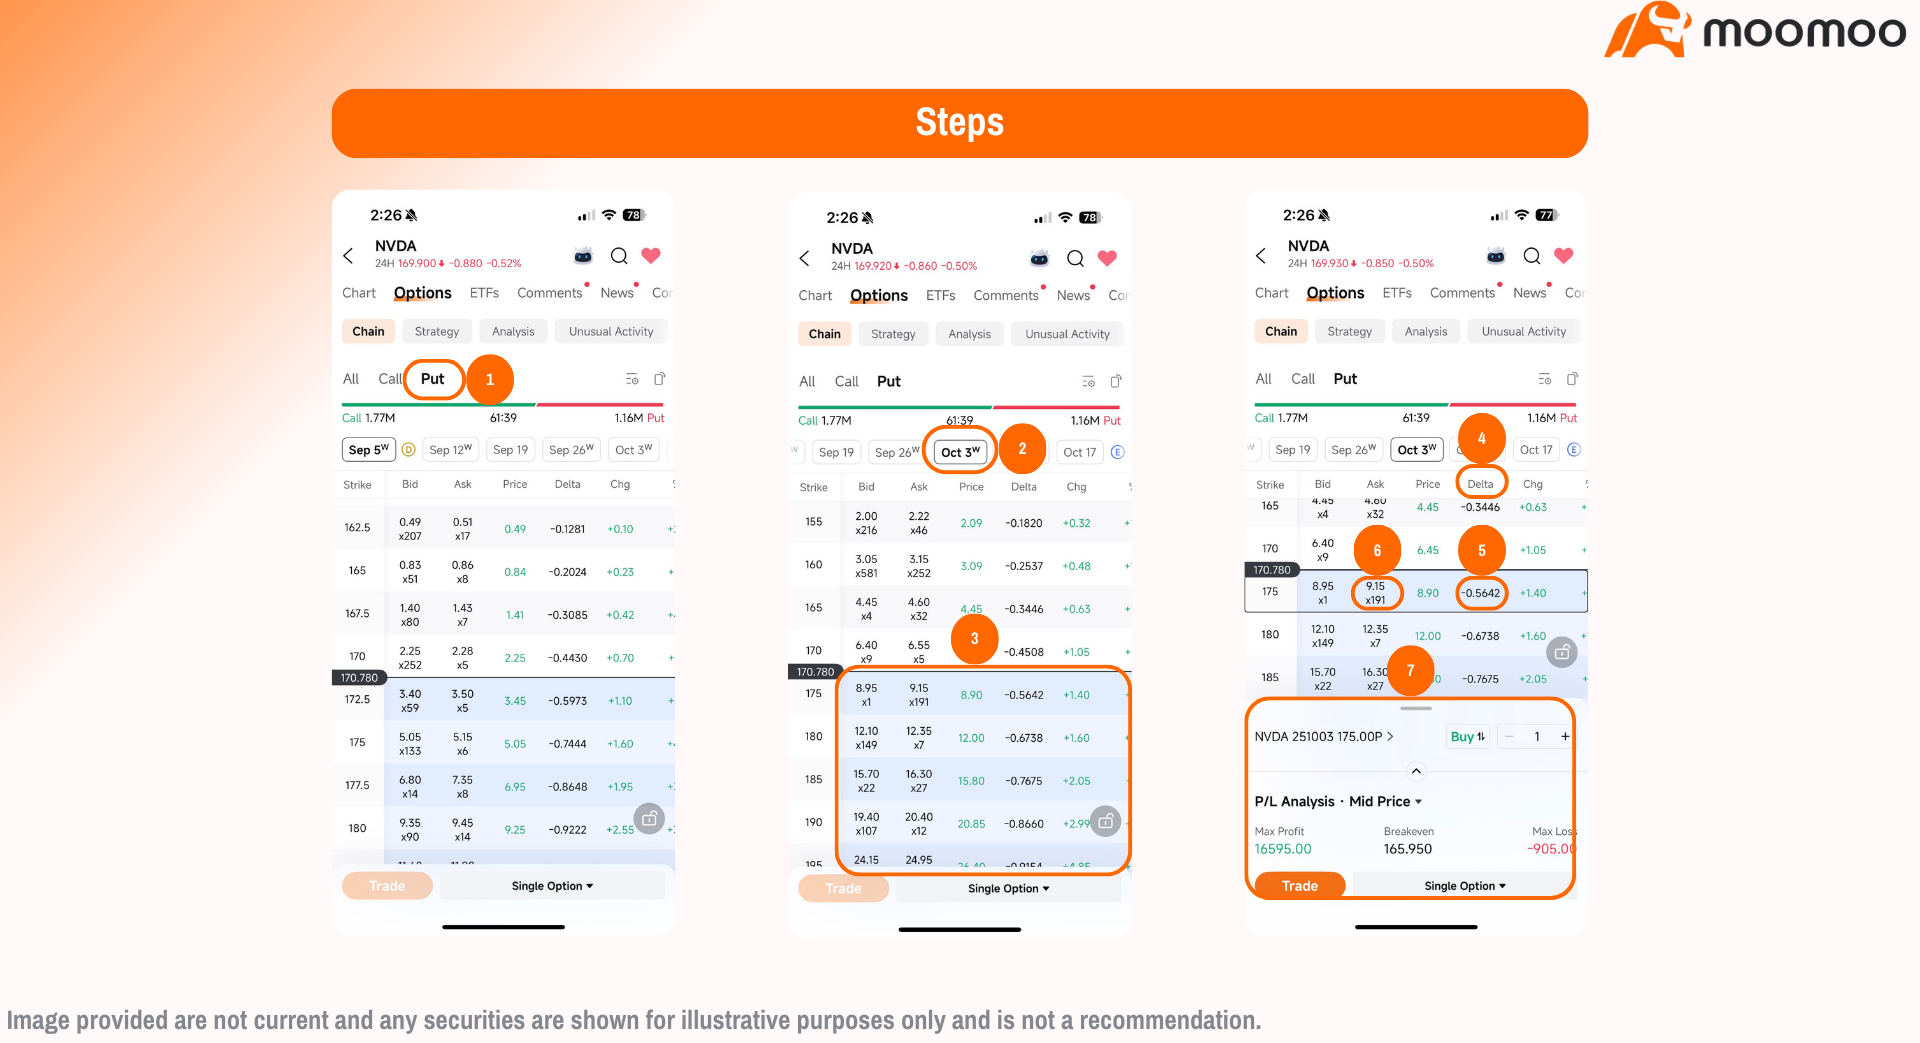
Access and Analyze Puts: Navigate to NVDA's put options via the options chain. For example, if you want to focus on puts, you might use the toggle to filter out calls
Evaluate Expirations: Explore expiration dates using the selector for weekly, monthly, or quarterly options. For instance, if you're targeting a one-month horizon, you might find the expiration date nearest to 30 days or above to align with your timeframe.
Compare Strikes: Use color-coded indicators (ITM in blue, OTM in white) to identify strike prices, with metrics like IV and open interest shown clearly. For example, if you want to hedge with a 60-delta put option, you might check the Delta column to find an in-the-money put with a delta near 0.60, focusing on blue color-coded options.
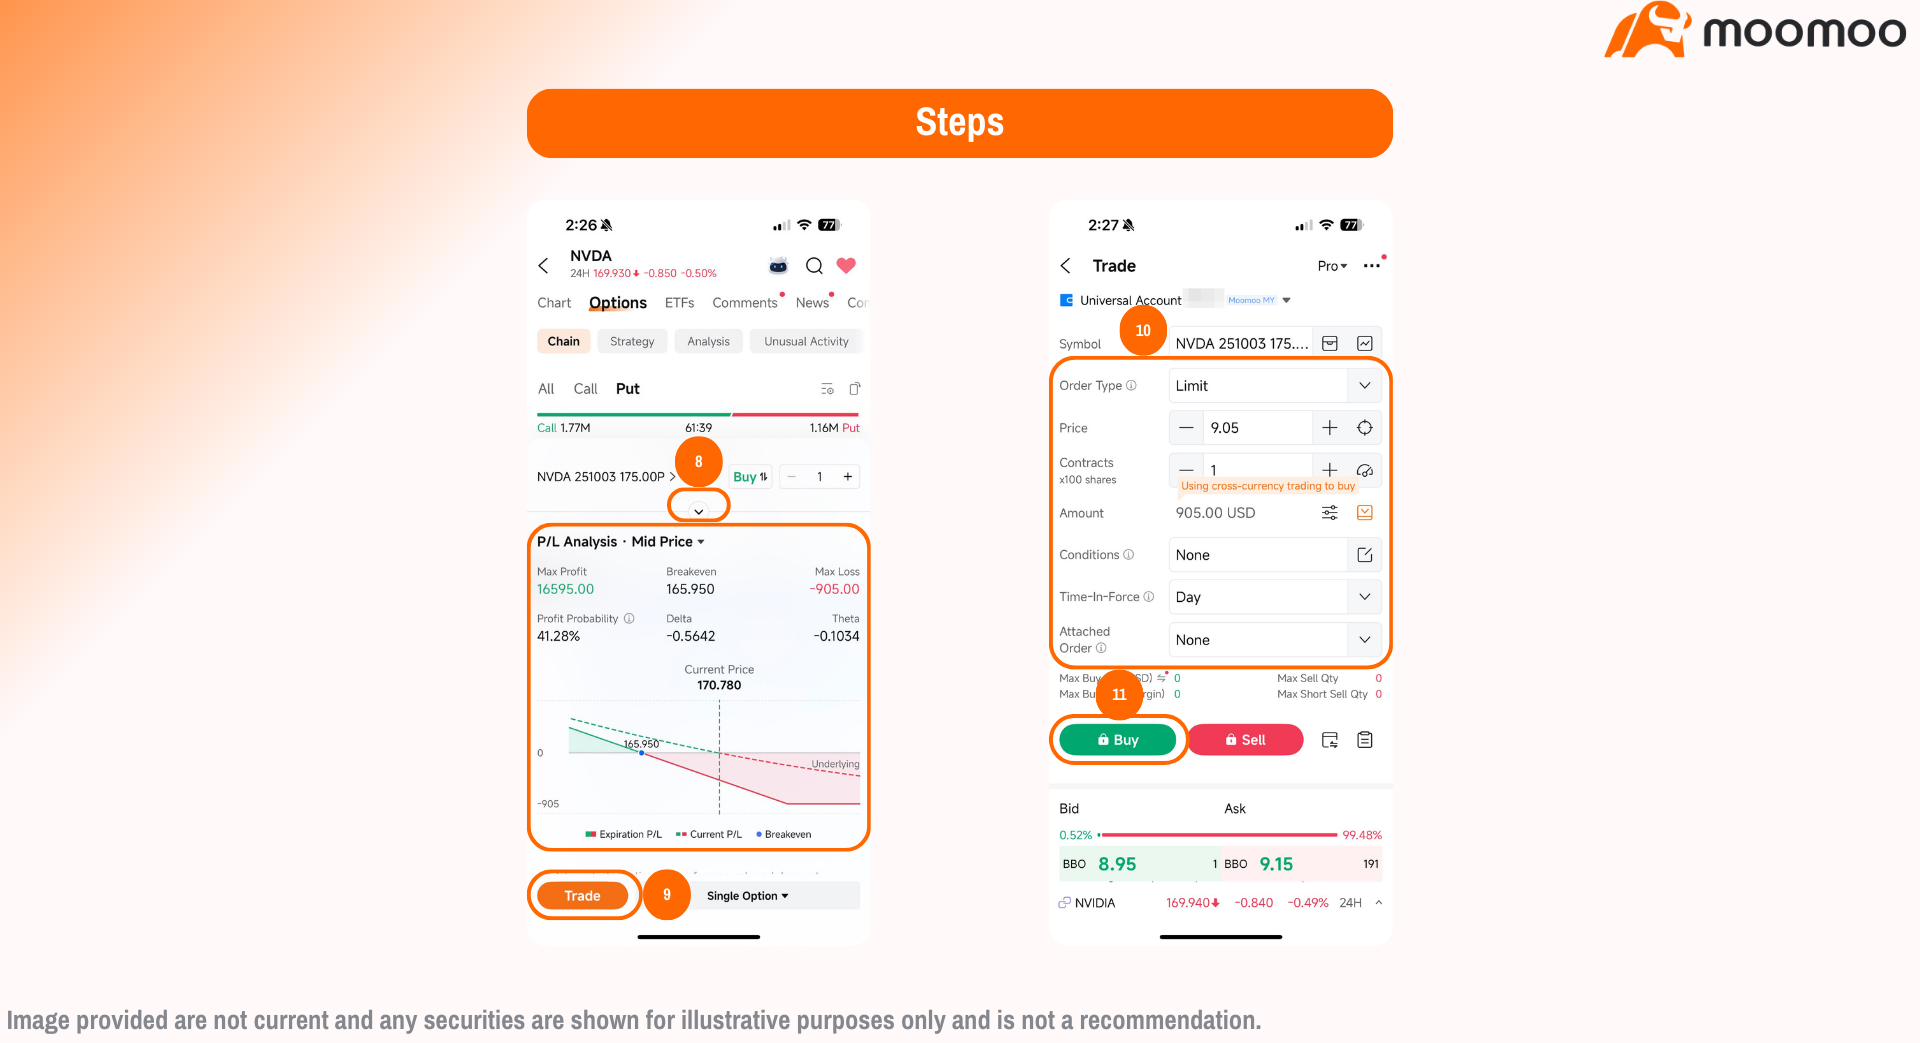
Visualize Outcomes: Tap a contract's bid or ask price to access the P/L Analysis tool. For example, if you're evaluating a put, you might review the visualized premium costs and breakeven points to understand potential outcomes if NVDA's price changes.
Execute Efficiently: Once you've confirmed your contract choice, tap Trade to move to the Order Page and fill out details like order type or contract size. For example, if you own 100 NVDA shares and want to hedge 60%, you might select one contract of a 60-delta put option and choose a limit or market order at based on your preference.
How to Read Options Chains
An options chain is a table showing all available contracts for a stock or ETF, organized by expiration date and strike price. To trade effectively, it's essential to understand the key parts of the chain:
Expiration Date: Last valid day for the contract.
ITM vs. OTM: Color-coded for quick recognition of intrinsic value.
Price Metrics:
Strike Price – Level at which the option can be exercised.
Bid – Highest price buyers will pay.
Ask – Lowest price sellers accept.
Last Price – Most recent transaction.
Liquidity:
Volume – Number of contracts traded today.
Open Interest (OI) – Total active contracts outstanding.
Greeks: Delta, Gamma, Theta, Vega (measure sensitivities to price, time, and volatility).
Volatility (IV): Market's expectation of future price movement.
Best Stocks Trading Options by Volume: Option Chain Insights
If you already have a specific stock in mind, the options chain is the most direct way to review strike prices, expirations, and premiums. But if you're still scanning the market for ideas, Moomoo's Top Stocks by Options Volume offers a clear snapshot of where trading activity is concentrated. High options volume can signal increased market participation—whether from hedging, institutional strategies, or short-term speculation and may indicate contracts with greater liquidity.
Top 10 Stocks & ETFs by Options Trading Volume (as of Sept 2, 2025):
1. SPDR S&P 500 ETF (SPY) – 7.92M contracts
SPDR S&P 500 ETF (SPY) tracks the S&P 500 Index and is the most actively traded ETF in the world. Its large volume reflects its use in index hedging, portfolio management, and exposure to the overall U.S. equity market.
2. NVIDIA Corporation (NVDA) – 4.82M contracts
NVIDIA Corporation (NVDA) is a leading semiconductor and AI company. Its high options turnover is often linked to significant price movements and frequent attention during earnings and product cycles.
3. Invesco QQQ Trust (QQQ) – 4.48M contracts
Invesco QQQ Trust (QQQ) mirrors the Nasdaq-100 Index and regularly sees heavy derivatives activity given its concentration in large-cap technology companies.
4. Tesla Inc. (TSLA) – 3.29M contracts
Tesla Inc. (TSLA) is an electric vehicle and clean energy company. Its historical price volatility contributes to consistently elevated options trading volumes.
5. Alibaba Group (BABA) – 1.27M contracts
Alibaba Group (BABA) is a China-based e-commerce and cloud services provider. Options activity often increases during earnings releases and news affecting China's technology sector.
6. iShares Russell 2000 ETF (IWM) – 1.04M contracts
iShares Russell 2000 ETF (IWM) tracks the Russell 2000 Index of small-cap U.S. companies and is commonly used by institutions to express views on domestic economic trends and market breadth.
7. Opendoor Technologies (OPEN) – 1.02M contracts
Opendoor Technologies (OPEN) operates a digital real estate platform and, despite its relatively modest market capitalization, has experienced periods of high speculative options activity.
8. iShares Bitcoin Trust (IBIT) – 990.63K contracts
iShares Bitcoin Trust (IBIT) is an exchange-traded product providing exposure to Bitcoin's price performance. Its options activity reflects interest in cryptocurrency-linked assets within a regulated ETF structure.
9. Apple Inc. (AAPL) – 951.69K contracts
Apple Inc. (AAPL) is a global consumer technology company. Options turnover remains steady, given its large market capitalization and consistent investor attention during earnings and product announcements.
10. Palantir Technologies (PLTR) – 820.21K contracts
Palantir Technologies (PLTR) is a software and data analytics firm. Options trading in PLTR has been active in line with broader investor focus on artificial intelligence and growth-oriented technology names.
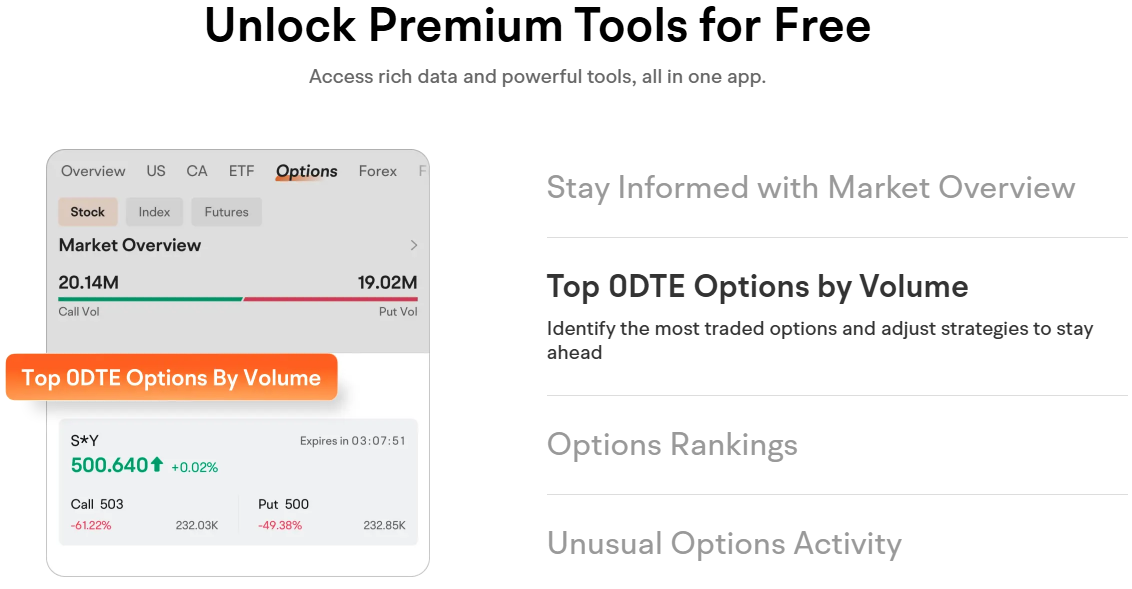
Moomoo's Top Stocks by Options Volume not only shows which tickers are seeing the heaviest options activity, but also gives you a quick read on market liquidity and sentiment. Higher trading volume usually translates into tighter bid-ask spreads, better pricing, and smoother execution—critical factors for active traders looking to move in and out efficiently.
And if a particular ticker catches your attention, just tap the symbol. You'll be taken directly to that stock's full options chain, where you can browse strike prices, expirations, open interest, and premium details to shape your trading strategy with confidence.
Disclaimer: The list above is for informational and educational purposes only. It does not constitute financial advice or a recommendation to trade. Rankings are subject to change frequently, as they are based on options trading volume that fluctuates throughout the trading day.
FAQs on Options Chain
What Is an Option Assignment?
When an option buyer chooses to exercise, the seller (also called the option writer) is “assigned” and must fulfill the contract terms. For calls, this means delivering the underlying shares at the strike price. For puts, it means buying the shares at the strike price. Assignments usually happen close to expiration, but they can occur any time for American-style options.
How Do Dividends Affect Option Prices?
Dividends directly influence option premiums because they reduce the expected forward price of a stock. When a company pays a dividend, call options generally lose value (since the stock is expected to drop by the dividend amount), while put options often gain value. This is especially noticeable for stocks with high or regular dividend payouts.
What's the Difference Between Open Interest and Volume?
Open interest (OI) is the total number of contracts currently outstanding—contracts that have been opened but not yet closed or exercised. Volume, on the other hand, is the number of contracts traded on that specific day. A high volume with rising OI suggests new positions are being built, while high volume with falling OI often indicates closing positions.
Why Do Bid and Ask Prices Differ So Much?
The gap between bid and ask (the “spread”) reflects liquidity. In actively traded contracts, spreads are usually tight, making it easier and cheaper to enter or exit positions. Wider spreads typically occur in less popular stocks or far-out-of-the-money strikes, where fewer buyers and sellers exist. Traders should always factor in spread costs, since they directly impact profitability.
Conclusion: Exploring Options Chain
The options chain isn't just a list of contracts—it's a decision-making hub that helps traders connect risk, reward, and strategy. By analyzing strike prices, expirations, volatility, and liquidity all in one place, you gain a deeper view of market sentiment and potential opportunities.
Once you know how to read it, the chain stops being overwhelming and starts becoming a roadmap. With tools like Moomoo's P/L curves, and volatility analysis, you can compare strategies side by side, refine entries, and manage risk more effectively.
In short, mastering the options chain gives you the confidence to move beyond basic stock trading and design strategies with clarity and purpose.
This presentation is for informational and educational use only and is not a recommendation or endorsement of any particular investment or investment strategy. Investment information provided in this content is general in nature, strictly for illustrative purposes, and may not be appropriate for all investors. Read more