How to Calculate Stock Prices with Option Strategies in Malaysia
Key Takeaways
How to calculate the stock price? From options trading, implied volatility (IV) gives the expected move range of stock price. On moomoo, it's auto-generated—no math needed.
Turn market expectations into a clear price range with Expected Move (EM), powered by Implied Volatility (IV).
See EM instantly in moomoo's Options Chain—no math, no guesswork.
Plan trades with Strategy Builder, simulate them with the P/L Curve, and refine with Probability & Volatility Analysis.
Use historical "Expected vs Actual Move" data to sharpen your strategies—especially for earnings season.
Discover a suite of powerful trading tools on Moomoo Desktop, including P/L Curve, Expected Move, Strategy Builder and more.
>> Download moomoo now and claim your exclusive welcome rewards!
>> Download moomoo now and claim your exclusive welcome rewards!
Can Options Predict Stock Movements?
Options don't predict the exact direction of a stock's price—whether it will go up or down—but they provide valuable clues about how much it might move. Options reflect what traders expect through data like option prices and trading activity. For example, if traders are actively buying options before a company's earnings report for a company's stock, it suggests they expect a significant price change, though not necessarily in one direction for the company. This doesn't tell you the stock's exact future price but helps you estimate the range in which a company's stock is likely to trade based on a company's expected price movement. By analyzing this range, you can choose strategies that match your expectations, whether you anticipate stability or volatility.
What is Expected Move (EM)?
An option's price carries important information about what traders think a stock will do in the future. The key driver is implied volatility (IV), which measures how much the market expects a stock's price to fluctuate. By understanding IV and how it shapes the expected move (EM), you can estimate potential price changes and design strategies that align with market expectations, whether you're trading for small or large price movements. In a valuation model, the expected move can help estimate the potential range for the stock's share price.
The expected move (EM) estimates how much a stock's price might rise or fall over a specific period, based on the implied volatility of its at-the-money (ATM) options—those with strike prices closest to the current stock price. It represents a one-standard-deviation range, meaning there's about a 68% probability the stock will stay within that range until the options expire.
For example, if a stock is trading at $50 and the expected move is $3.40, the market expects the stock to stay between $46.60 and $53.40 with roughly 68% probability. In this example, the share price is $50, and the expected move defines the likely trading range for the stock.
Some traders estimate EM manually by adding the prices of the ATM call and put (this forms a straddle), then multiplying the result by around 0.85 to reflect the market's approximate expected movement.
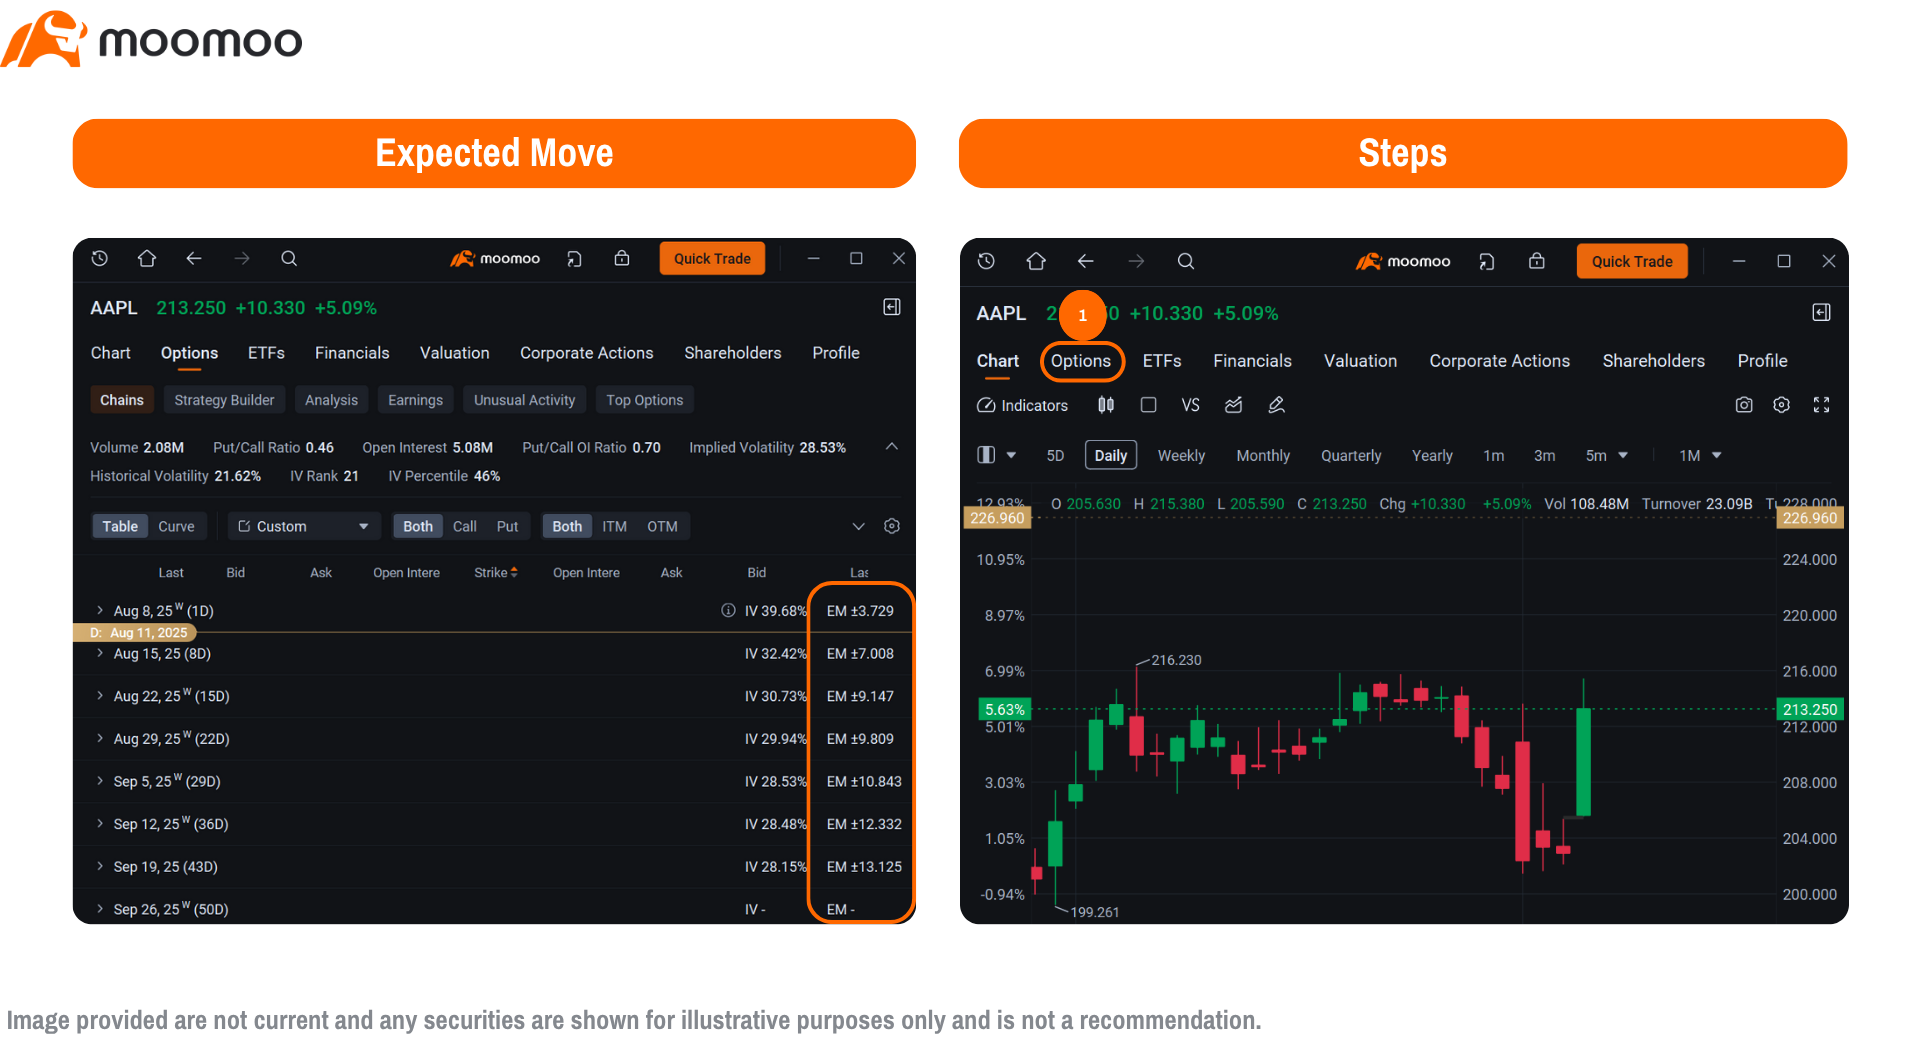
But with moomoo, there's no need to do the math yourself; the expected move is automatically displayed in the options chain, making it easy and convenient, especially for beginners.
The expected move translates the market's expectations, driven by implied volatility, into a dollar range for a specific period, helping you plan trades. For instance, if a stock's EM is $3.40 for a $50 stock, the market expects the price to stay between $46.60 and $53.40 most of the time until expiration. This range guides you to choose strategies that profit if the stock stays within or moves outside it. A stock's expected move can be a good indicator for selecting a strategy for the stock, as it helps determine whether a neutral or directional approach is more appropriate. If you expect the stock to stay stable, you might use a neutral strategy like an Iron Condor to collect premium from limited movement. If you anticipate a breakout, perhaps due to upcoming news, you might choose a directional strategy like a straddle to profit from a large move for the stock. The company's expected move or the value of the expected move can be a key factor in planning your trades and managing risk.
How to Use Option Strategies for Stock Price Prediction
Options strategies let you use the expected move to design trades that align with market expectations for the stock, whether you expect a stock to stay stable or move significantly. The moomoo platform streamlines this process with tools like the Strategy Builder and P/L Curve, which help you create and test strategies without complex calculations. A good strategy depends on a stock's expected move and the company's outlook. The P/L Curve is especially useful in a scenario where a stock's price moves significantly, allowing you to visualize potential outcomes. In this section, we explore how to apply these strategies in normal market conditions and during earnings season, with detailed examples to guide beginners.
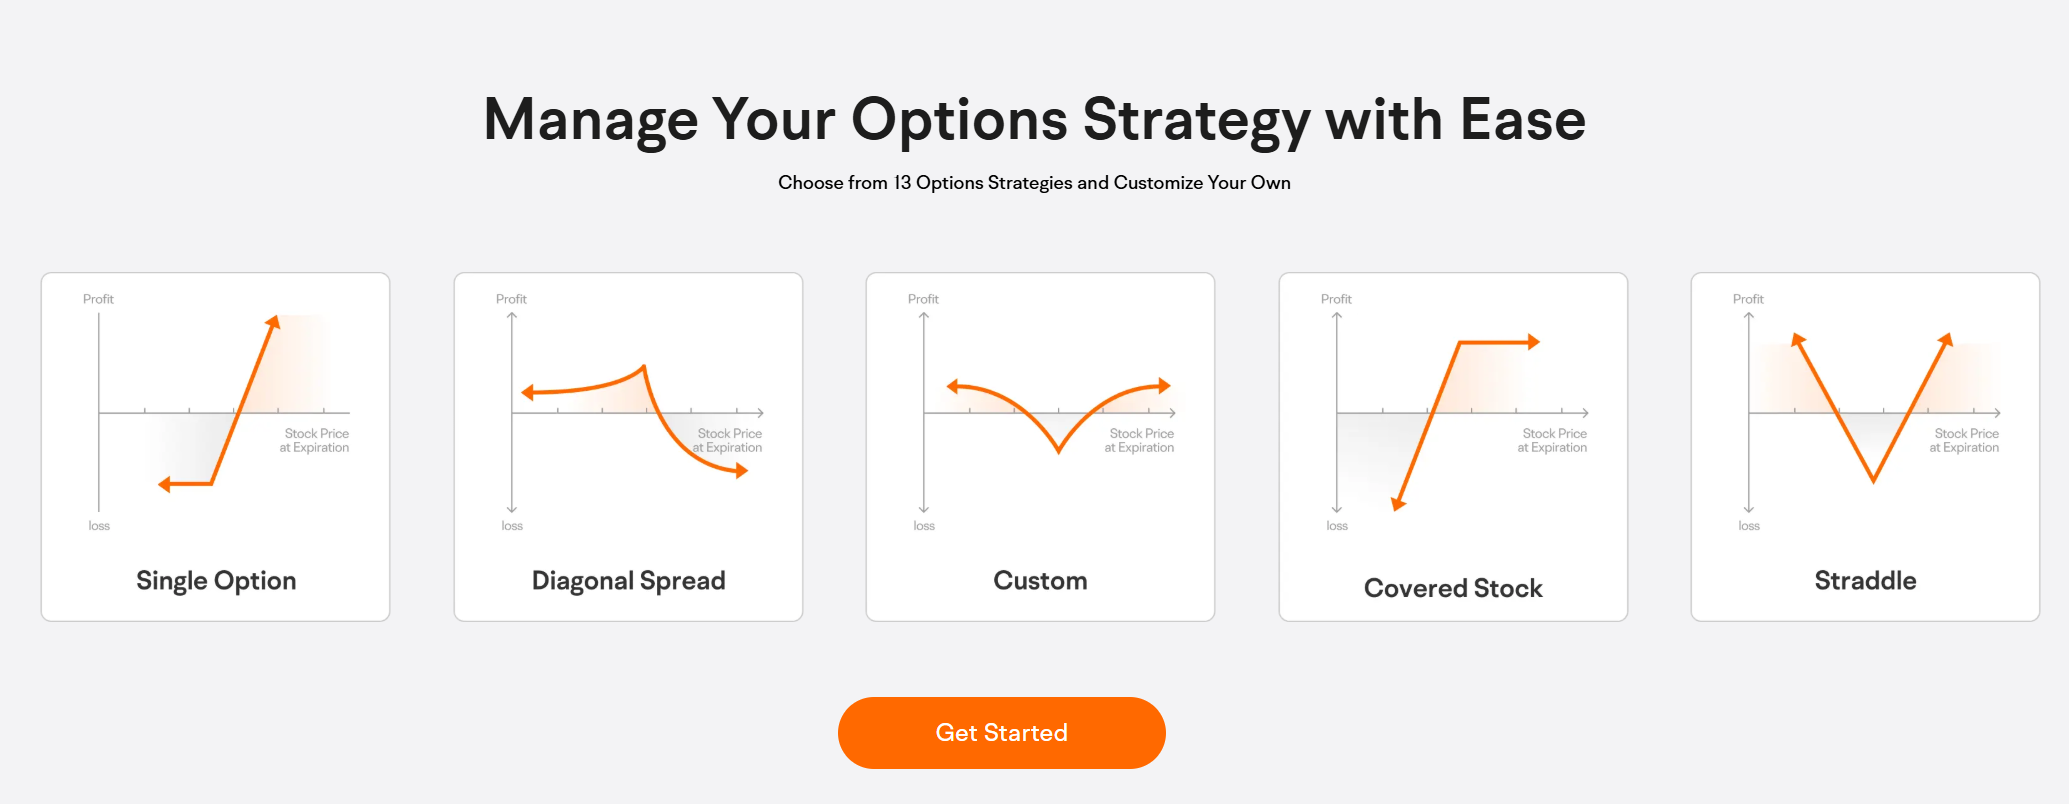
Calculating Share Price: Option Strategy for Normal Market Conditions
In stable markets, where no major events like earnings or economic reports are expected, stocks often trade within their expected move range. This environment makes neutral strategies ideal—such as the Short Strangle—which profits when the stock stays within a certain range.
A Short Strangle is a neutral strategy where you sell an out-of-the-money call and an out-of-the-money put at different strike prices, aiming to profit from the premiums if the stock stays within a defined range.
For example, suppose a stock is trading at $100, and moomoo shows an EM range of $95 to $105 for a one-month option. You could set up a Short Strangle by:
Selling a call option at $105 for $1.00.
Selling a put option at $95 for $1.00.
This strategy collects a total premium of $2 ($1.00 + $1.00) per contract, or $200 for one contract (based on the number of shares per contract, typically 100 shares). The total premium collected for the number of shares in the contract represents your maximum potential profit.
To profit, the stock must stay between the breakeven points of $93 and $107 at expiration, calculated by adjusting the short strikes by the premium ($105 + $2 = $107 for the call, $95 - $2 = $93 for the put). The breakeven points are determined by the share price of the company at expiration.
This range is wider than the EM range ($95–$105), giving you a buffer.
The maximum profit is $200 if the stock stays between $95 and $105 at expiration. The maximum loss is potentially unlimited if the stock rises significantly above $105 (e.g., at $112, the loss is ($112 - $105 - $2) × 100 = $500 per contract) or is limited by the stock falling to $0 below $95. The value of the loss depends on the share price movement of the company. If you're concerned about unlimited risk, you can add protective long call and put options to turn this into an Iron Condor, capping potential losses.
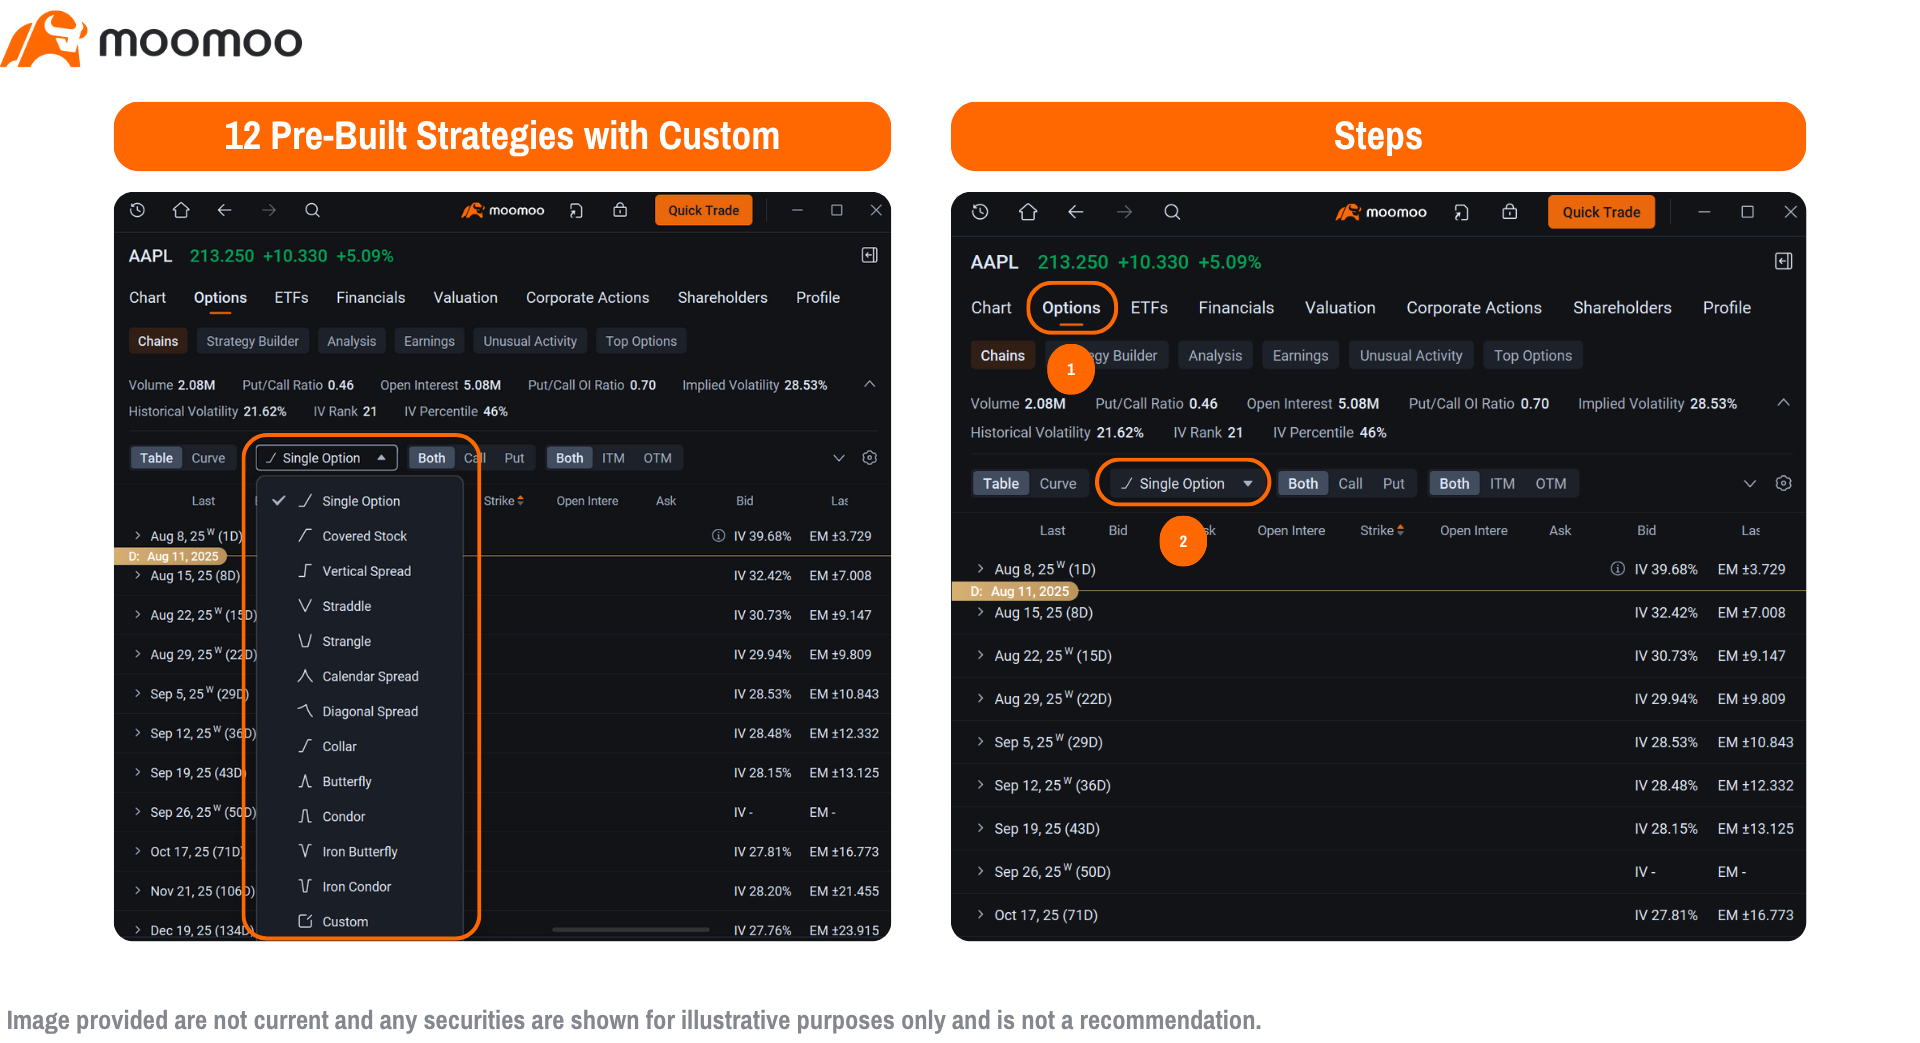
The moomoo platform offers 12 pre-built strategies, including the Strangle, Iron Condor, and allows you to create custom strategies. In the "Options Chain " feature, you can select a strategy based on your market view—whether you expect the stock to stay stable, rise, or fall.
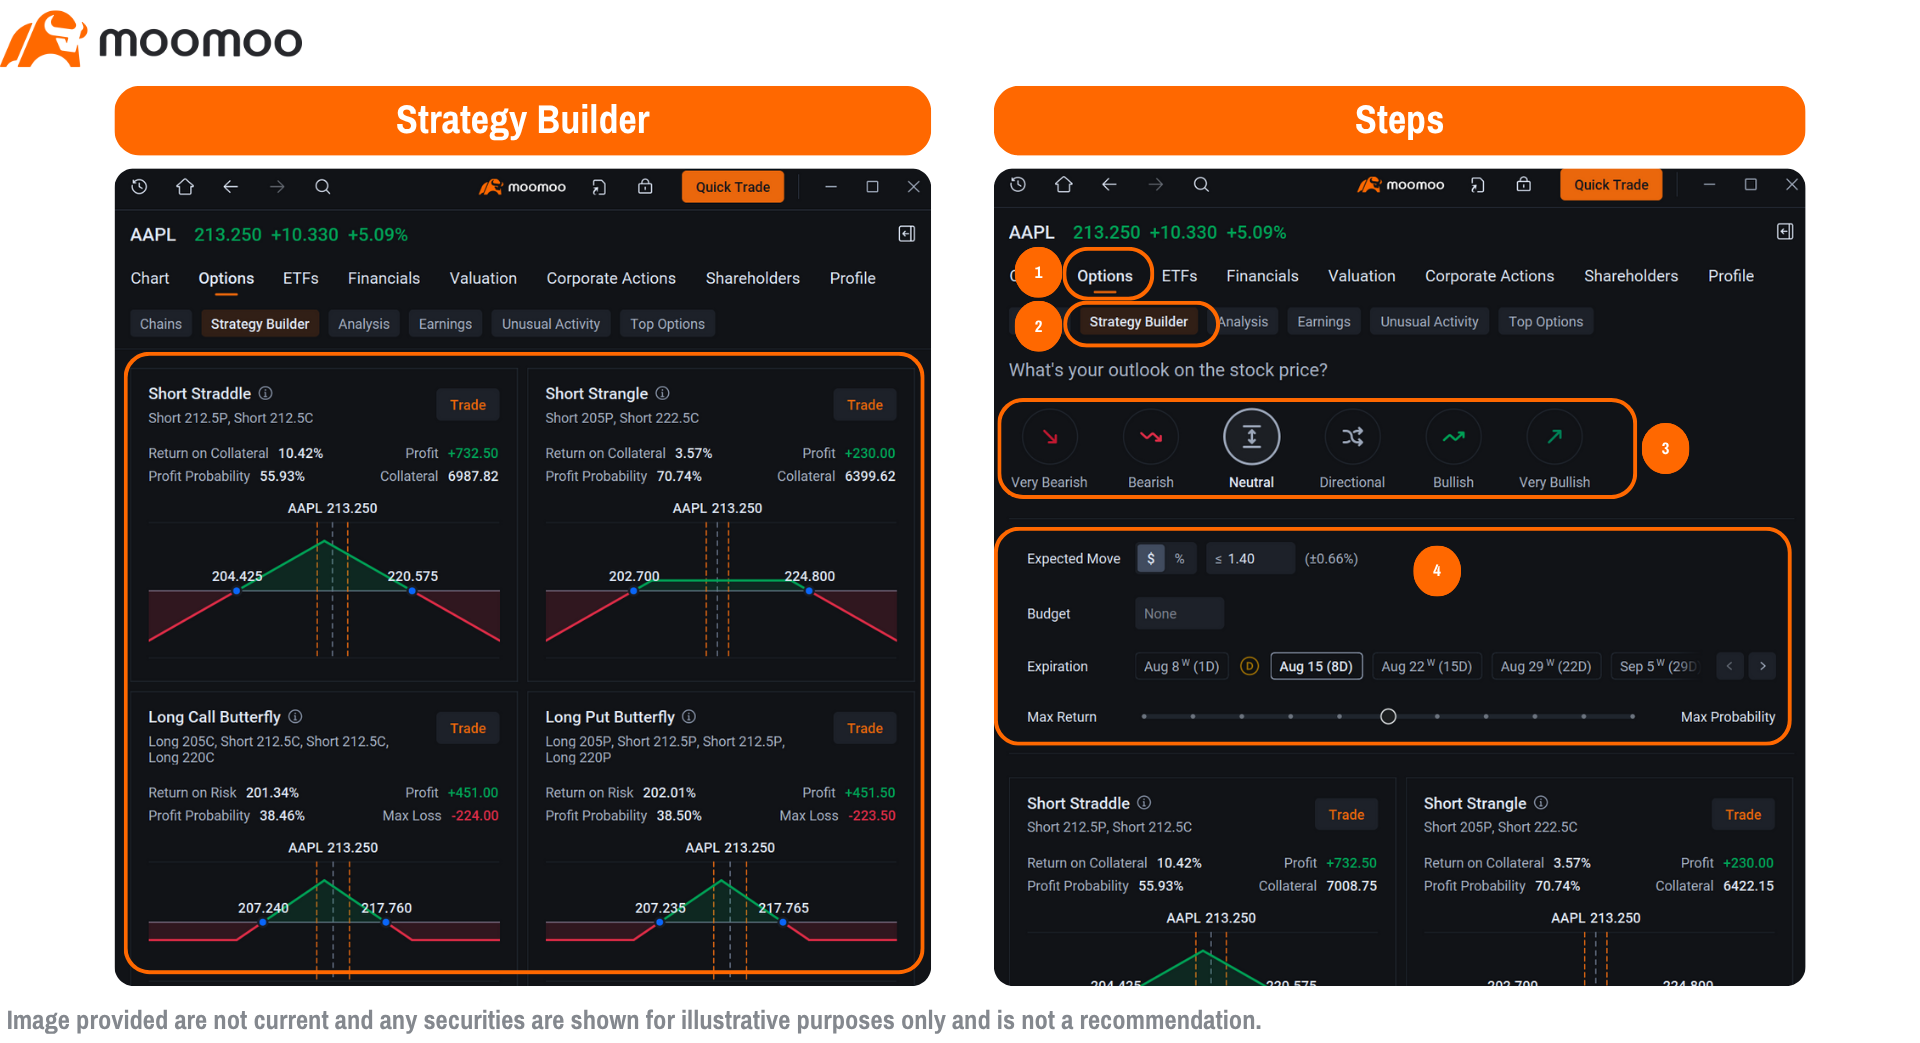
If you're unsure which strategy to choose, moomoo's Strategy Builder makes it easy. Simply select your outlook on the stock price—neutral, directional, bullish, or bearish. For a neutral outlook, input your criteria, such as the expected move, your budget, and Unusual Activities the option's expiration date. The Strategy Builder will suggest available strategies, like the Short Strangle, Short Iron Condor, and others that match your inputs, and it even shows the potential profit and maximum loss at a glance, so you can plan your trade confidently.
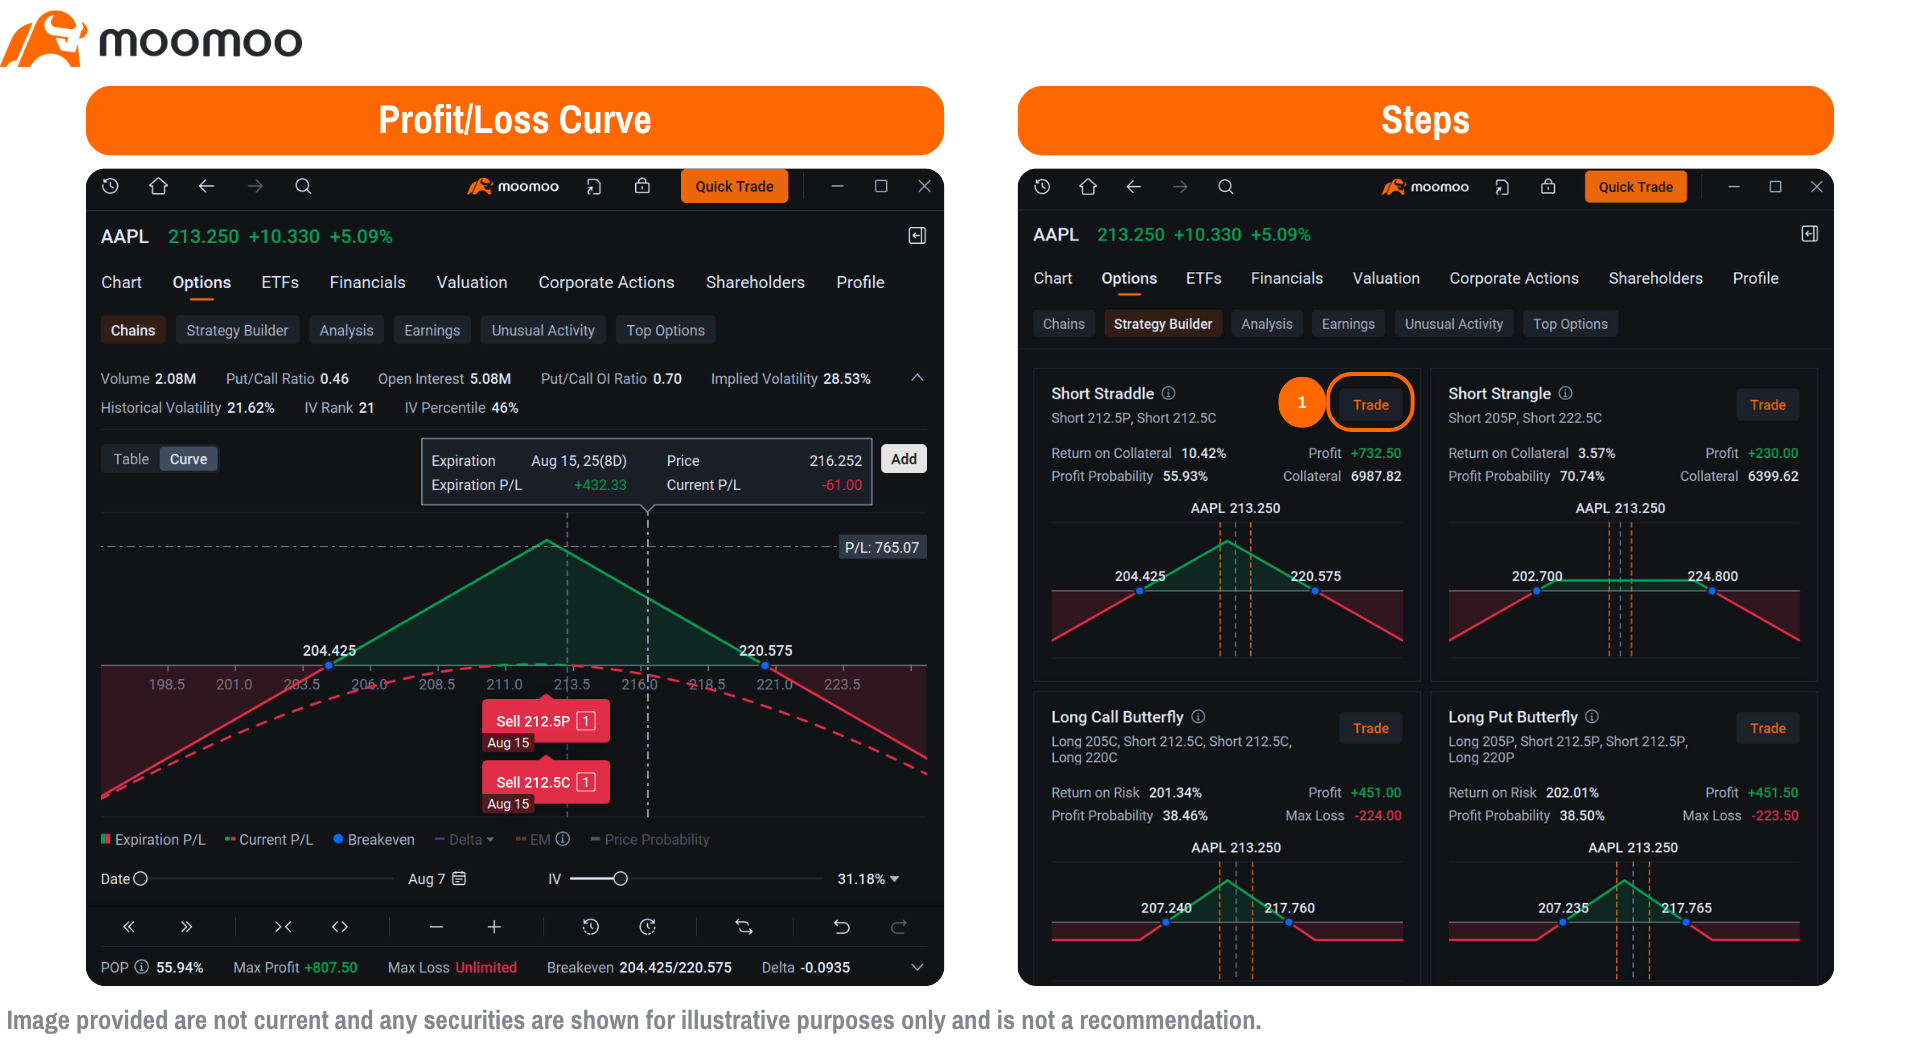
To understand your strategy's potential, once you've chosen a strategy from the Strategy Builder, simply tap “Trade”, and moomoo will directly lead you to the P/L Curve. This visual tool helps you understand your strategy's potential without requiring calculations. The Curve displays your maximum profit, maximum loss, and breakeven prices both visually on the graph and in numbers. If you point your cursor at the P/L graph, it shows how much profit or loss you'd have if the stock lands at a specific price—for example, a $300 loss if the stock reaches $110. You can see all the details at a glance. If you're not satisfied with the current setup, you can adjust the strike prices by dragging the strike labels on the graph or modifying them in the order dialog below, allowing you to fine-tune your strategy easily.
Calculate Expected Stock Move with Options: Earnings Season
Earnings reports often trigger significant price swings, making the expected move a critical tool for planning trades during these periods. The moomoo platform simplifies the process with a clear, step-by-step approach.
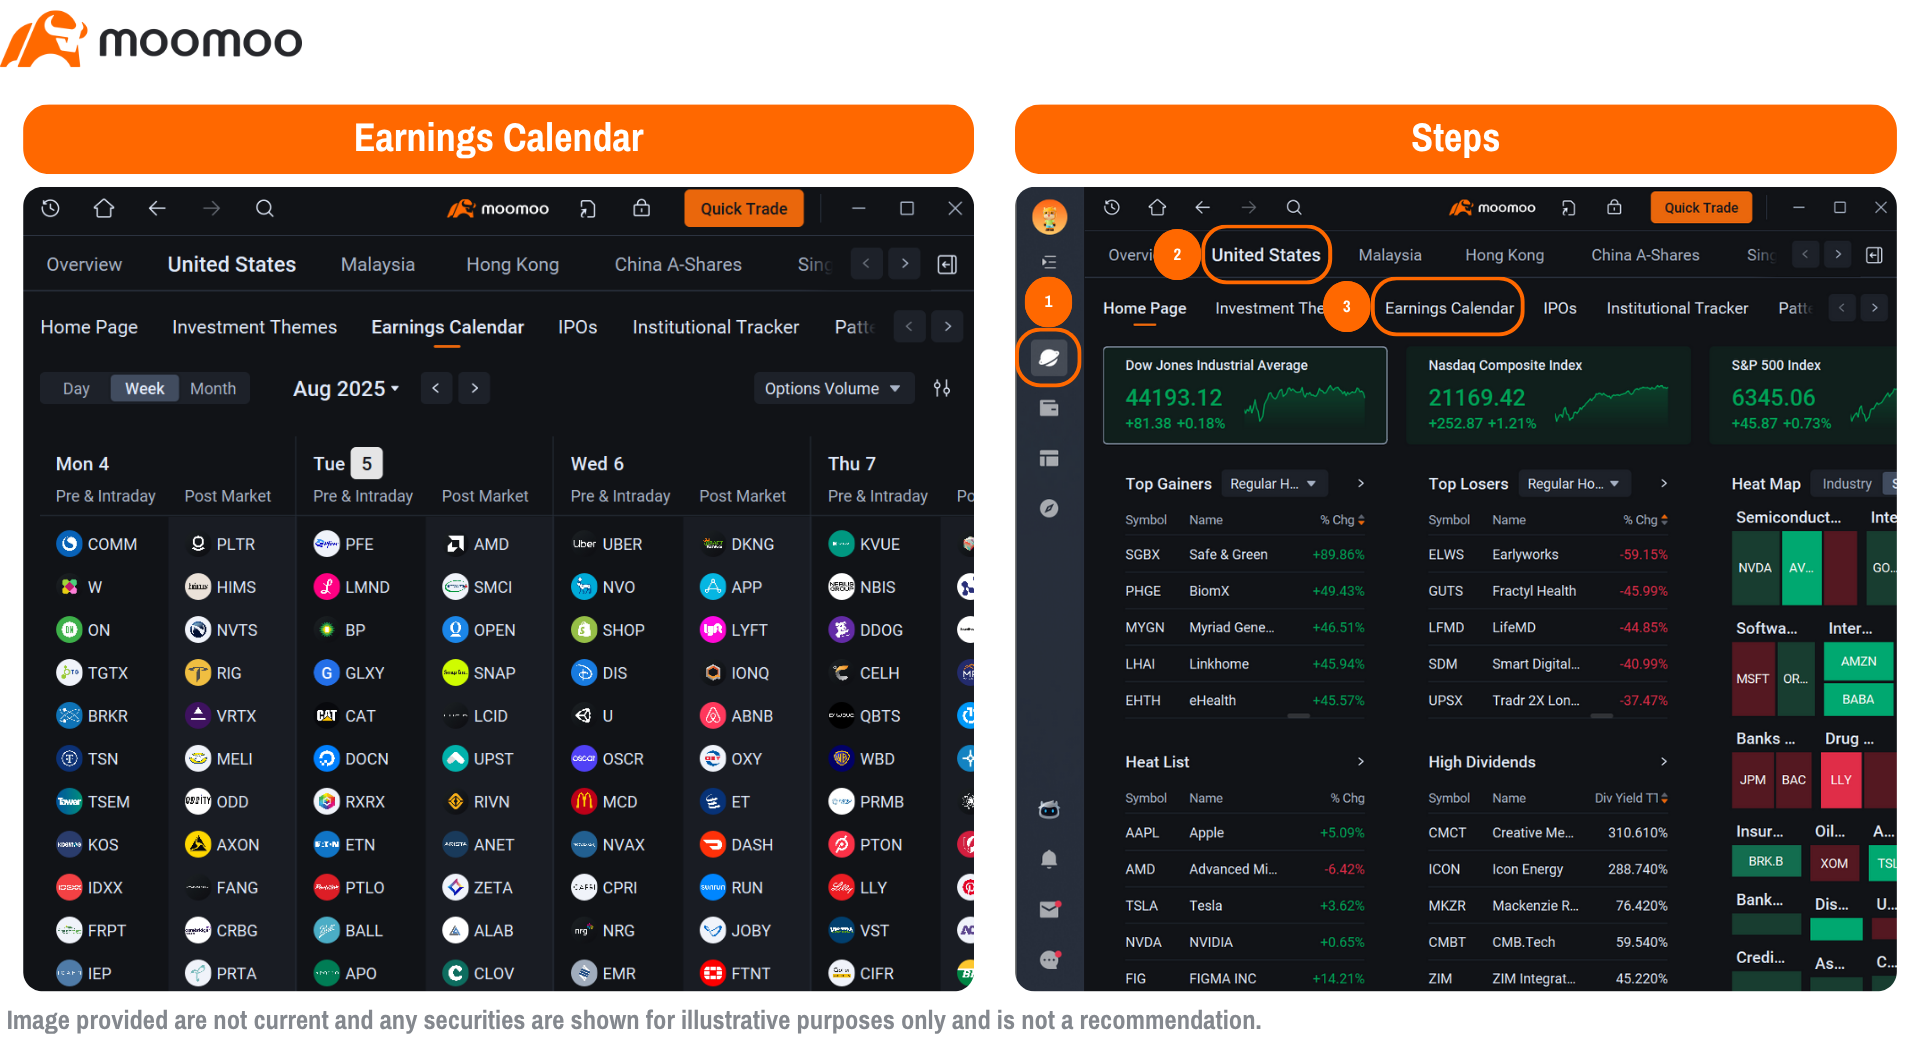
Start by checking moomoo's Earnings Calendar under the "Markets " tab to see which companies are releasing earnings soon and how it may affect a company's stock. Here, you'll find a list of companies with their upcoming earnings dates, making it easy to plan your trades.
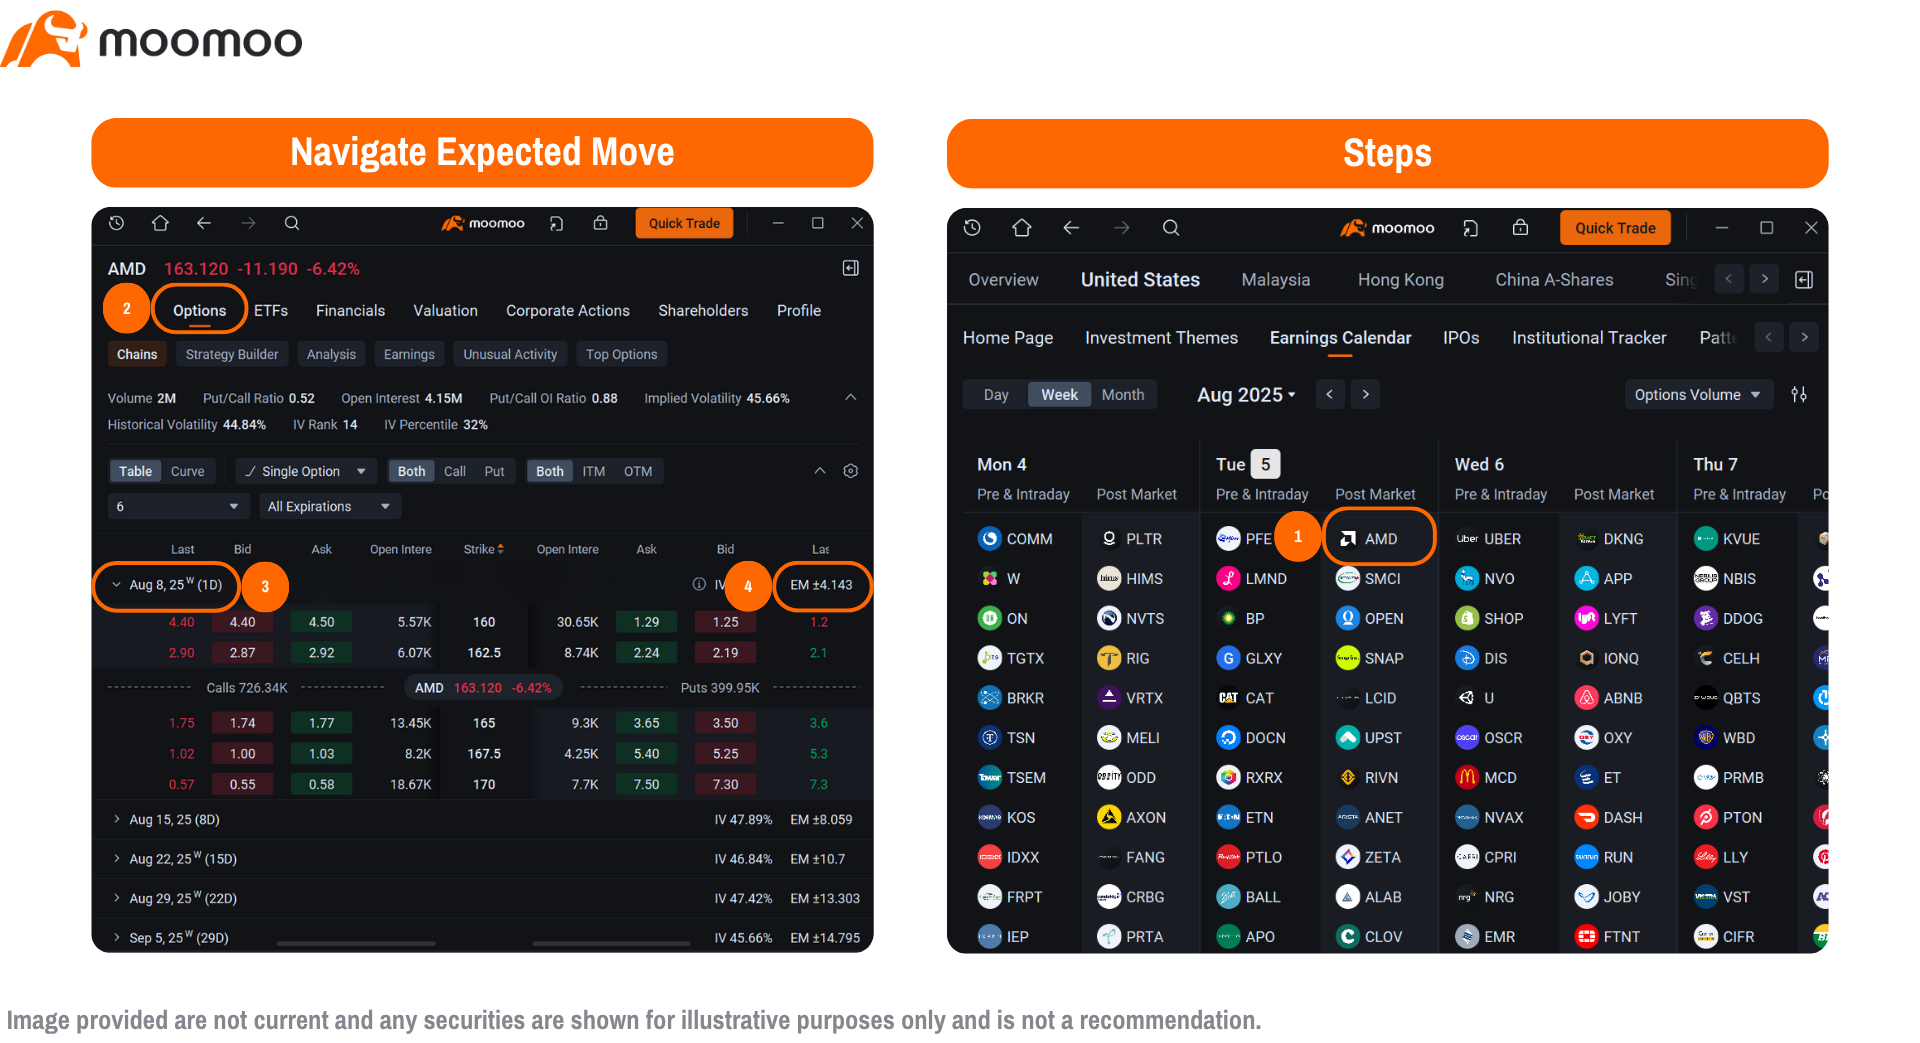
Once you pick a stock, double-tap it to go directly to the stock's “Detailed Quotes” page. As mentioned earlier, you can navigate the expected move from the option chain, but what's different here is that if an earnings date is coming soon, moomoo displays earnings date markings on the option chain. This helps you plan your strategy using the nearest expiration date before/after the earnings. For example, if a company's earnings are on November 5, you might choose options expiring on November 8 or nearest expiration to align with the expected move. The company's expected move during earnings can have a significant impact on the share price, so aligning your strategy with the timing of the earnings release is crucial.
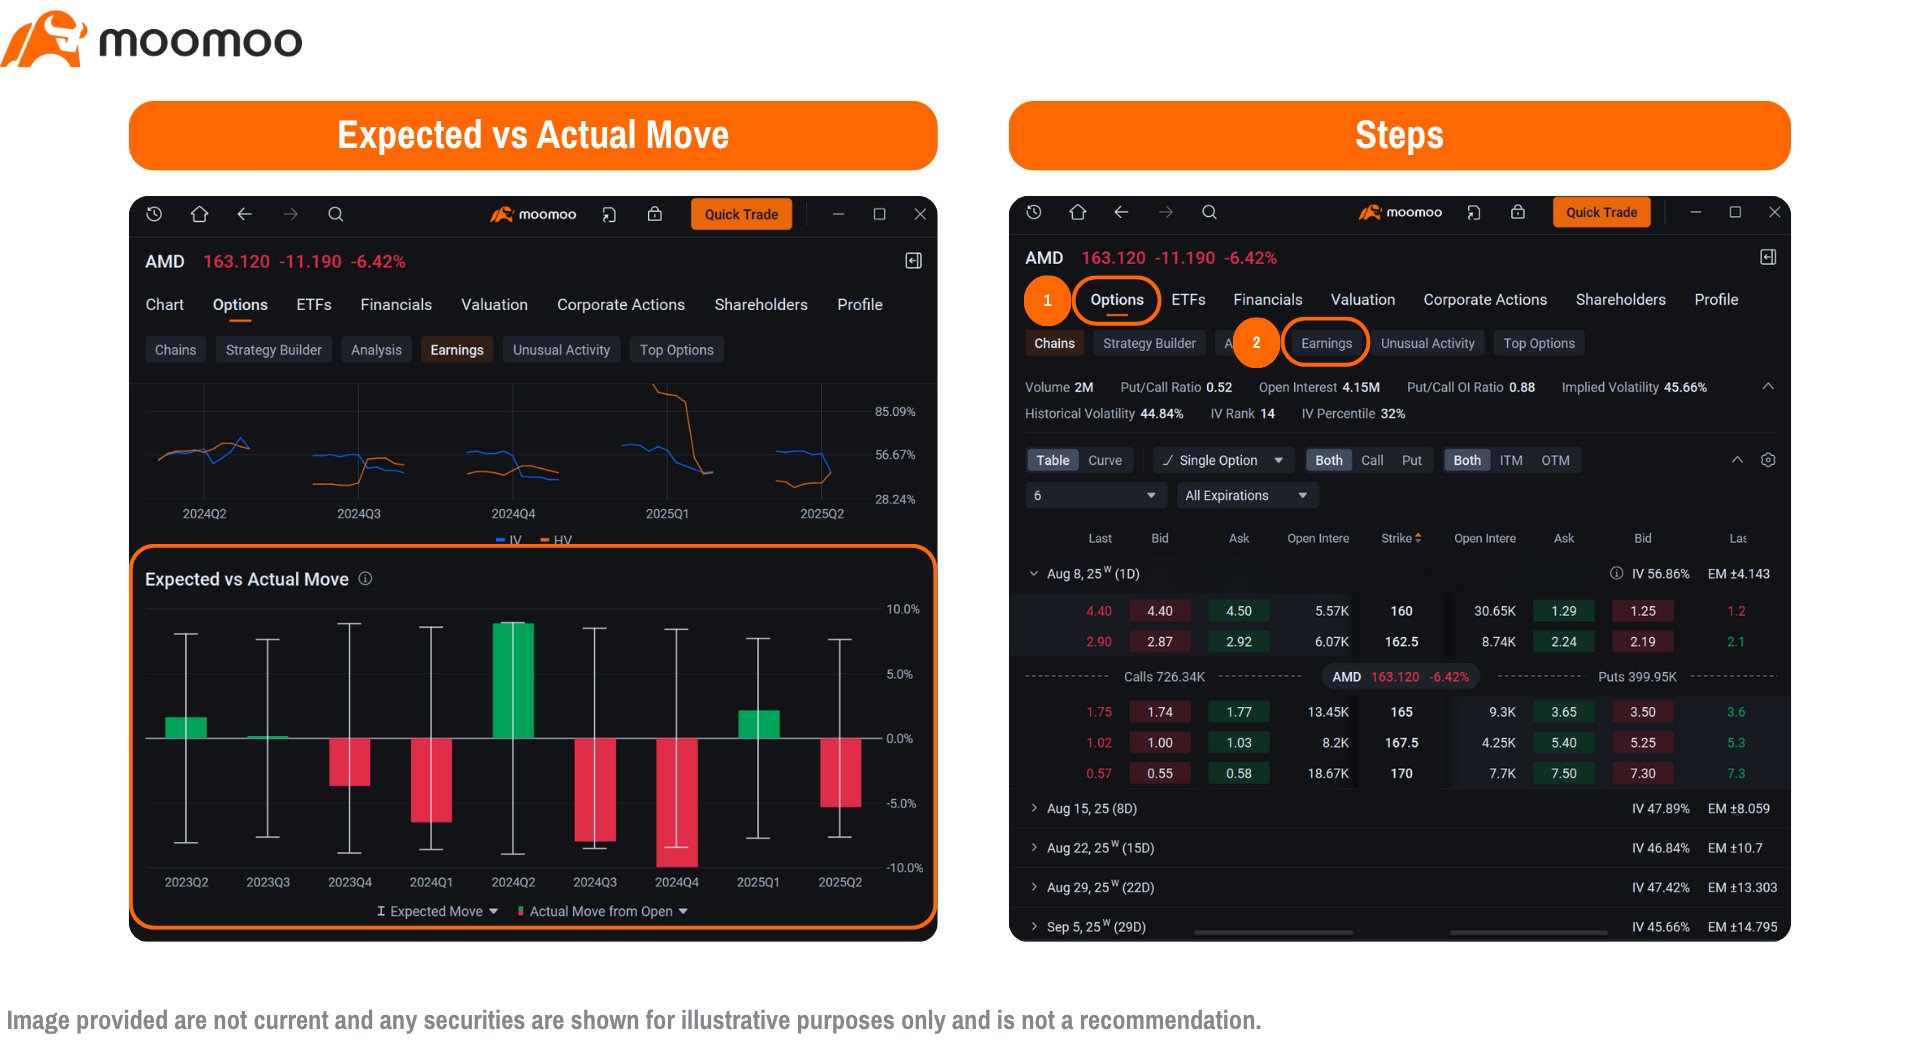
What makes moomoo stand out is its historical earnings data, accessible through the Expected vs Actual Move analysis feature. This tool helps you analyze patterns by comparing past expected moves with how the stock actually performed. For instance, analyzing a stock's past performance in a given earnings season, if a stock's actual move over the last 10 earnings reports stayed within the expected move range 8 times while breaking out 2 times, this shows an 80% probability that the stock will stay within the EM range during earnings. In this scenario, the share price moved outside the expected range only 2 times, which makes it ideal for neutral strategies like an Iron Condor or Short Strangle, especially if you choose strike prices based on the EM. On the other hand, if a stock moved outside the EM range 8 out of 10 times (80% probability), a directional strategy like a Long Straddle might be a better choice to profit from a larger move.
Of course, after analyzing the historical Expected vs Actual Move data, if you're still unsure about which strategy to pick, moomoo's Strategy Builder can help. It suggests strategies based on your needs and lets you visualize the P/L Curve, as mentioned above, to see potential profits and losses at a glance, making it easier to decide.
Limitations on Using Options to Predict Stock Price
1. Expected Move is a Probability Range
Options are a powerful tool, but they come with limitations that beginners need to understand to trade effectively. The expected move is a probability range, not a guaranteed prediction. It represents a 68% chance that the stock will stay within one standard deviation, but there's a 32% chance the price of a stock could move outside this range due to unexpected events, like a sudden market crash, a company scandal, or a major economic announcement. For example, a stock with an EM of $95–$105 might drop to $90 if negative news surprises the market, catching traders off guard. In this situation, the share price dropped despite expectations. To visualize this concept more clearly, you can use Probability Analysis, which shows the likelihood of a stock reaching or staying above/below certain prices by expiration. Similar to the feature in Thinkorswim, this analysis provides a probability curve or table, helping traders assess potential price ranges and risk more precisely than EM alone.
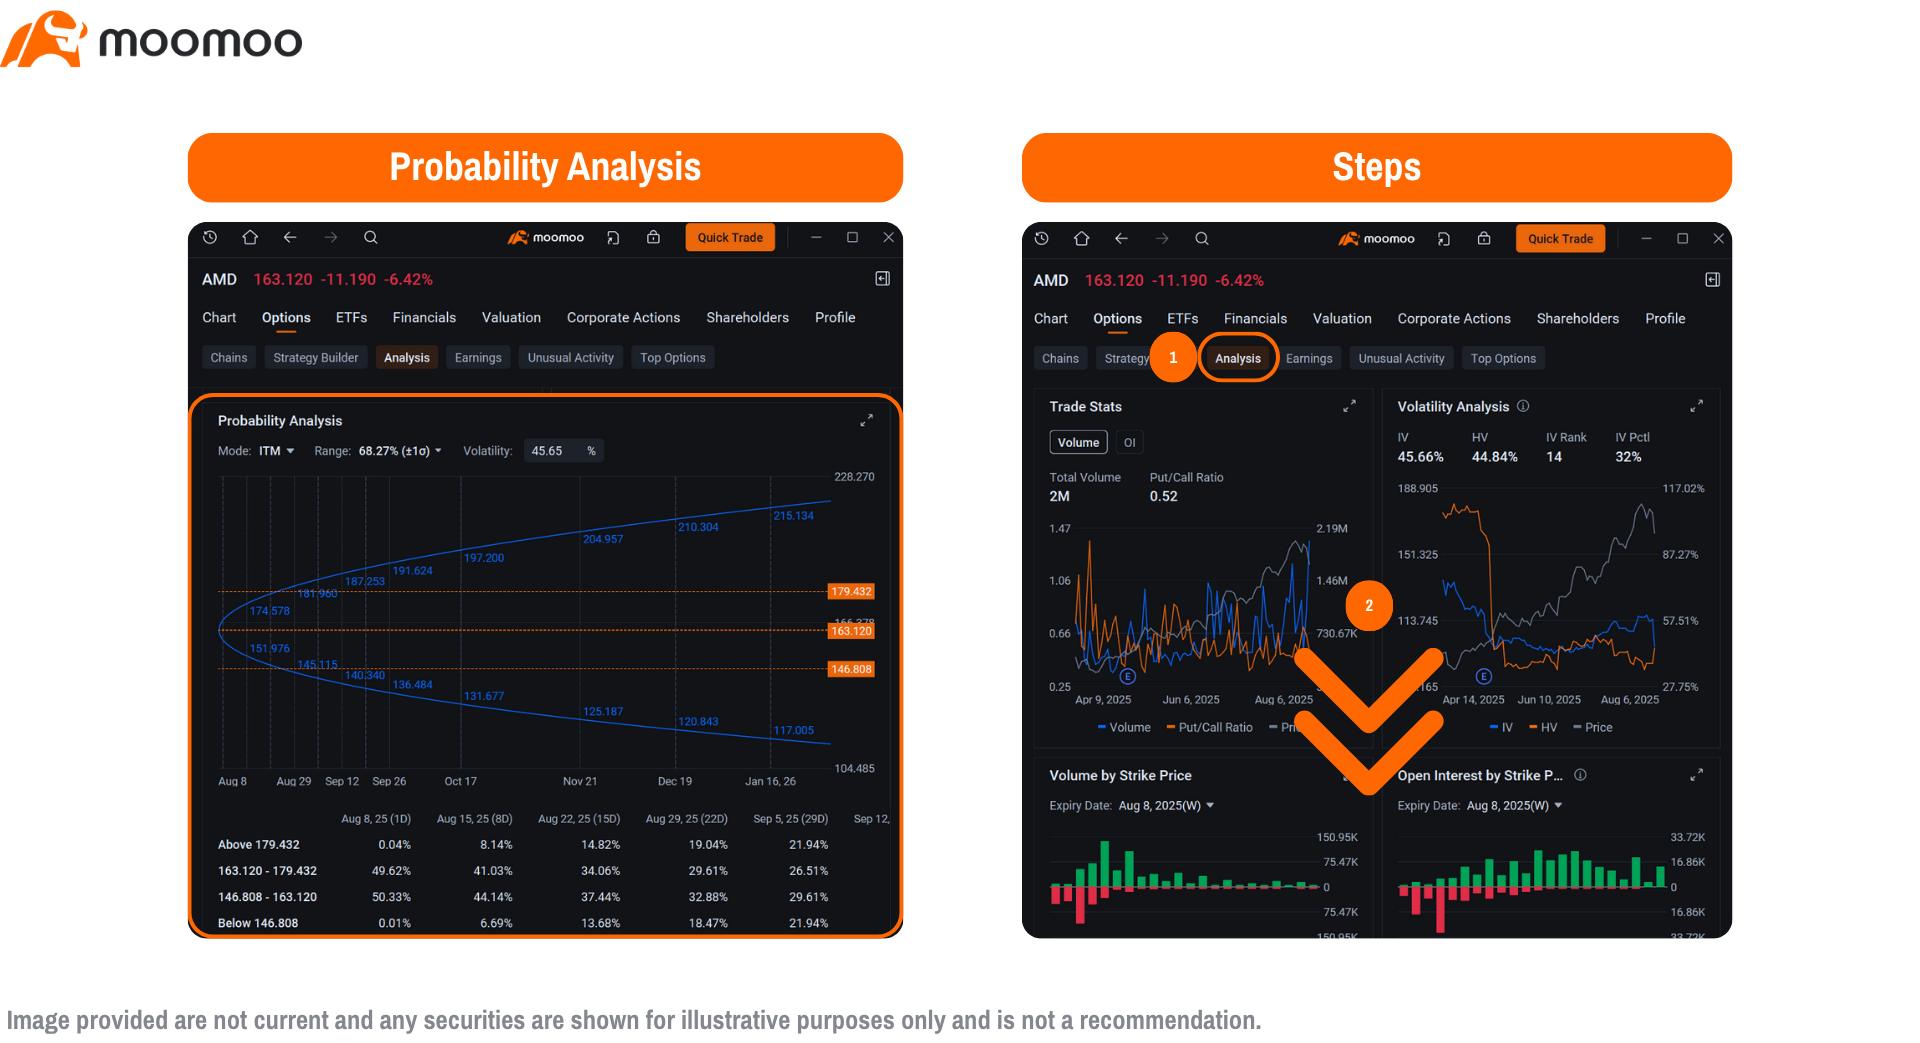
Moomoo also offers a built-in Probability Analysis tool to help visualize potential price movements. Based on implied volatility, it estimates the probability of a stock reaching or staying within certain price levels by a chosen date—making it easier to evaluate risk and plan strategies.
You can access this feature on the moomoo desktop: Stock "Options " tab> "Analysis "> scroll to "Probability Analysis ".
You can access this feature on the moomoo desktop: Stock "Options " tab> "Analysis "> scroll to "Probability Analysis ".
2. Time Frame and Expiry Date Matter
The expiration date of options significantly affects the expected move. Longer-dated options have wider EM ranges because there's more time for price changes to occur. For example, a 60-day option for a $50 stock might have an EM of $6, meaning a range of $44 to $56, while a 7-day option might have an EM of $2, or $48 to $52. The total time until expiration impacts the value of the option, and the company's options may be more sensitive to time decay. Choosing an expiration that matches your trading timeline is crucial to ensure the EM aligns with your expectations. A mismatch, like using a long-dated option for a short-term trade, could lead to strategies that don't suit your goals.
3. Implied Volatility Can Be Overstated Before Events
Implied volatility can be inflated before major events like earnings, leading to wider EM ranges and higher option prices. After the event, IV often drops sharply—a phenomenon called volatility crush—which can reduce option values even if the stock moves as expected. For instance, if you buy a call option for $5 when IV is high at 40% before earnings, and IV drops to 20% afterward, your option might lose value to $3 even if the stock rises slightly. In a volatile market, the value of the option can change significantly, so this makes it important to consider IV changes when planning trades, especially around volatile events. You can use Volatility Analysis to identify such changes in IV more effectively. This tool presents key metrics like implied volatility (IV), historical volatility (HV), IV Rank, and IV Percentile, helping you understand not only the current volatility level but also how it compares to its historical range.
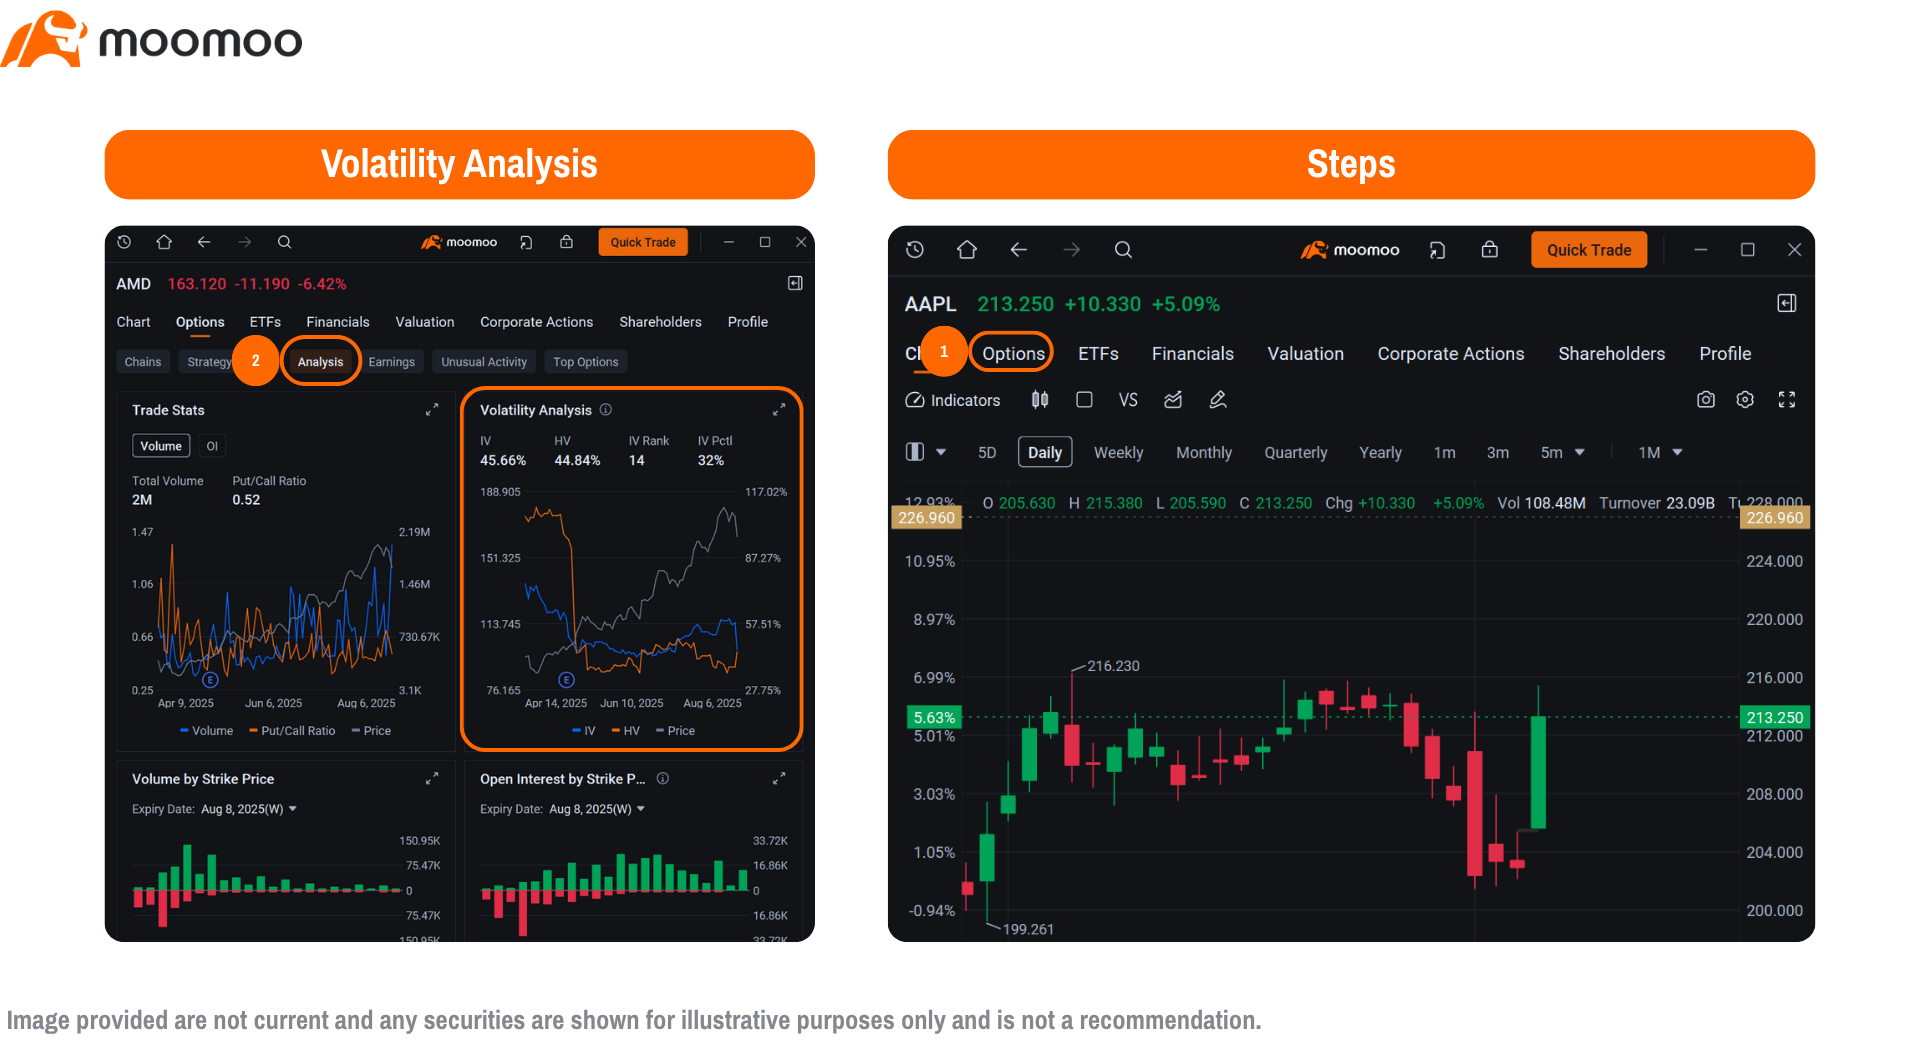
Want to grasp market expectations? Moomoo's Volatility Analysis tool visually presents Implied Volatility (IV) and Historical Volatility (HV), along with key metrics like IV Rank and IV Percentile:
- IV Rank: Instantly shows where current IV stands within its one-year range.
- IV Percentile: Reveals the percentage of days in the past year when IV was lower than the current IV.Quickly gauge whether options may be relatively overvalued or undervalued—so your decisions stay aligned with market trends.
- IV Rank: Instantly shows where current IV stands within its one-year range.
- IV Percentile: Reveals the percentage of days in the past year when IV was lower than the current IV.Quickly gauge whether options may be relatively overvalued or undervalued—so your decisions stay aligned with market trends.
4. Use EM as a Strategic Guide, Not a Prediction Engine
The expected move is a strategic guide, not a definitive forecast. It's most effective when combined with other analyses, such as technical indicators or fundamental factors.
Always use mooomoo's Curve to simulate P/L
To manage risks effectively, always use moomoo's P/L Curve to simulate your trade's outcomes. For example, before entering an earnings trade, you can use the P/L Curve to see how a $2 move vs. a $10 move affects your profit or loss, ensuring you're prepared for different scenarios in volatile markets. A good understanding of the company's fundamentals is essential for effective risk management.
To manage risks effectively, always use moomoo's P/L Curve to simulate your trade's outcomes. For example, before entering an earnings trade, you can use the P/L Curve to see how a $2 move vs. a $10 move affects your profit or loss, ensuring you're prepared for different scenarios in volatile markets. A good understanding of the company's fundamentals is essential for effective risk management.
Exploring Other Option Strategies on Moomoo MY

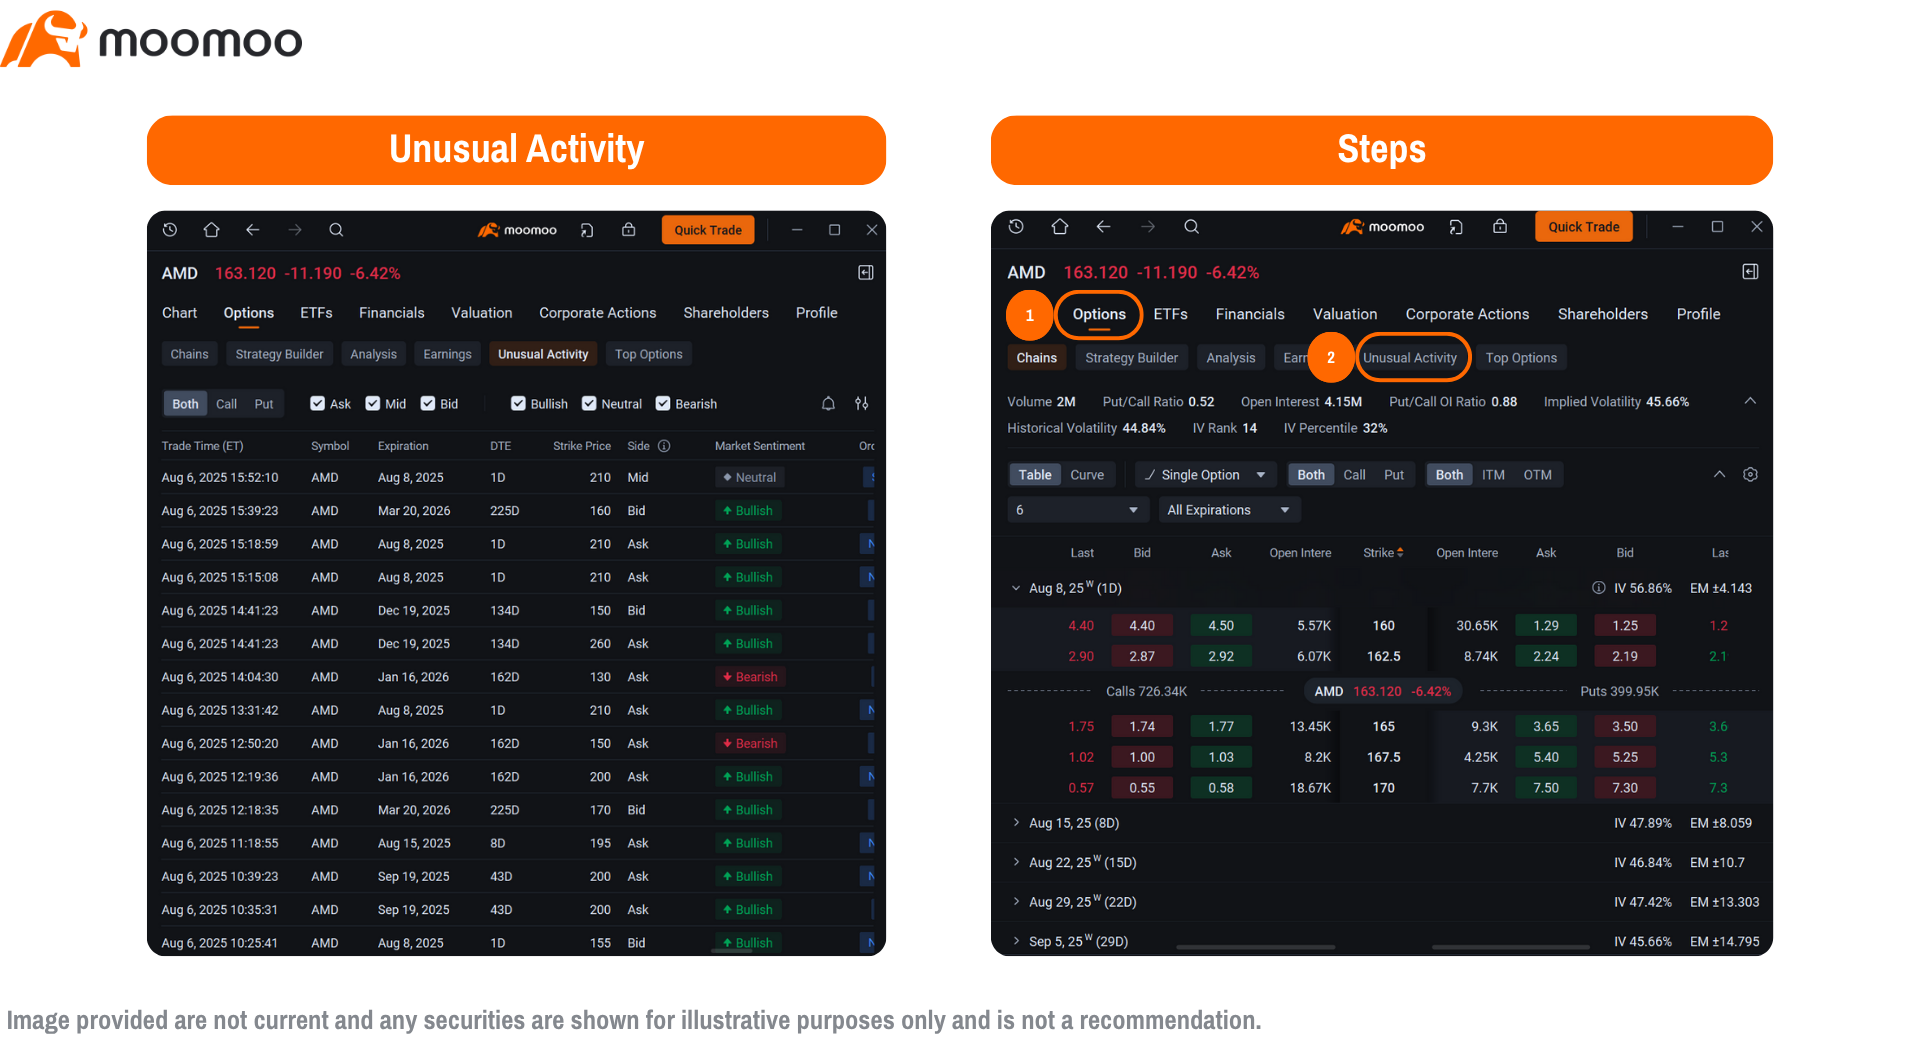
Moomoo options trading platform offers additional tools to enhance your options trading, making it easier to analyze and execute strategies, even for beginners. The Unusual Activities feature tracks large or unusual options trades, which can provide hints about market expectations. For example, if there's heavy buying of call options for a stock, it might suggest some traders expect a price increase, perhaps due to upcoming news or insider confidence. While not a guaranteed prediction, this can guide your research. You can also view the total volume of options traded for the company to gauge overall market interest. Access this tool in the “Options” tab under “Unusual Activity” to spot potential opportunities and align your strategy with market sentiment.
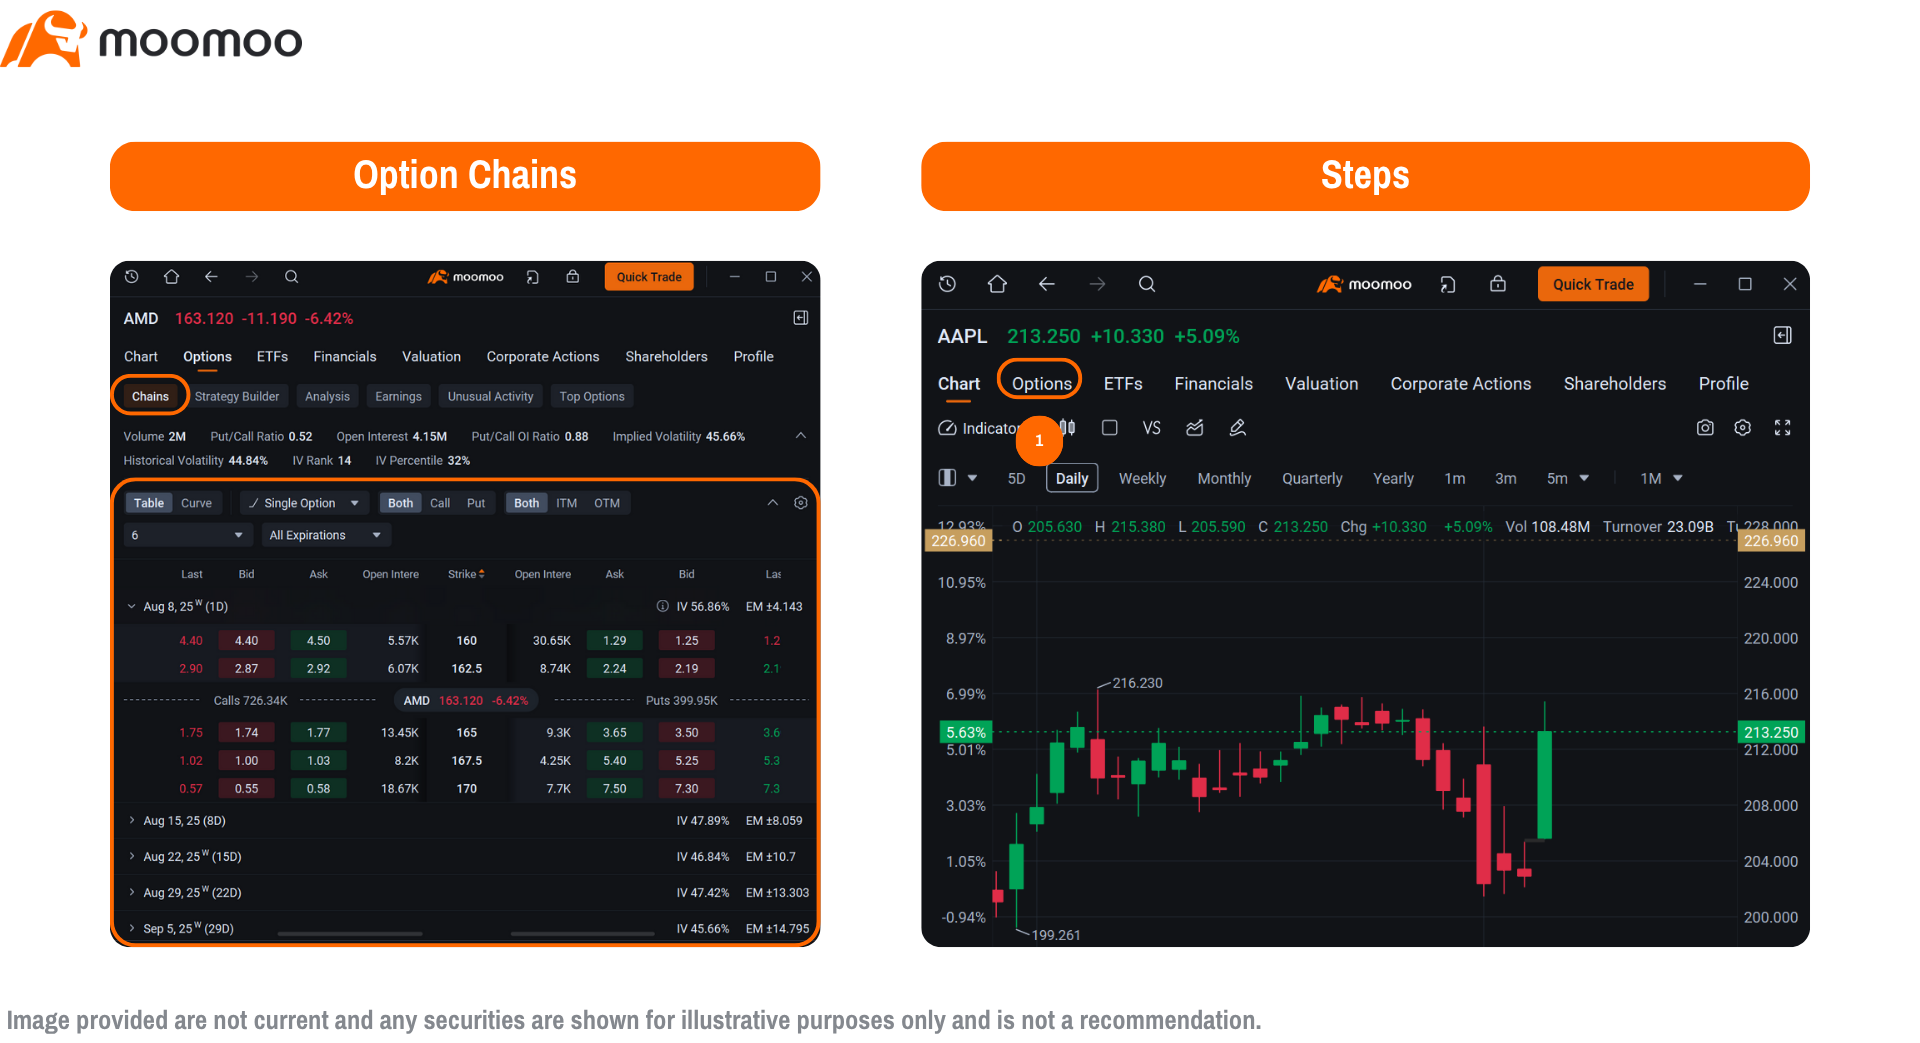
The Options Chain displays all available options for a stock, including strike prices, IV, and EM ranges. This allows you to compare options and choose those that fit your strategy. For each contract, you can view the number of shares per contract and the total value of the options available, helping you better understand your potential exposure. For instance, if you're planning a trade around an earnings report, you can filter options by expiration date to target the EM range you expect, such as short-term options expiring a week after earnings. The options chain makes it easy to see which contracts align with your goals, saving you time and effort.
>> Searching for option chain? moomoo offers seamless access. Check AMD Options Chain now!
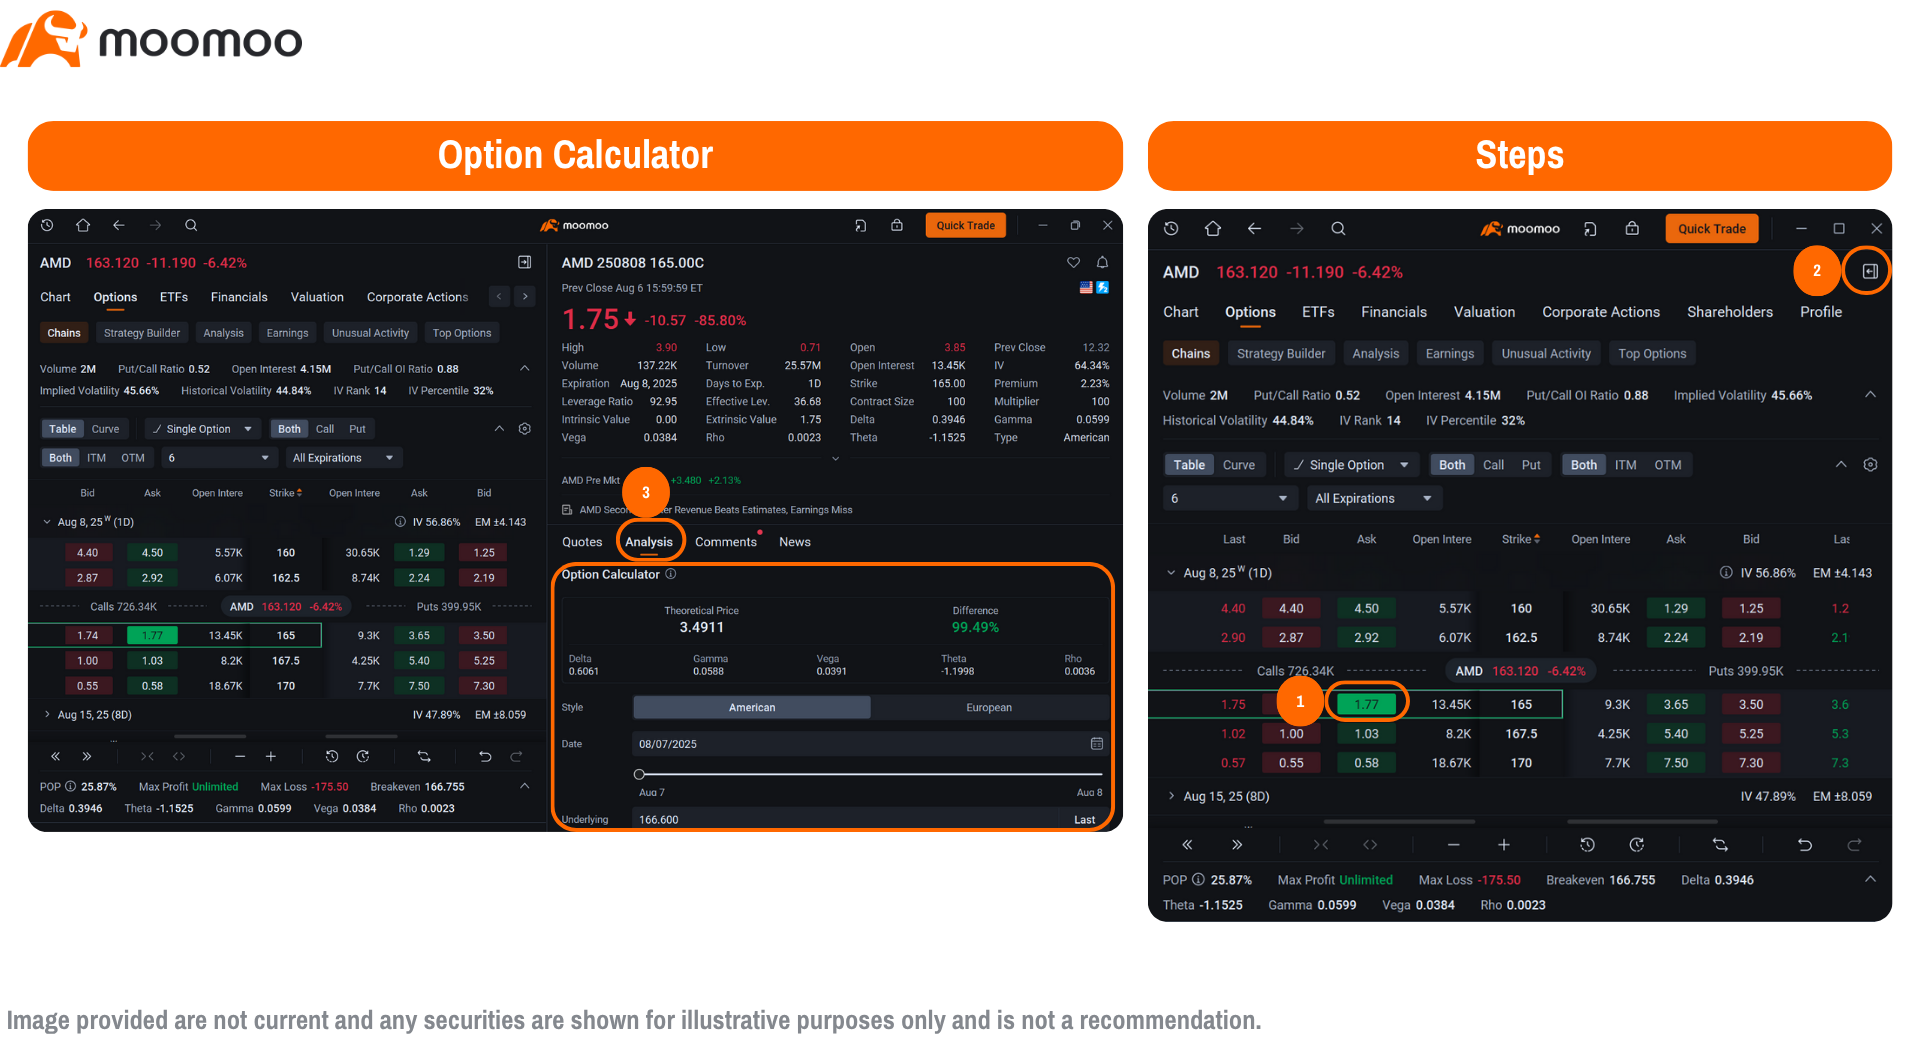
The Option Price Calculator estimates option prices based on factors like IV, stock price, and time to expiration. By inputting the share price and the number of shares, you can estimate the value of the option for your trade. This is useful for testing scenarios, such as how a drop in IV after earnings might affect your trade's value. For example, you can input a hypothetical 10% drop in IV to see how it impacts a call option's price, helping you prepare for volatility crush. Find this tool in the “Options” tab to plan trades without manual calculations, making it ideal for beginners exploring different outcomes.
These tools, available in the moomoo MY, make options trading more accessible and efficient, empowering you to analyze and execute strategies with confidence, even if you're new to options.
Conclusion: Forecasting Price Movement with Options Strategies
Options trading provides a clear and effective way to estimate a stock's potential price range using implied volatility and the expected move. IV helps you understand market expectations, while EM translates these into a practical dollar range for planning trades. By mastering these concepts, you can choose strategies that align with market expectations, whether you expect stability or significant swings. The moomoo platform simplifies this process with powerful tools like the Earnings Calendar, Strategy Builder, P/L Curve, and Options Analysis, making it easy for beginners to analyze and trade options confidently. However, options come with limitations, such as probability-based ranges and the risk of volatility crush, so they should be part of a broader trading plan that includes other analyses like technical indicators or company fundamentals. By leveraging moomoo's tools and combining options data with additional research, you can make smarter, more informed trading decisions. Start exploring options on moomoo MY to forecast stock price movements with ease and build your trading skills.

This presentation is for informational and educational use only and is not a recommendation or endorsement of any particular investment or investment strategy. Investment information provided in this content is general in nature, strictly for illustrative purposes, and may not be appropriate for all investors. Read more