U.S. stock market basics: What you need to know
Have you ever wondered why stock prices can skyrocket or plunge in just moments? What forces drive these dramatic market swings?
We'll explore the fundamental dynamics of U.S. stock investing.
Takeaways:
● The market price represents the most recent completed transaction. It doesn't guarantee that you can buy or sell stocks at that exact price right now.
● In the U.S., there are three major stock market indexes that serve as key benchmarks: the Dow Jones Industrial Average, the S&P 500, and the Nasdaq Composite.
● Over the past decade, some of the top performing sectors in the U.S. stock market have included Information Technology, Consumer Discretionary, and Financials.
1. How are stock prices determined?
The U.S. stock market is a sophisticated trading network that connects investors looking to buy and sell stocks.
Unlike face-to-face negotiations, stock trading happens through brokers and exchanges, ensuring that transactions are fair and transparent.

At the heart of this market are two major exchanges: the New York Stock Exchange (NYSE) and the Nasdaq. In addition to these exchanges, there are numerous securities brokers, like moomoo, that help facilitate trades for investors.
If you want to purchase a stock on moomoo, tap on its symbol and set the "Price" and "Quantity," then hit "Buy" to create an order.
Note that this is a basic overview; the actual process may involve additional steps and considerations depending on your account settings and market conditions.
Moomoo then sends this order to the exchanges' electronic trading system, which search for a matching sell order—a process known as "order matching" or "execution."
In this context, the price associated with a buy order is generally referred to as the "bid price," while the price for a sell order is typically called the "ask price."
Your buy order will be executed if there's a seller willing to transact at your specified price or lower. If not, your order will sit in the order book until a suitable match is found.
When a buyer and seller successfully match, the trading system creates a transaction record that shows the executed price and the number of shares traded. These details gives us what we commonly call the "stock price" and "trading volume." Since this price comes directly from market transactions, it's also known as the "market price."
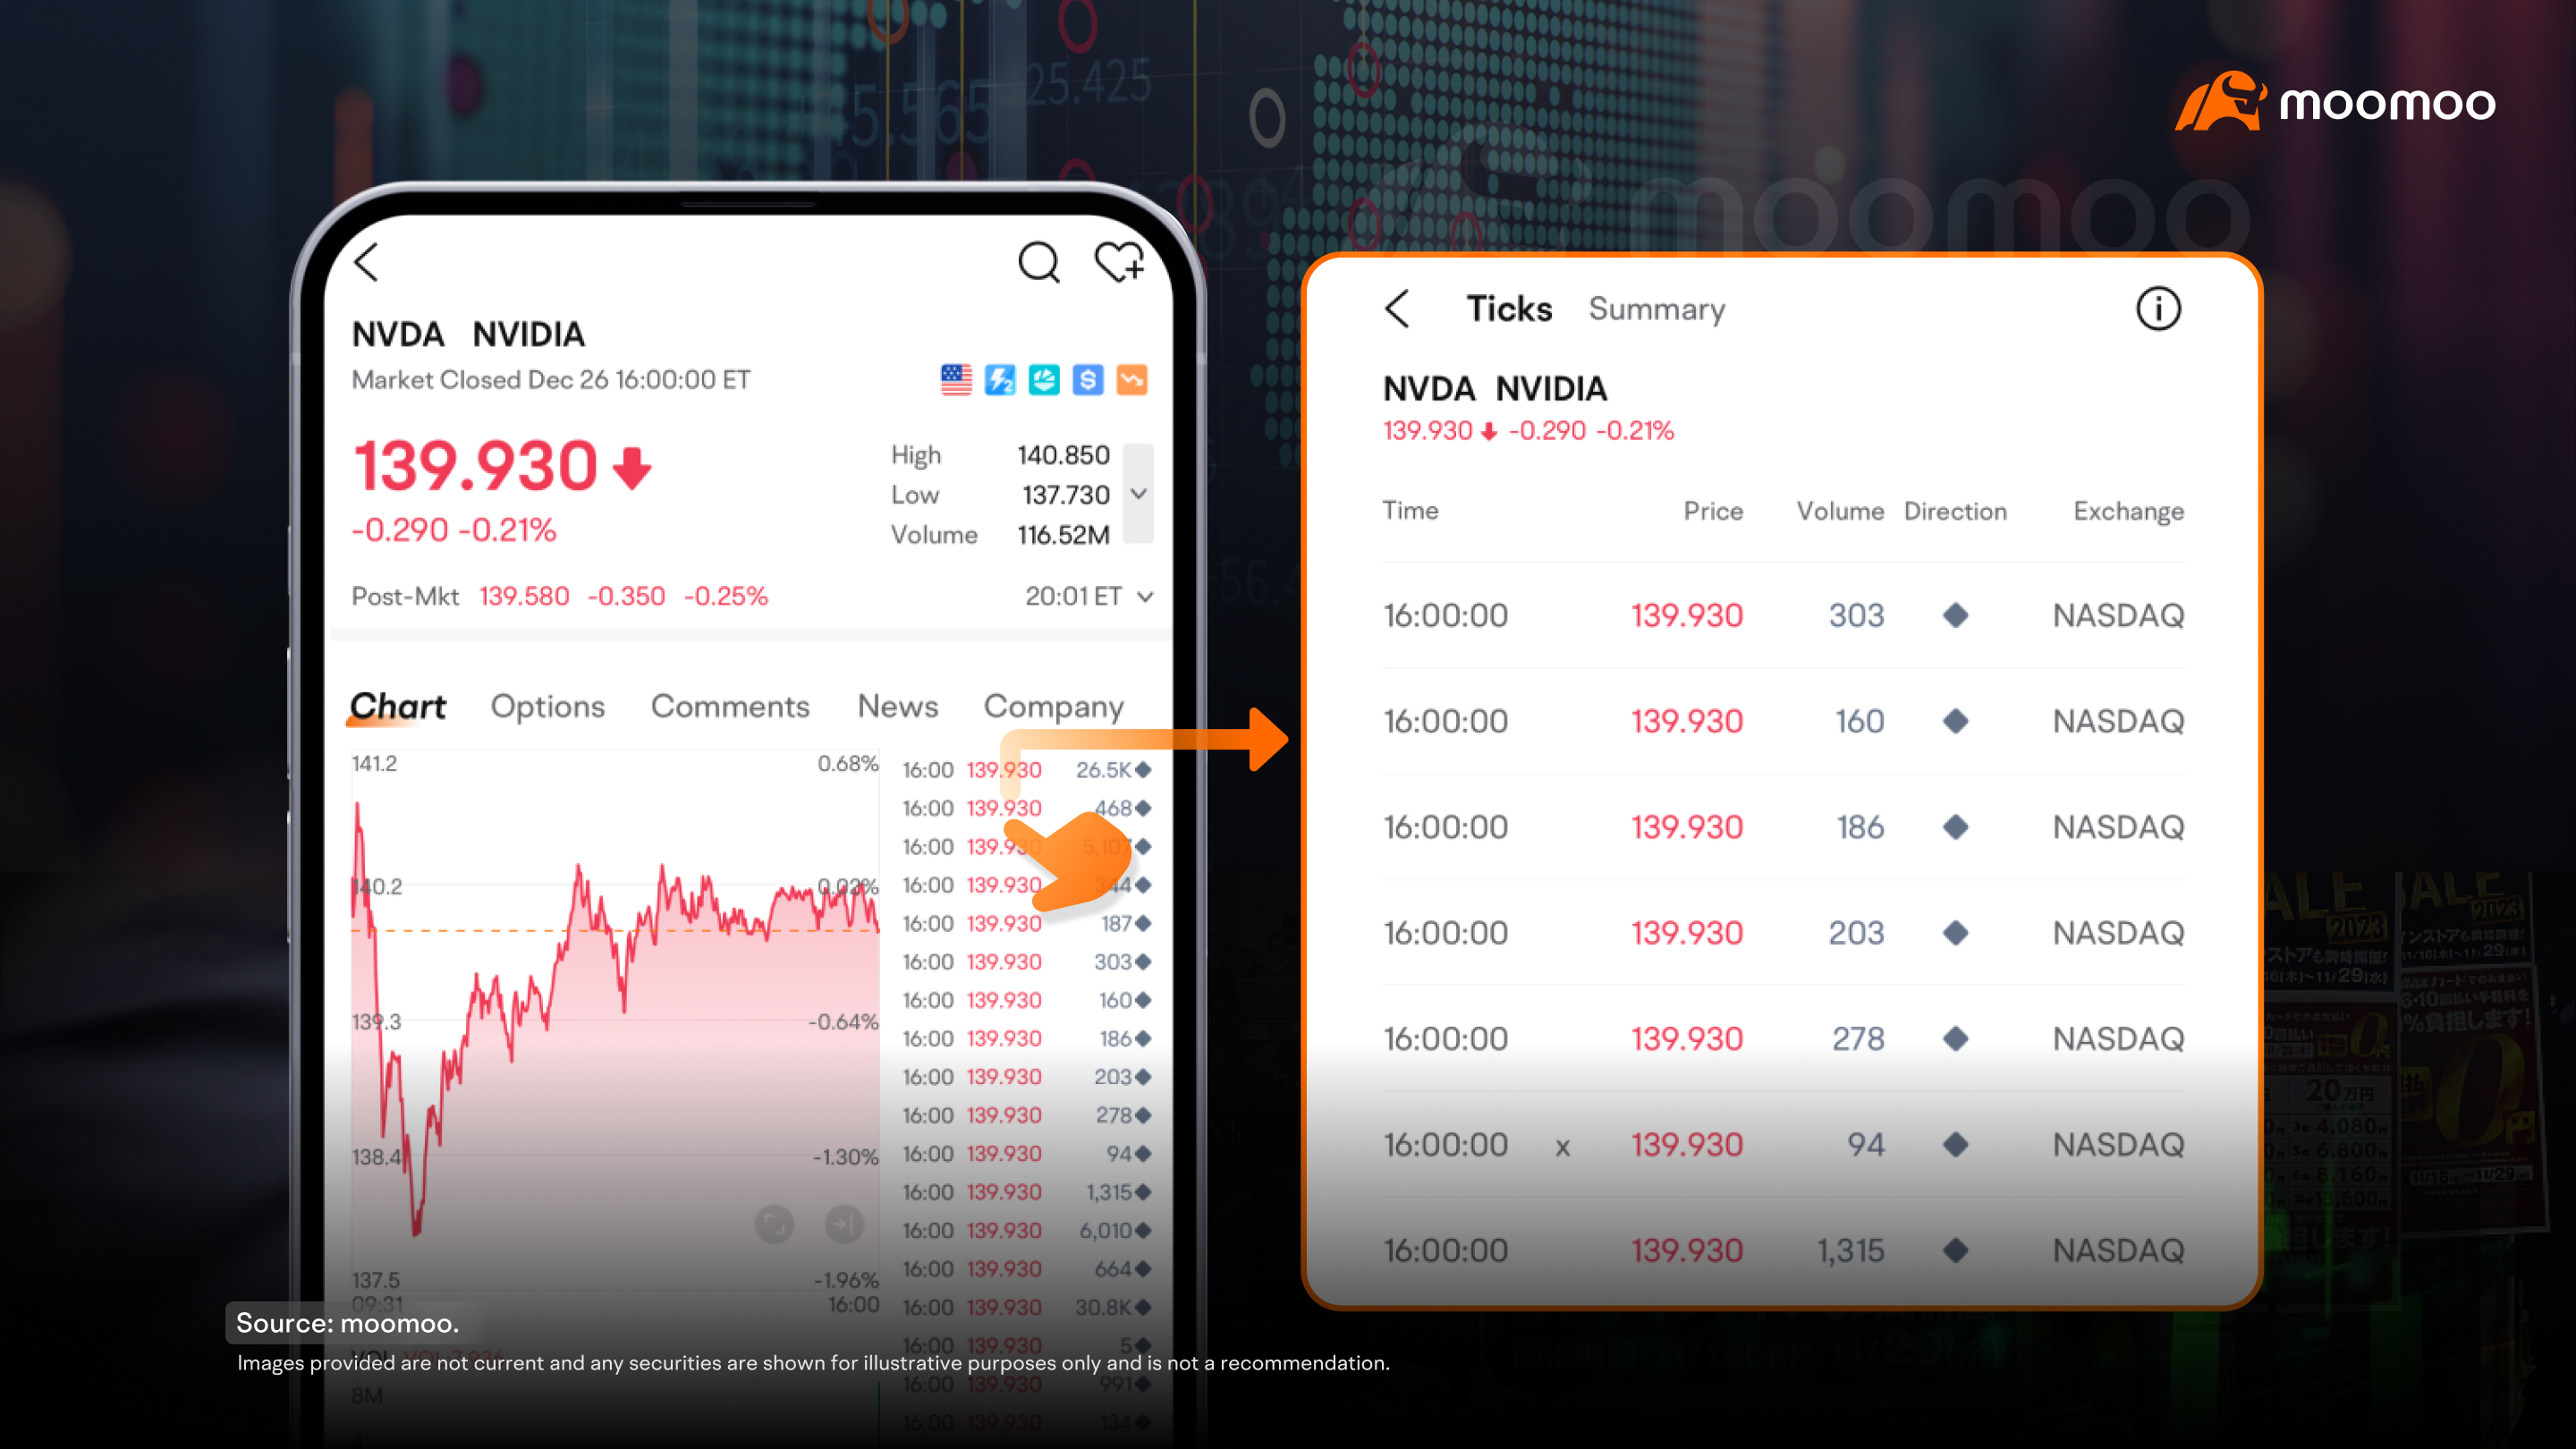
It's important to realize that the market price represents the most recent completed transaction. While it serves as a reference point, it doesn't guarantee that you can buy or sell stocks at that exact price right now. Market prices can change quickly, reflecting the ongoing dynamics between buyers and sellers.
Stock prices, like other goods, are driven by supply and demand. When demand exceeds supply, prices rise; when supply exceeds demand, prices fall. Disruptions to this balance can cause rapid price swings.
This effect is particularly evident in less liquid stocks, such as those of smaller companies. With fewer active participants in these markets, each transaction can have a considerable impact on price movements.
On moomoo, you can evaluate stock liquidity using various indicators. Highly liquid stocks typically show large trading volumes, narrow bid-ask spreads, and substantial market depth.
2. What are the key barometers of U.S. stock markets?
Let's now turn our attention to stock market indexes, the key barometers of the U.S. stock market.
The U.S. is home to the largest equity market in the world, featuring thousands of listed companies. With each company's stock price moving independently, how do we get a sense of the market's overall direction? That's where stock market indexes come in.
Think of an index as a curated basket of "constituent stocks," each with its own weight. These weights are calculated to produce a single value—the index. As the prices of these stocks change, they influence the index, giving us a clear snapshot of existing market trends.
In the U.S., there are three major indexes that serve as key benchmarks: the Dow Jones Industrial Average, the S&P 500, and the Nasdaq Composite.
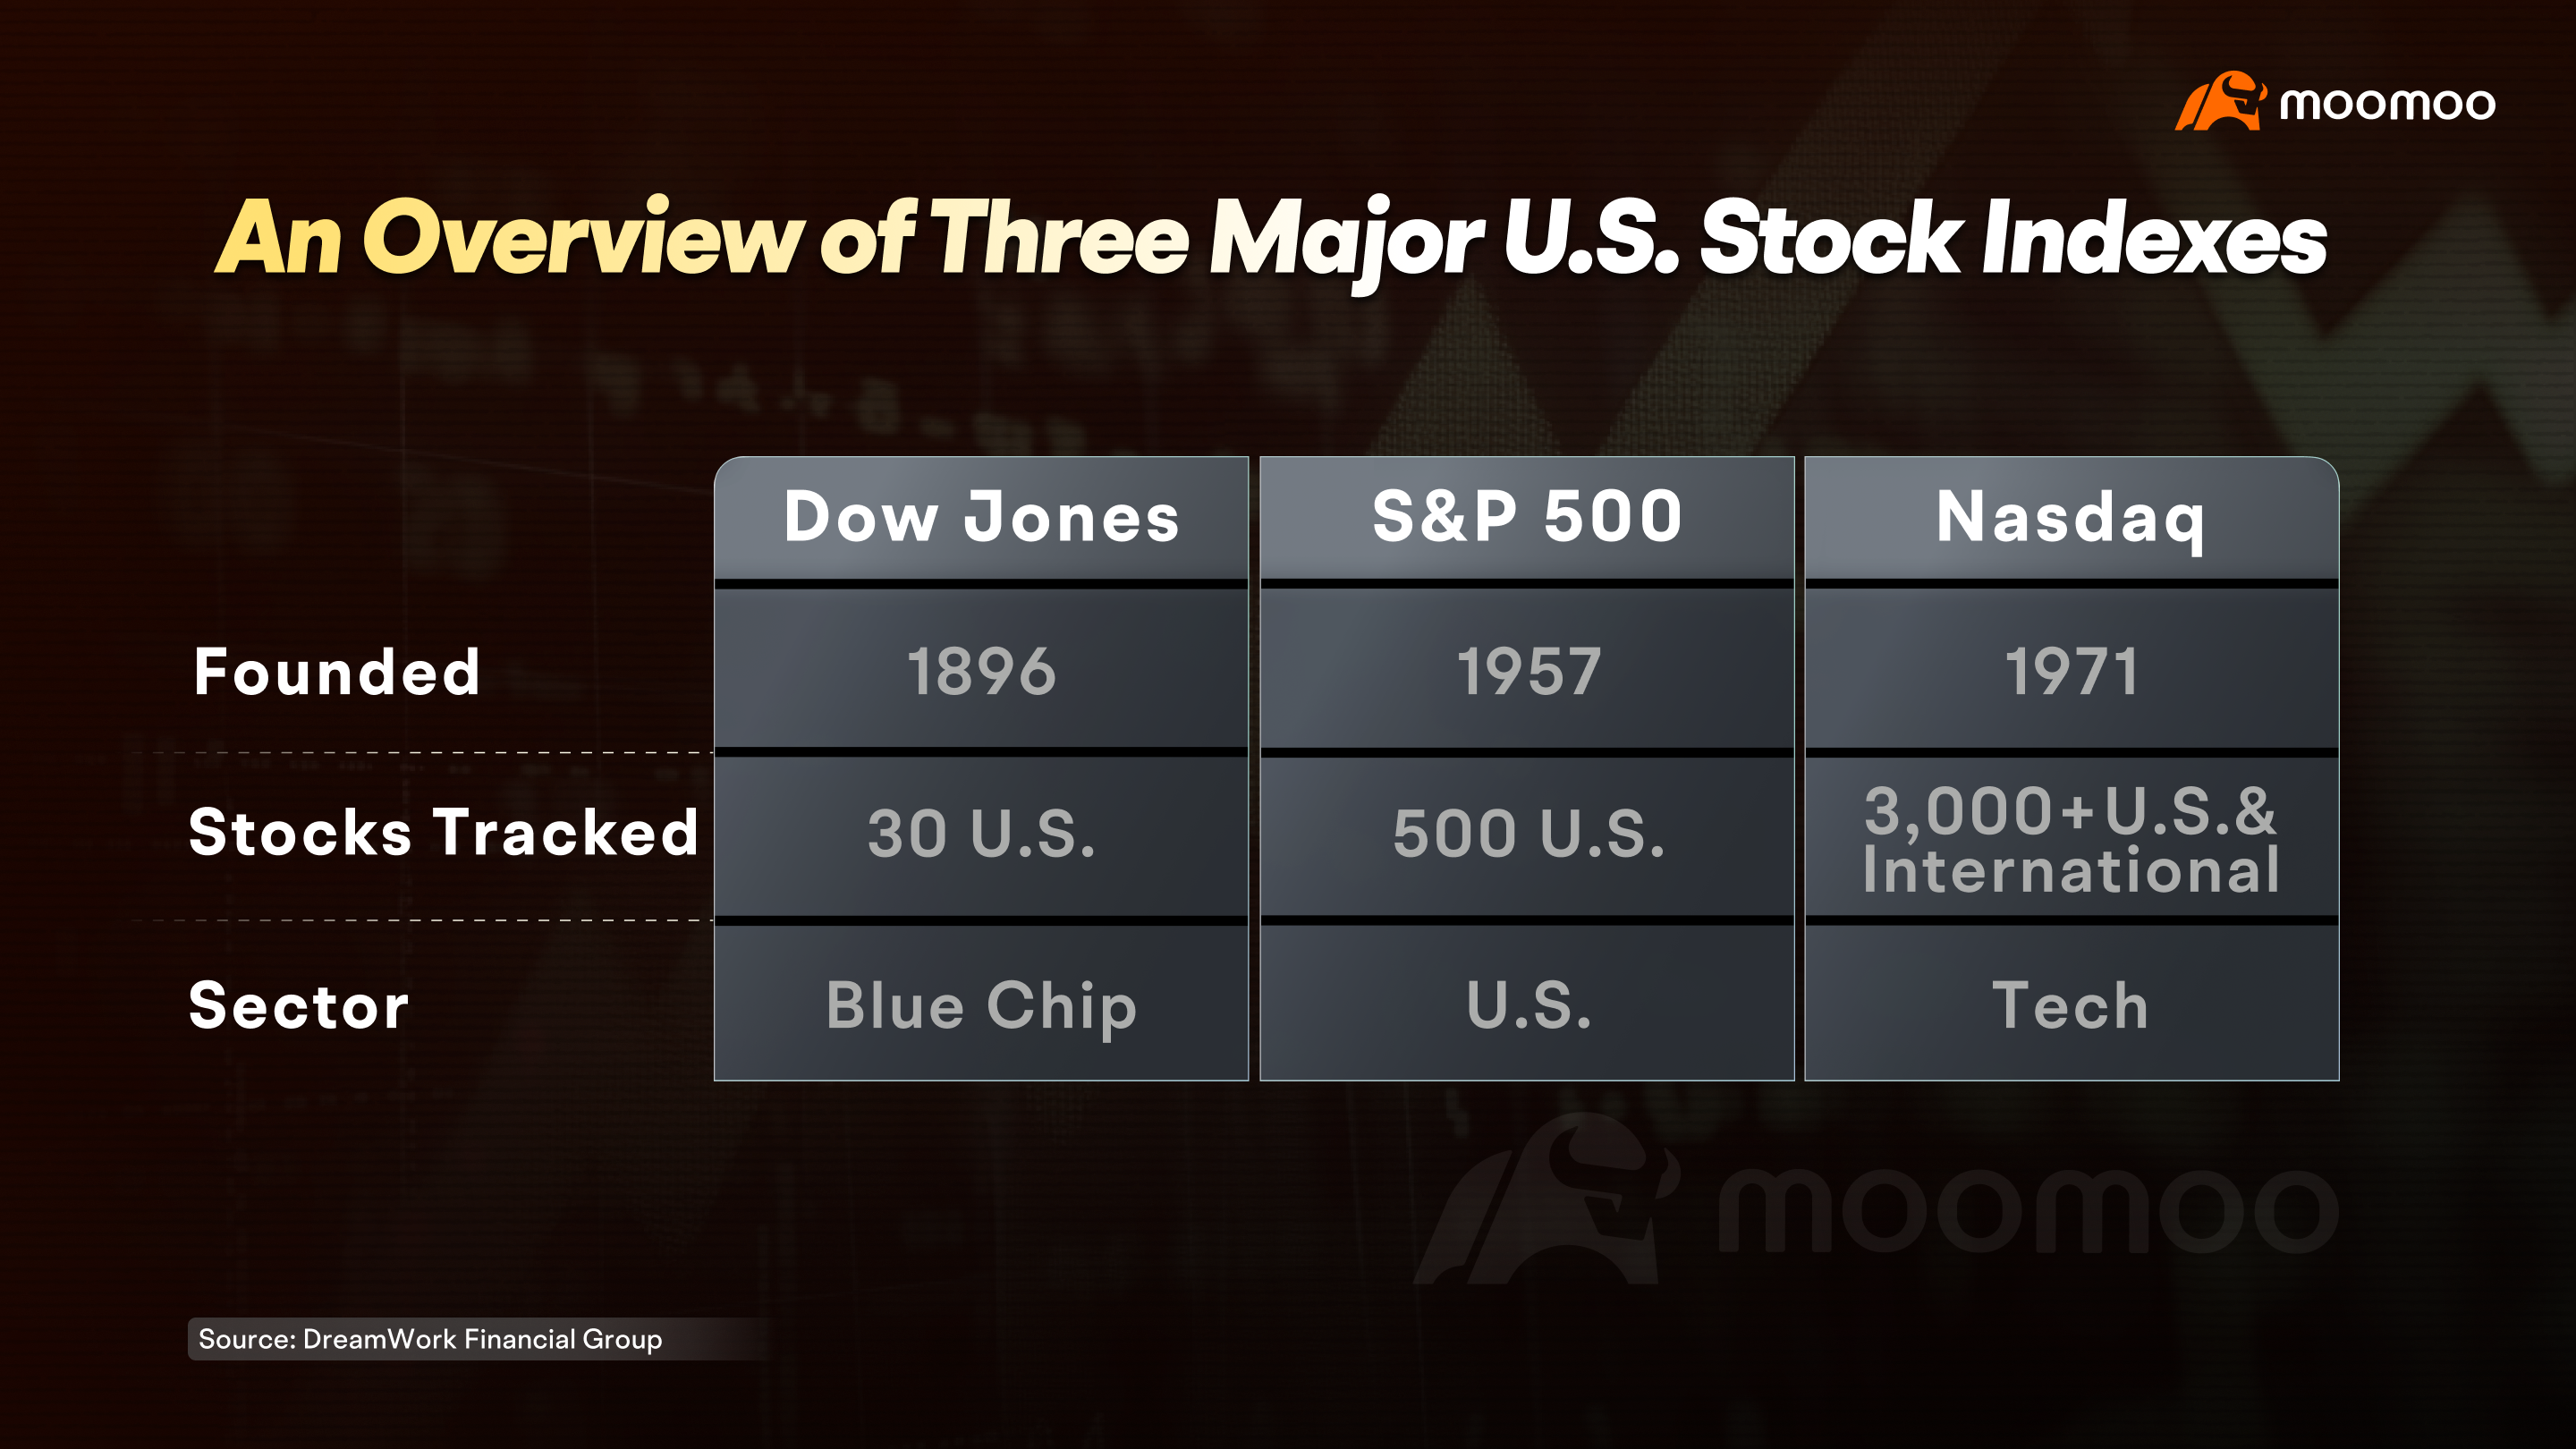
First up is the Dow Jones Industrial Average, or simply "the Dow." It's one of the oldest stock market indexes, consisting of 30 blue-chip companies known for their financial stability and consistent dividend payments.
Next, we have the S&P 500, which includes around 500 of the largest publicly traded companies in the U.S. Together, they represent about 80% of the total market value. With its broader range and diverse sectors, the S&P 500 is often seen as a more comprehensive reflection of the U.S. stock market compared to the Dow.
The Nasdaq Composite, or simply called "the Nasdaq," tracks over 3,000 stocks listed on the Nasdaq exchange. This index is heavily weighted towards technology, making tech stocks about 60% of its composition. The more concentrated Nasdaq 100 tracks 100 of the largest non-financial companies on the exchange.
Each of these indexes offers unique insights into market dynamics: if the Nasdaq is outperforming, it could signal strength in tech. Leadership from the S&P 500 might indicate broad growth across sectors, while gains in Dow often reflect the performance of large blue-chip stocks.
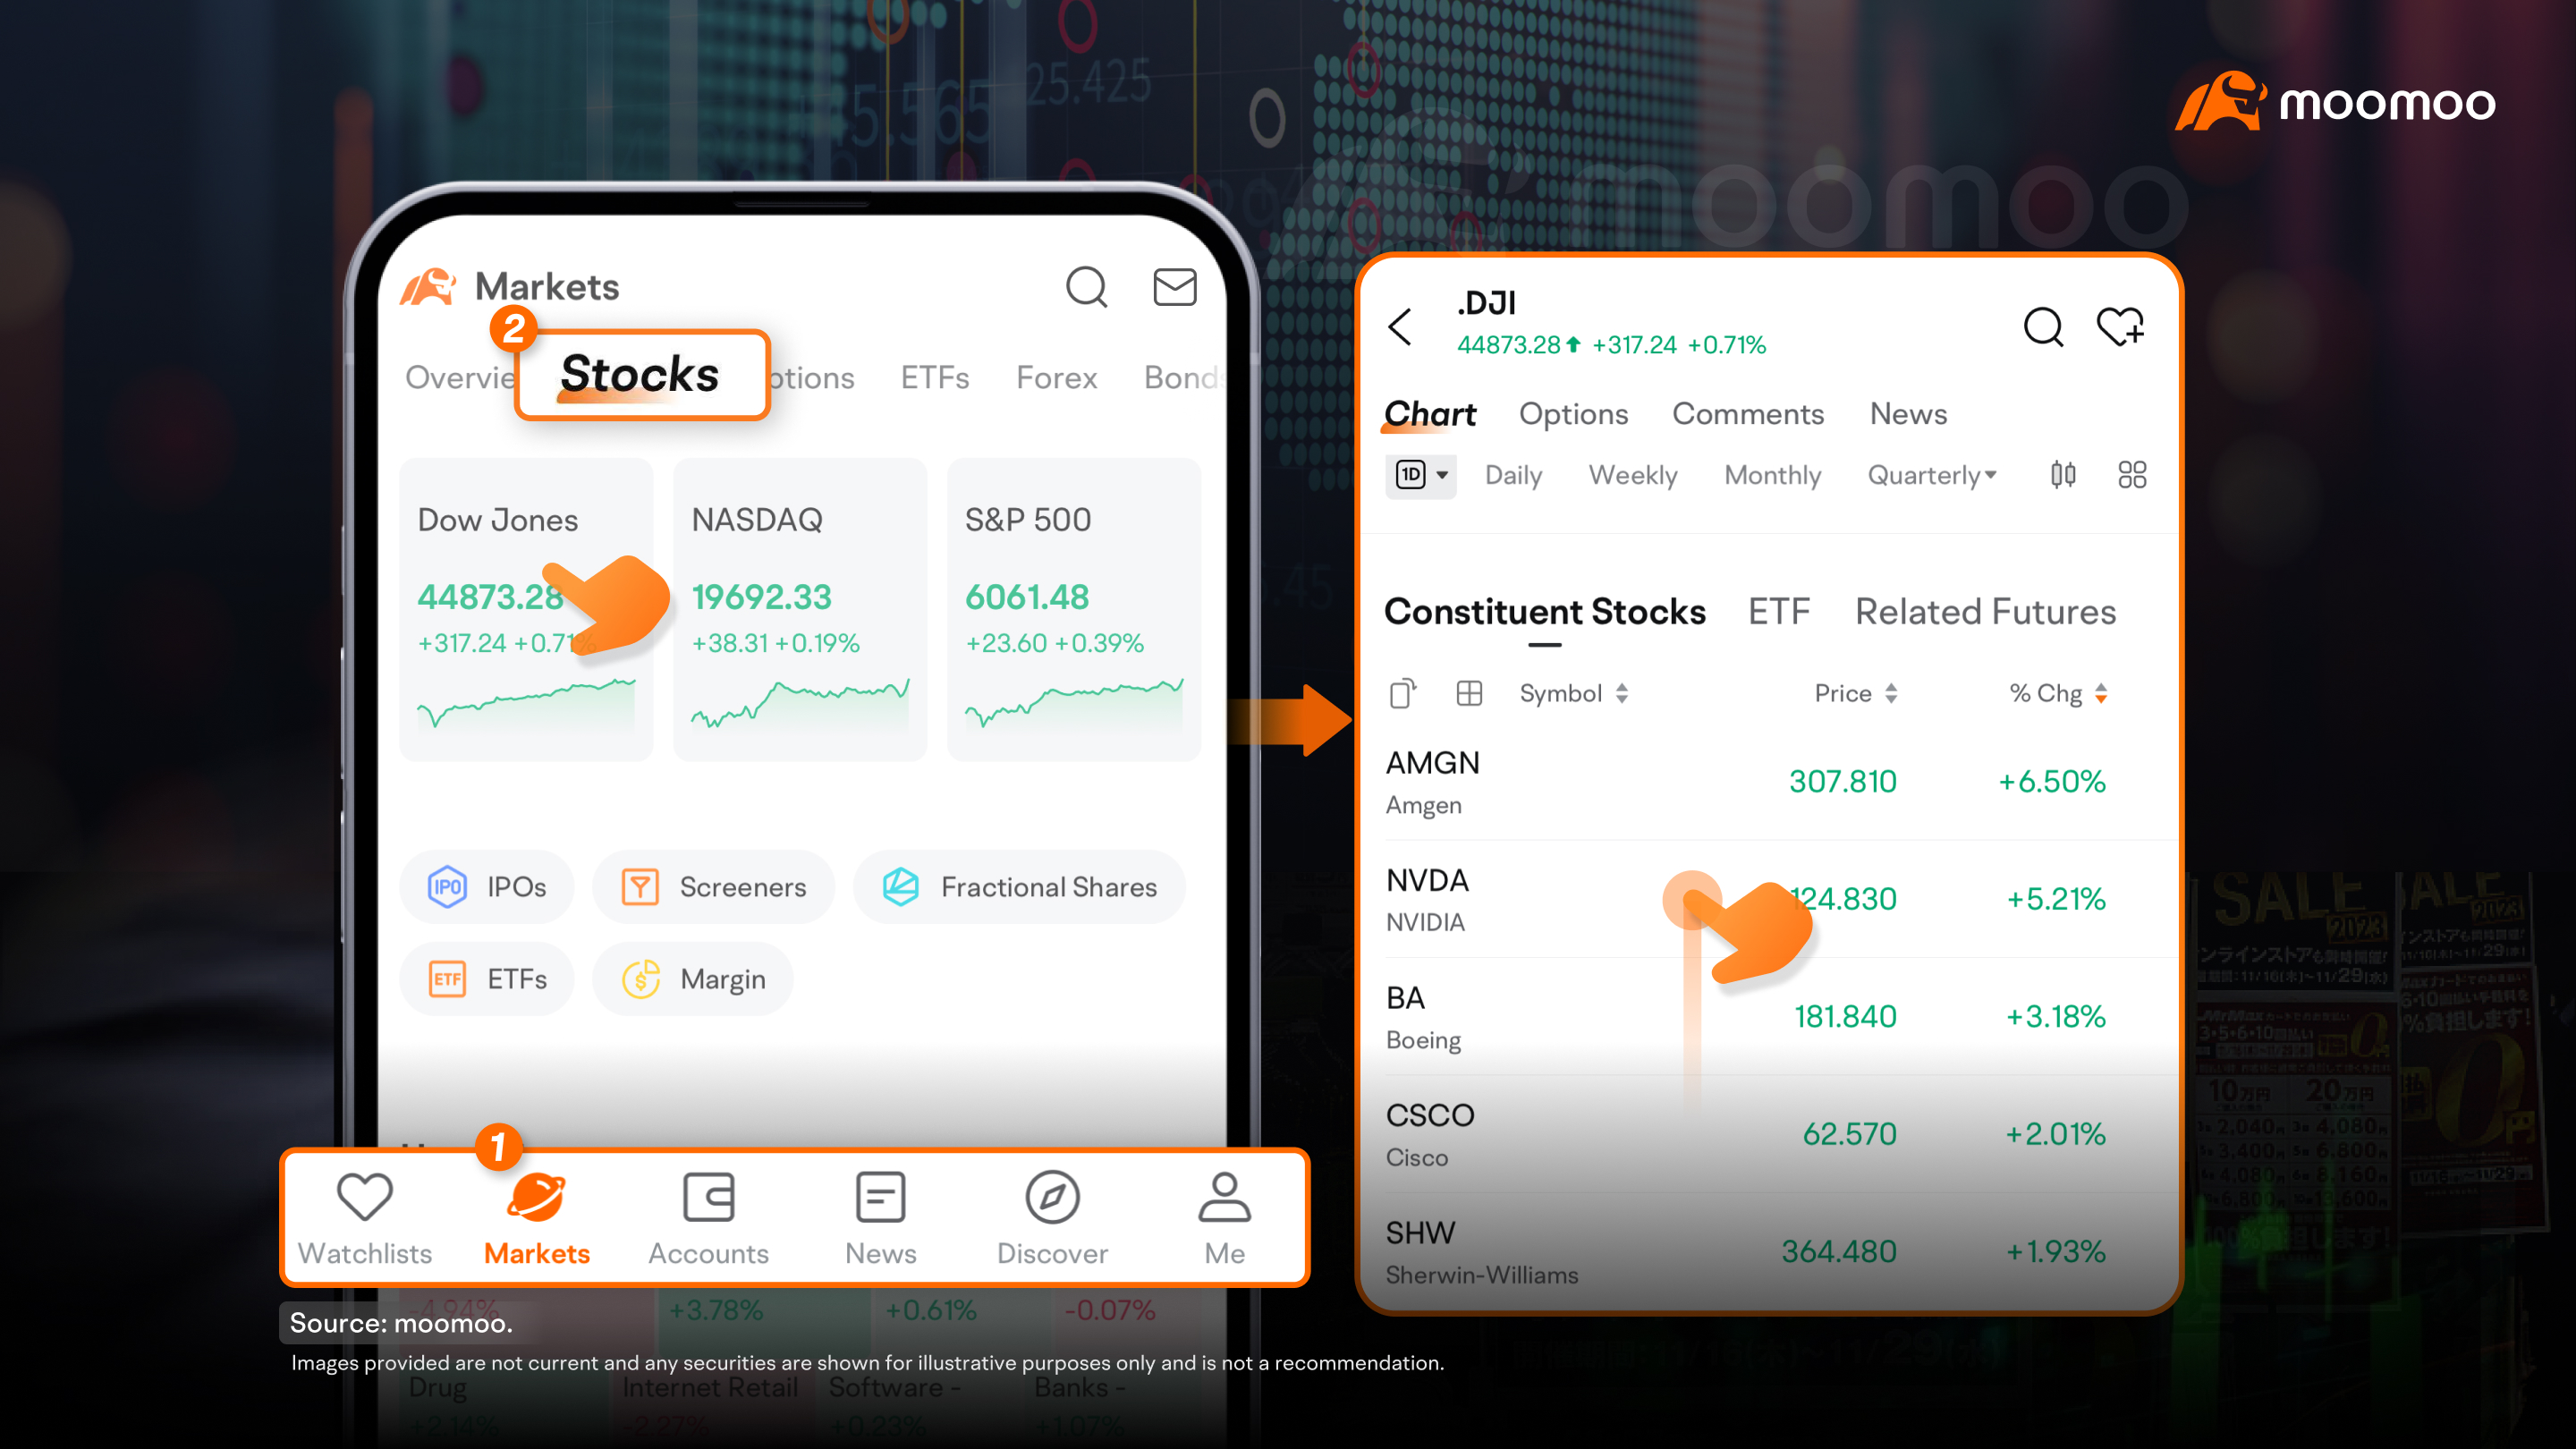
On moomoo, you can easily view real-time quotes of the three major U.S. stock indexes and access detailed information about their constituent stocks.
3. Which sectors have historically offered the potential for higher returns?
Now, let's explore which sectors have produced higher returns.
The S&P 500, for example, is made up of 11 sectors.
Over the past decade, the top three performers have been Information Technology, Consumer Discretionary, and Financials. Information Technology has really stood out, with an impressive annual return of over 20%, far ahead of the other sectors.
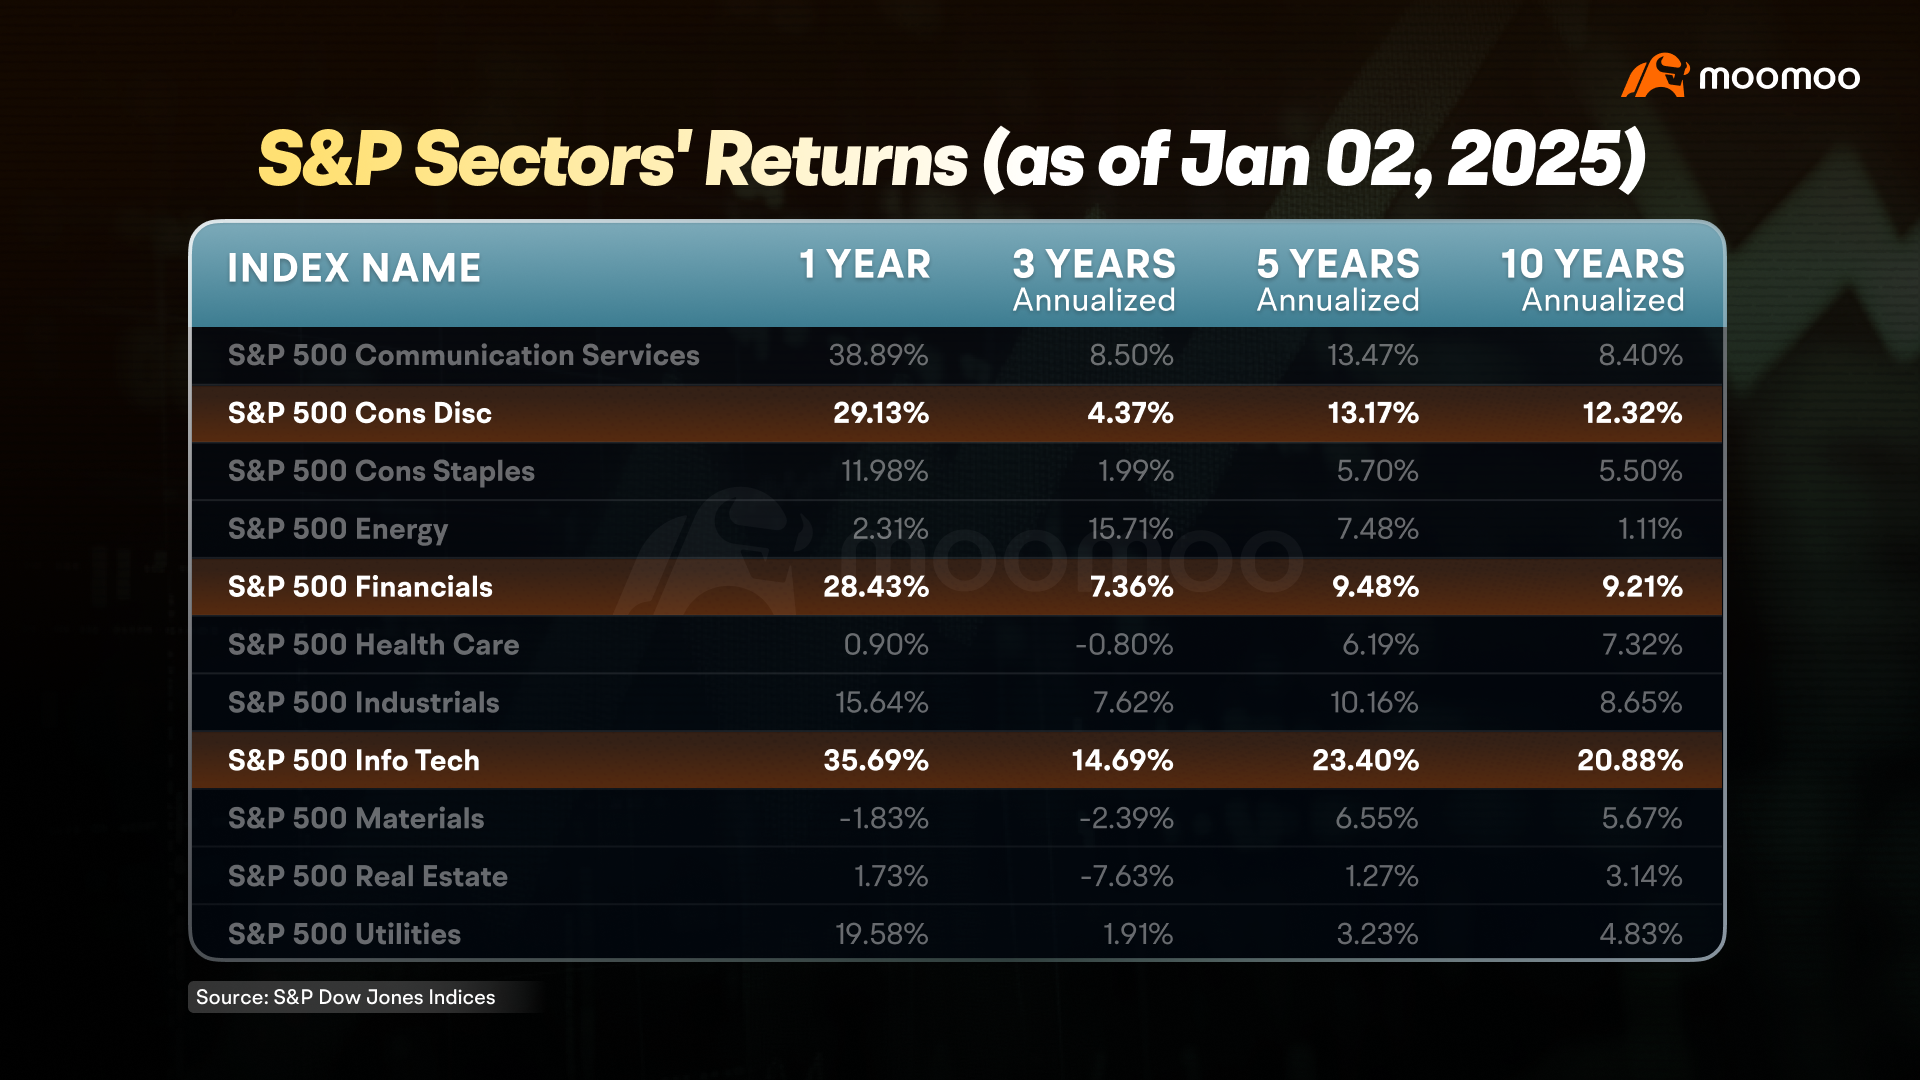
While past performance doesn't guarantee future results, looking at historical trends can still give us useful insights. In hindsight, these sectors often do well during economic growth.
In the last ten years, the U.S. economy has mostly been on the rise, especially in technology. Areas like cloud computing, semiconductors, and artificial intelligence have grown quickly, attracting a lot of investor interest and helping create jobs.
Consumer spending plays a big role in the U.S. economy, making up around 70% of GDP. When the economy is doing well, people tend to have more disposable income, which boosts demand for consumer goods. This rise in spending often benefits companies in the Consumer Discretionary sector. Similarly, the Financials sector also tends to prosper during economic growth, as more investments and transactions take place.
But if the economy takes a downturn, things can change.
Sectors that are considered defensive, like Consumer Staples, Healthcare, Energy, and Utilities, may show more stability. These sectors provide essential goods and services that people need generally, making them less affected by economic ups and downs.
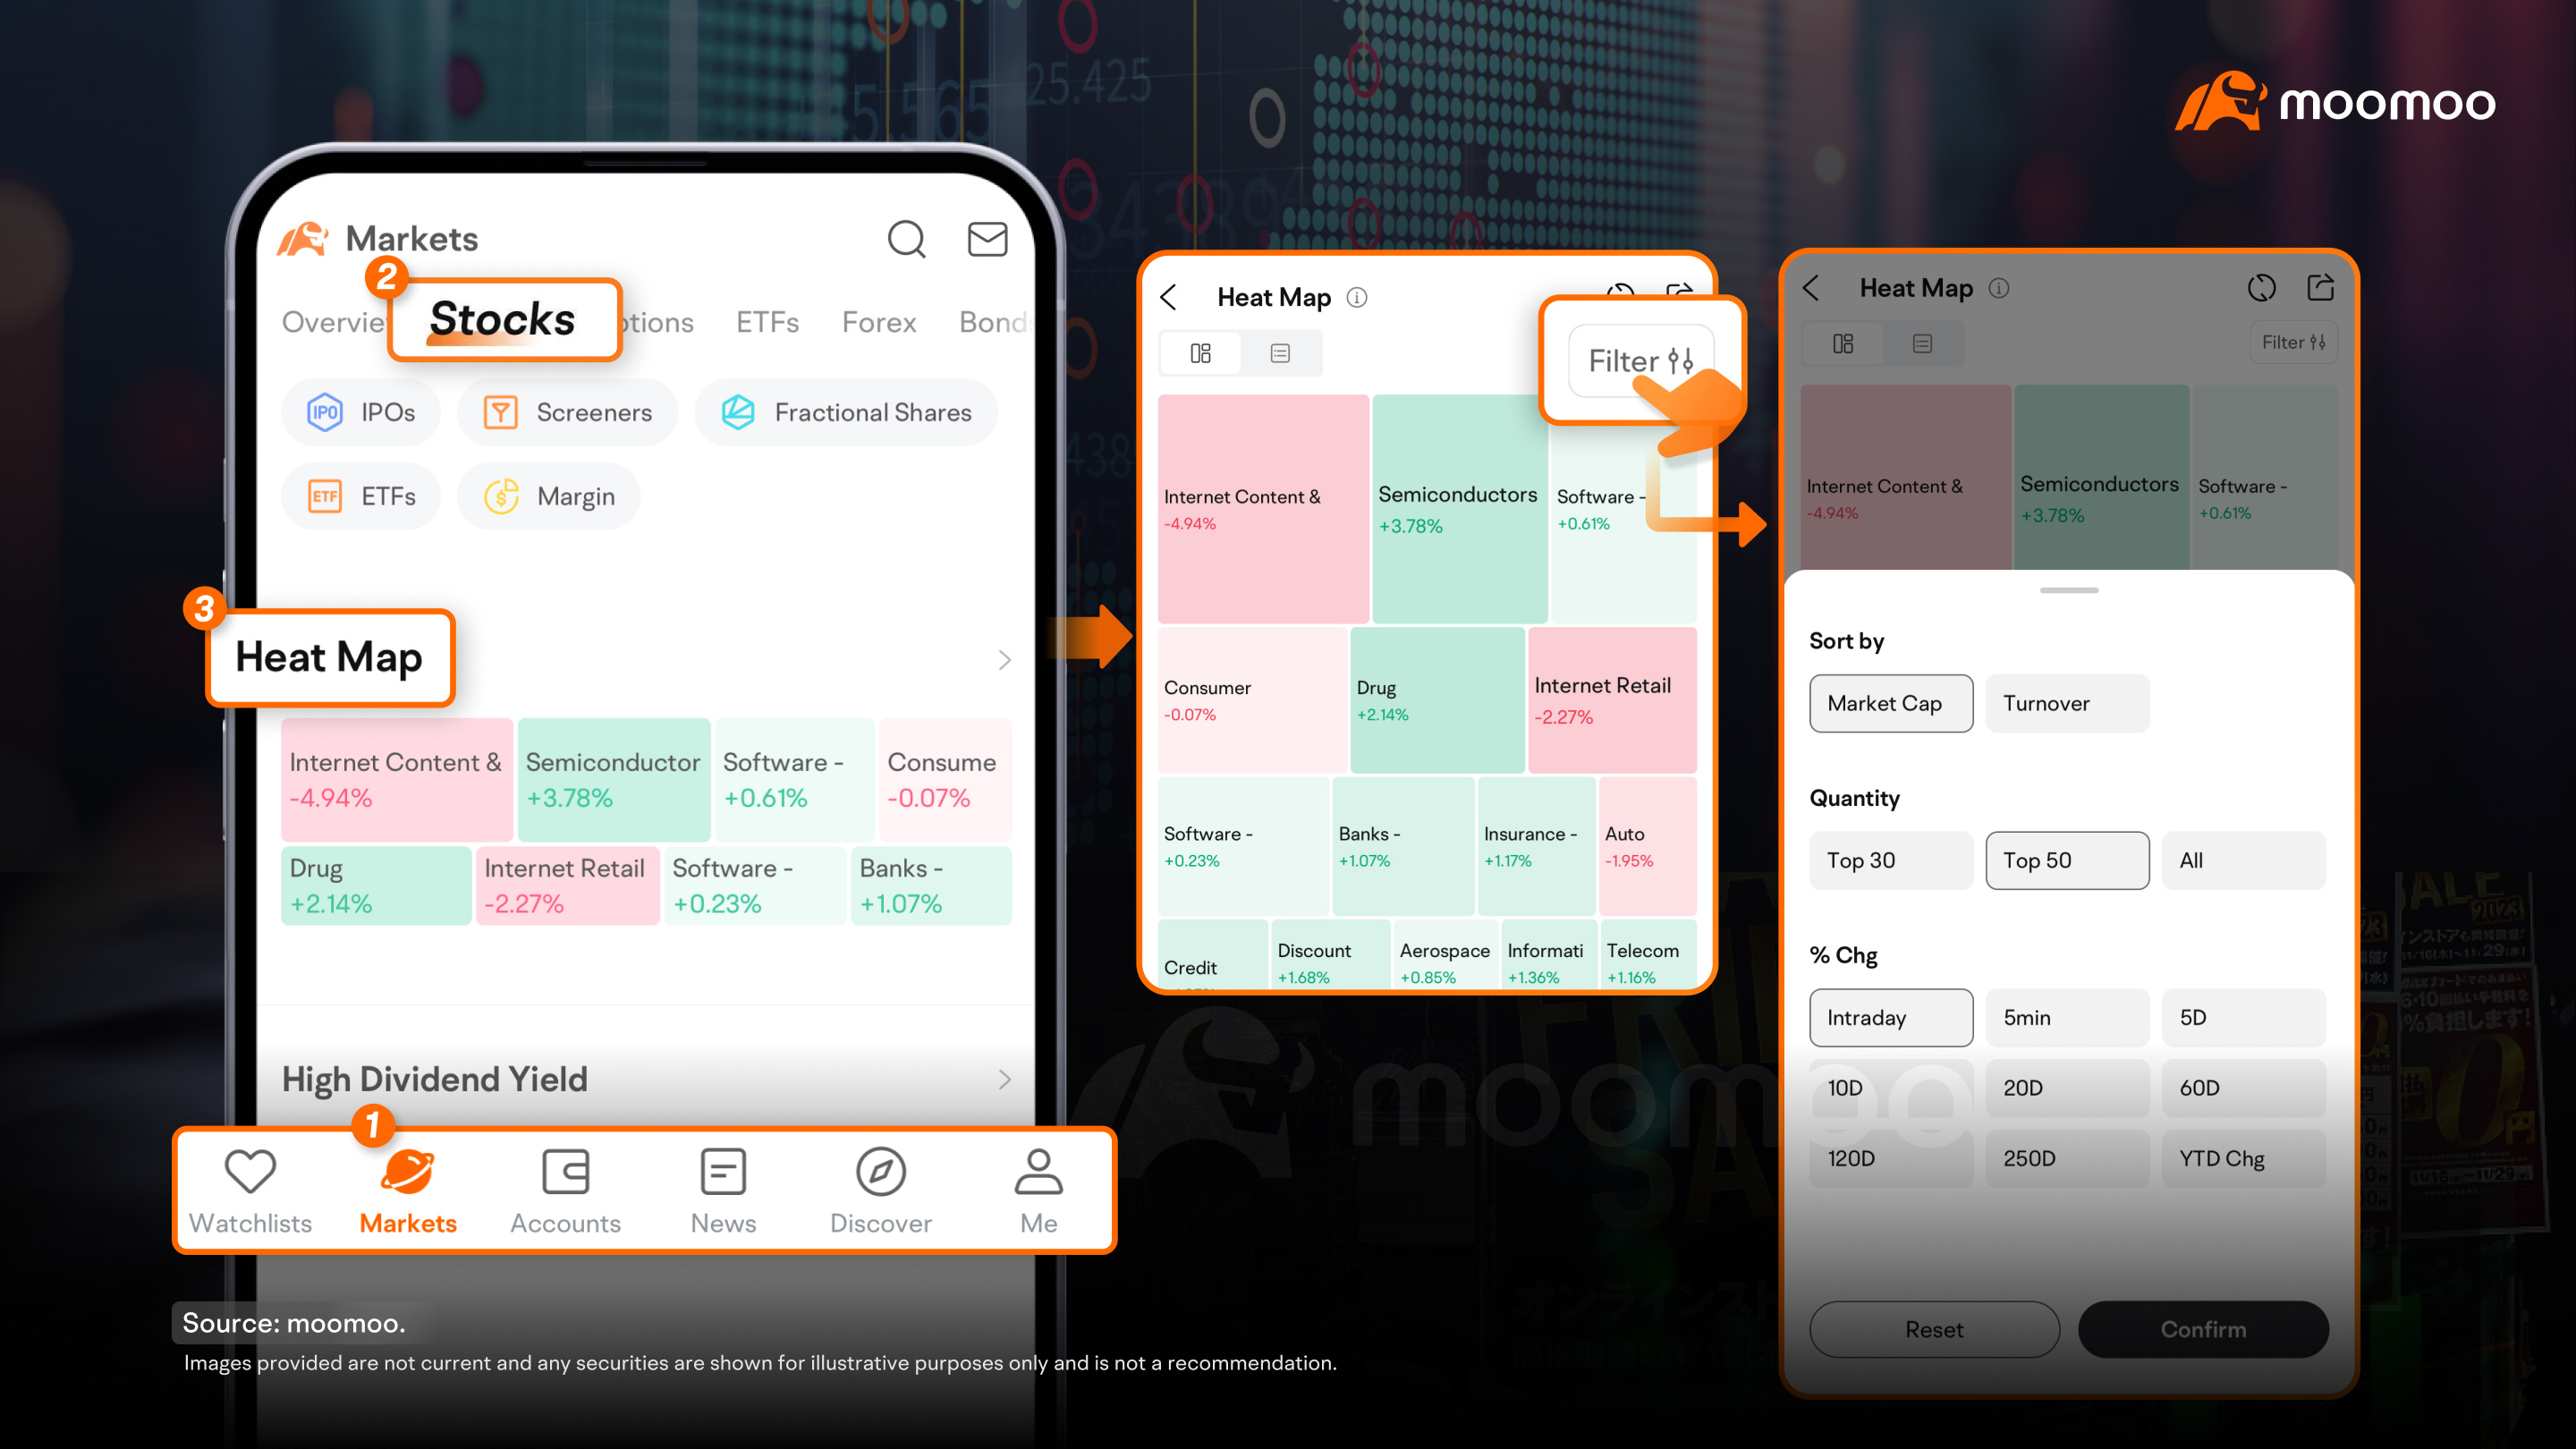
To visualize how sectors are performing, you can use the "Heat Map" feature on moomoo. To access the feature, go to "Markets", tap "stocks", and then the "Heat Map" section. You can hit the "Filter" button in the upper right corner to see recent changes in sector performance.
Disclosure:
Investing in limited economic sectors involves greater risk and potentially greater return than investing in more diversified investment strategies. To the extent that the investment strategy is concentrated in a limited number of economic sectors, those investments may be subject to legislative or regulatory changes, adverse market conditions and/or increased competition affecting those economic sectors. The prices of the securities of companies in those sectors may fluctuate widely. Investors should exercise caution and use multiple sources of information when making investment decisions. There is no guarantee or assurance that the use of any tools or data provided on the moomoo app will result in investment success or reduce investment risk.
Indexes are unmanaged and cannot be directly invested into. Past performance is no indication of future results. Investing involves risk and the potential to lose principal.
This presentation is for informational and educational use only and is not a recommendation or endorsement of any particular investment or investment strategy. Investment information provided in this content is general in nature, strictly for illustrative purposes, and may not be appropriate for all investors. Read more