GDP: The Barometer of National Prosperity
Takeaways:
GDP is a crucial metric for assessing a country's economic health
Real GDP adjusts for inflation, providing a clearer growth picture
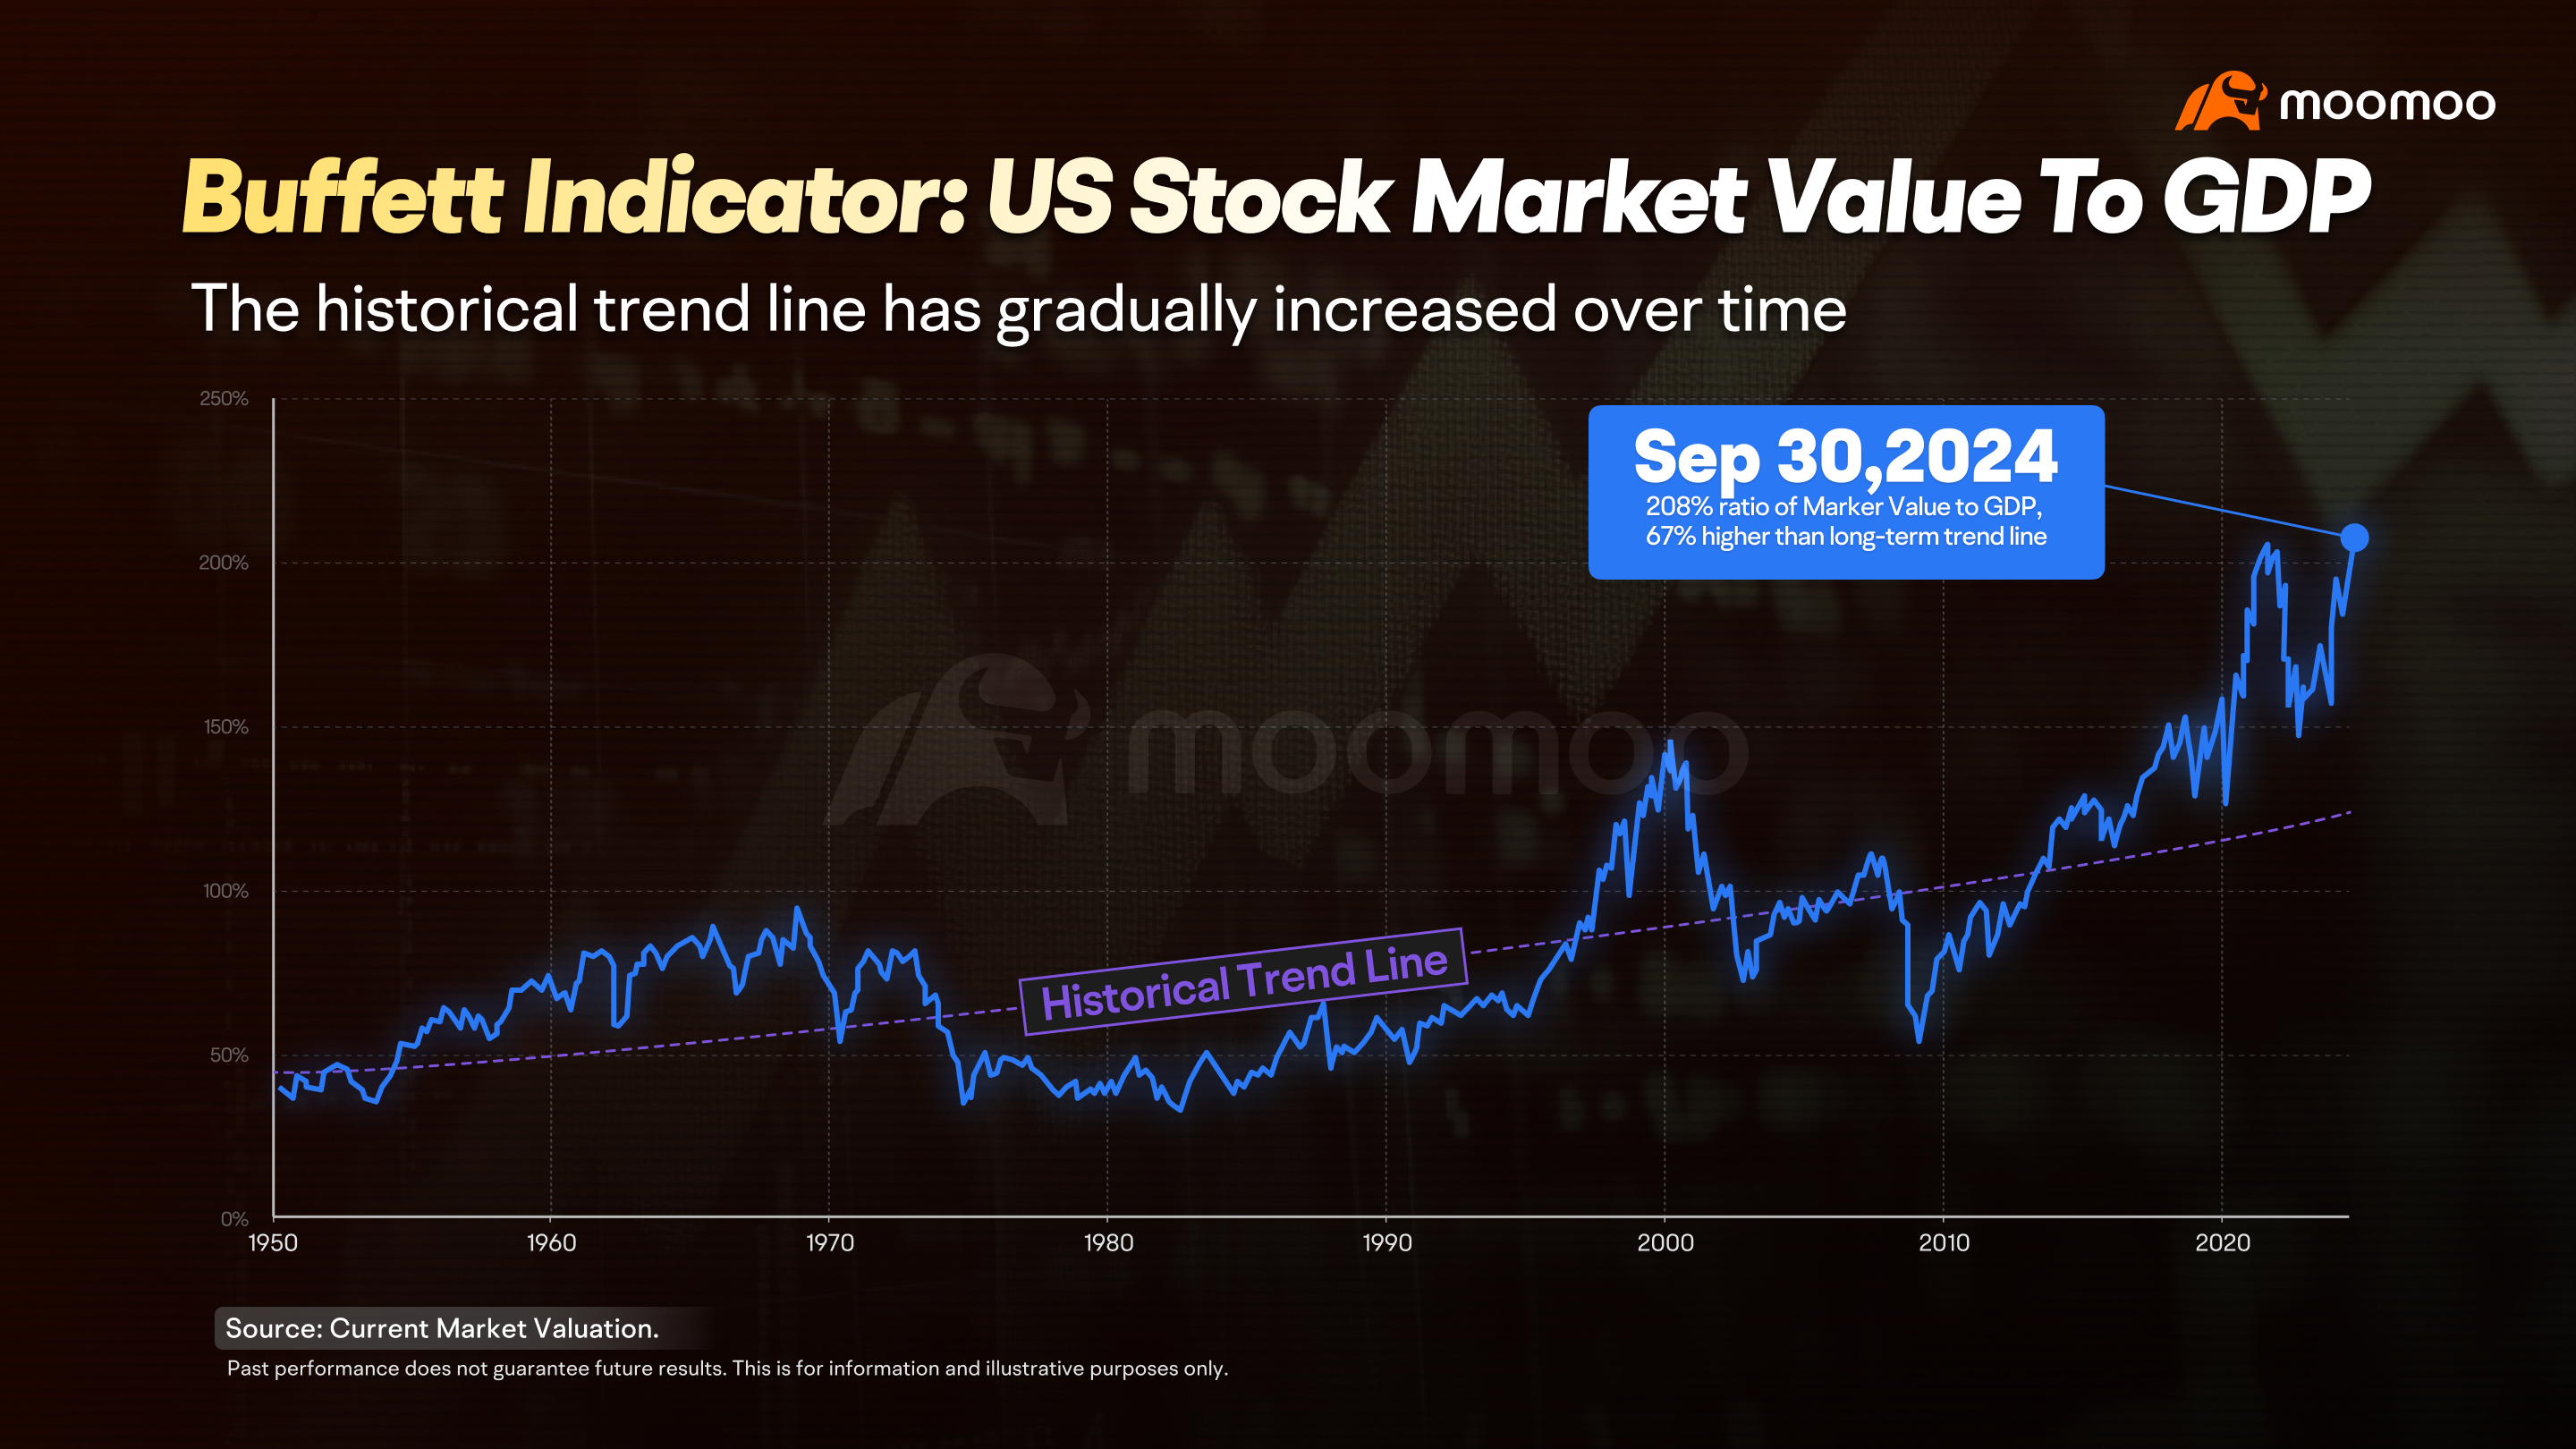
The "Buffett Indicator" assesses market valuation via the market cap to GDP ratio
When you think of macroeconomics, GDP is likely the first thing that comes to mind, much like the Statue of Liberty represents the United States. Interestingly, the concept of GDP is relatively new, having only emerged in the 1930s.
It was born out of necessity during the Great Depression when the U.S. was grappling with a severe economic crisis.
At that time, the U.S. Congress needed a way to gauge the overall economic situation, so they turned to economist Simon Kuznets. He developed an indicator that could reflect the nation’s economic health, and that’s how GDP came into existence.
GDP, or Gross Domestic Product, measures the total value of all final goods and services produced within a country’s borders over a specific period. Over the years, GDP has become the key metric for tracking a nation’s economic growth, earning its reputation as one of the "greatest inventions of the 20th century."
1. Calculating GDP
Economic growth is like an annual report card for a country, with GDP as the 'overall score' that captures global attention. It gives us a clear picture of total economic activity, showing how healthy and large an economy is.
As of 2023, the United States has the highest GDP in the world, accounting for nearly 26% of the global total, with China following closely at around 17%.

So, how do we calculate GDP? There are three main ways to do it: the production approach, the income approach, and the expenditure approach.
The production approach measures the value added by each industry. The income approach adds up all the incomes—like wages, interest, and profits. And then we have the expenditure approach, which totals all the spending on final goods and services in the economy.
While these methods are supposed to give us the same result, sometimes they can differ due to how data is collected and measured.
The expenditure approach is often the most straightforward; it directly reflects how economic activity is used, and the data is easier to collect.
The formula for the expenditure approach is simple:
GDP=Consumption+Private Investment+Government Spending+Net Exports
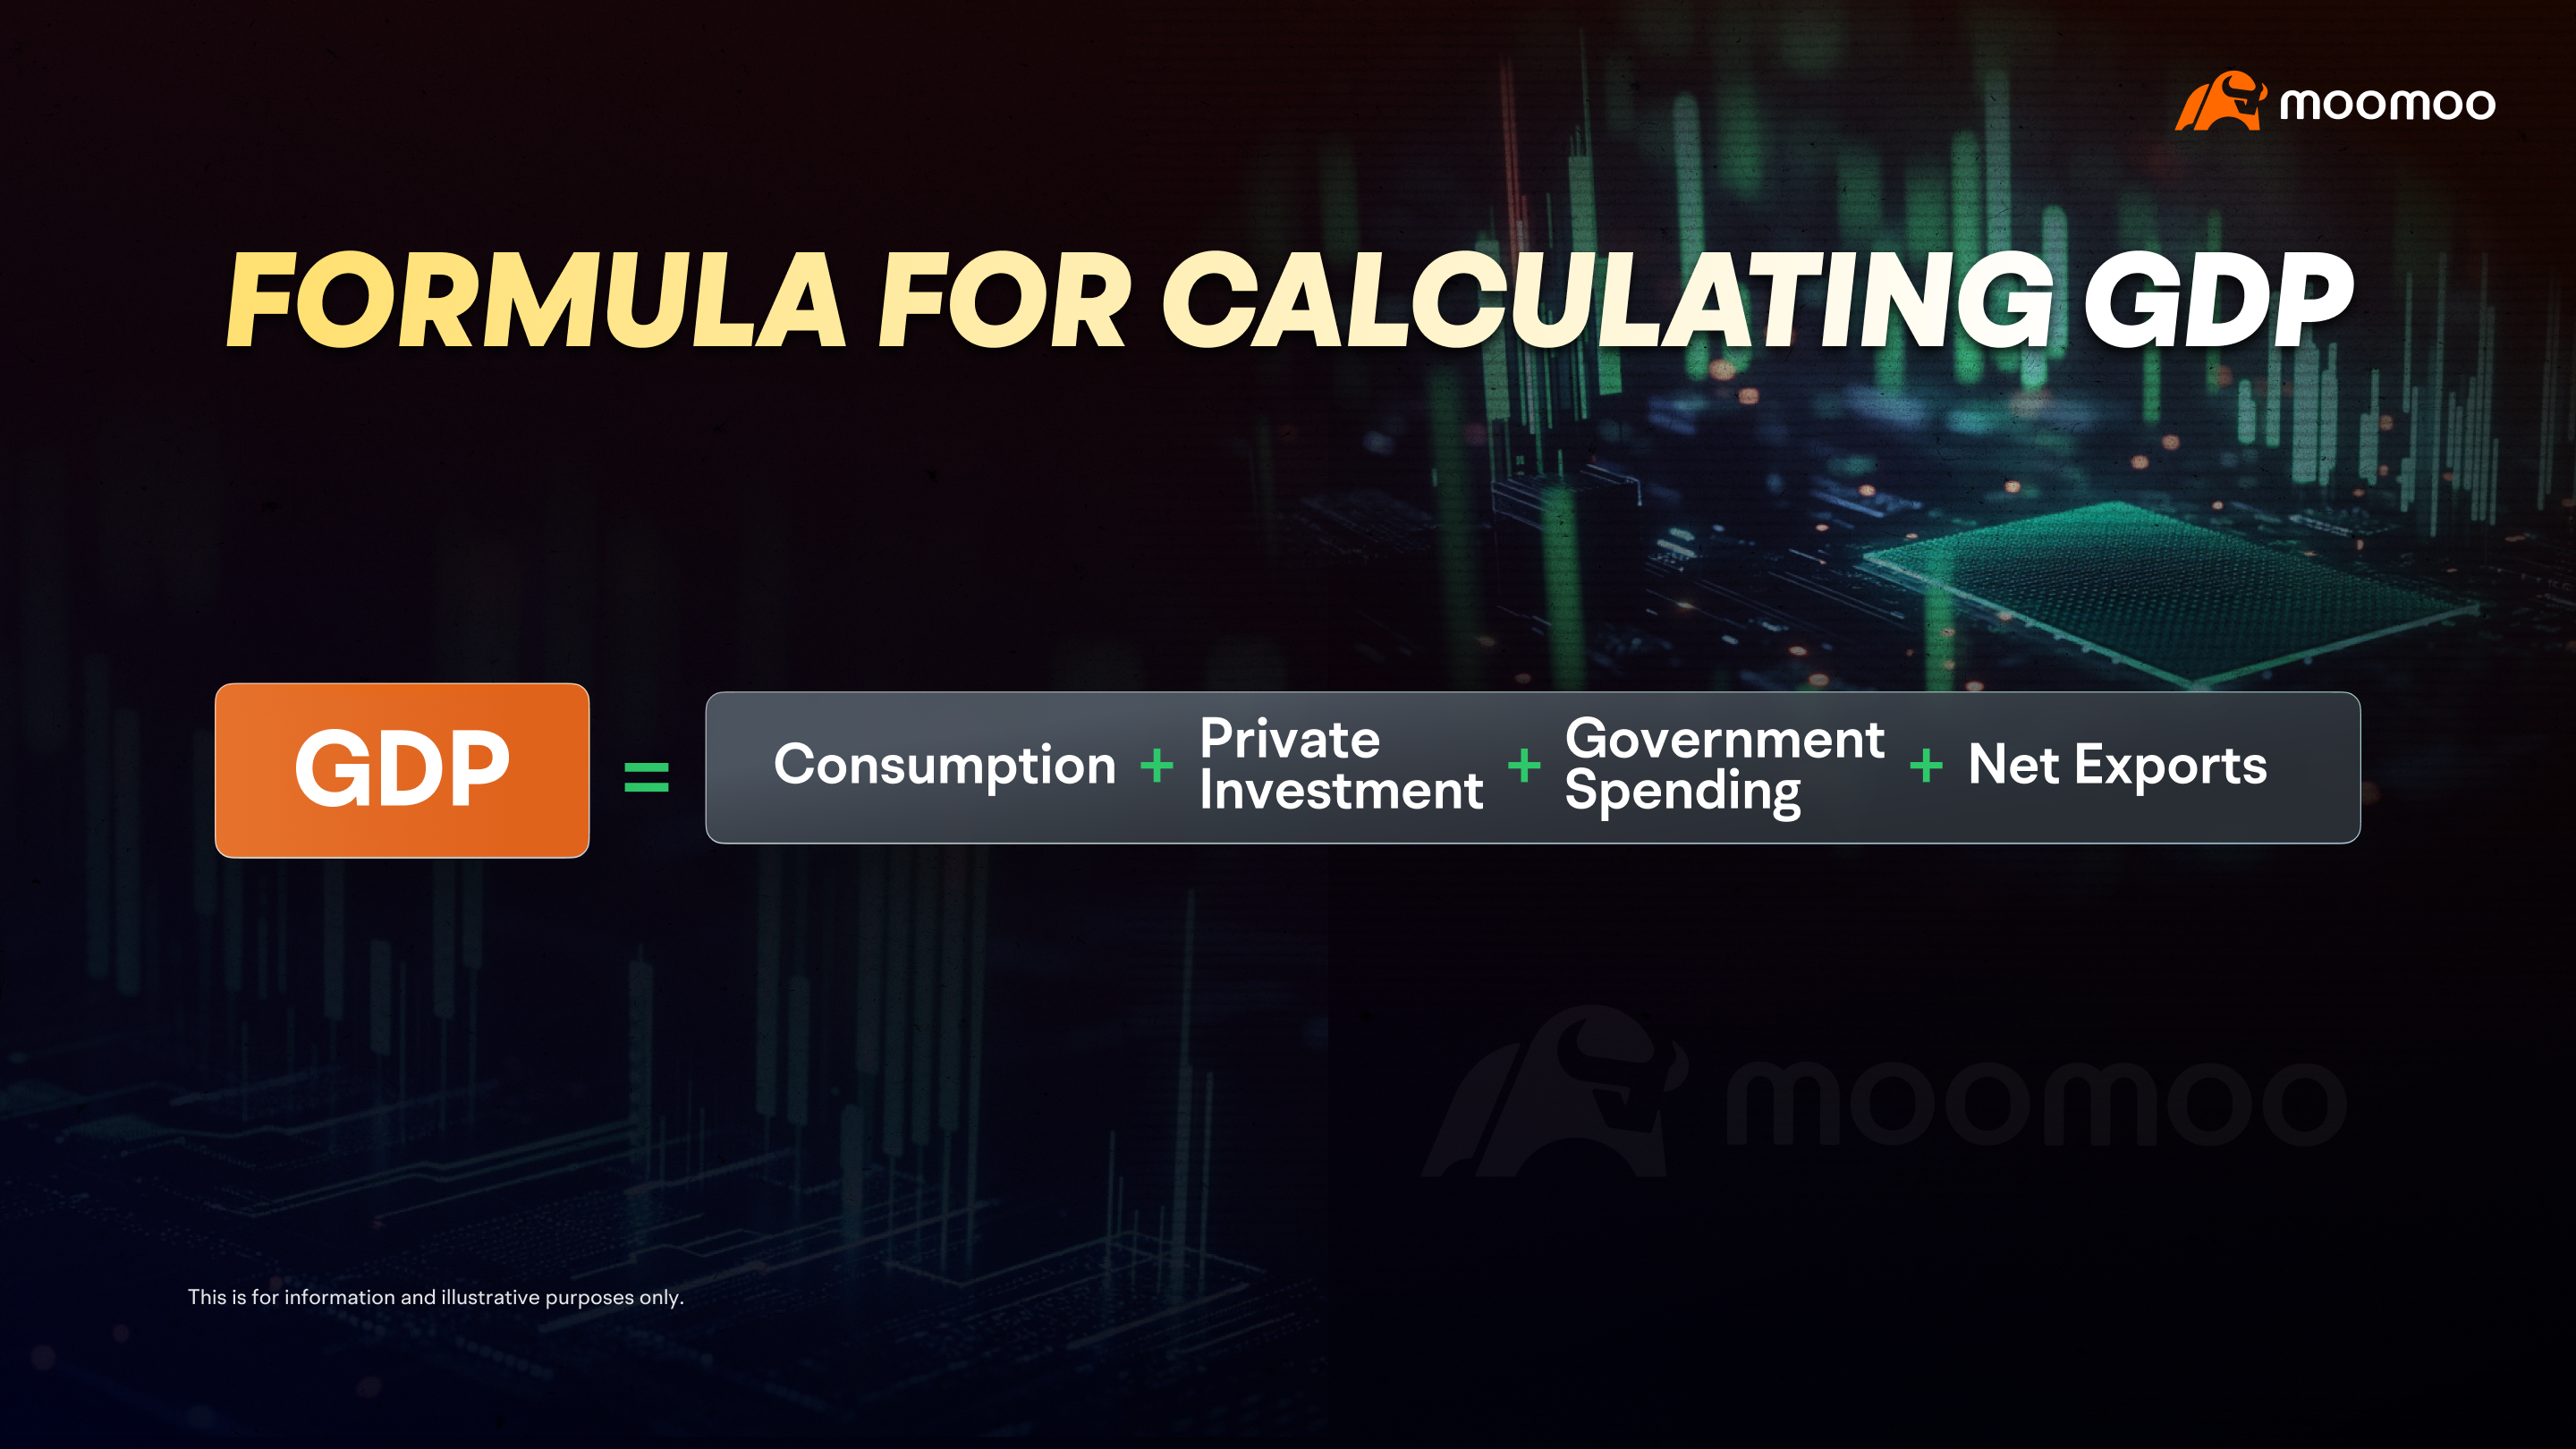
Consumption: This is all about the total spending by households or individuals on goods and services. Typically, it’s the largest part of GDP and includes everyday expenses like groceries, rent, healthcare, education, and entertainment.
Private Investment: This refers to the money businesses spend on capital goods, such as building factories or buying equipment. It also includes changes in business inventories.
Government Spending: This covers what the government spends on goods and services, like infrastructure, education, defense, and public safety. It’s important to note that this doesn’t include transfer payments, like pensions or unemployment benefits, since those don’t involve direct purchases of goods or services.
Net Exports: This is the difference between what a country exports and imports. Exports are goods and services made at home and sold abroad, while imports are those bought from other countries. If a country has positive net exports, it indicates a "trade surplus," and if it’s negative, that means a "trade deficit."
Feeling a bit overwhelmed? Let’s break it down with a simple example:
Imagine a car dealer sells four cars in one day:
The first car is bought by a family for their travels—this counts as consumption.
The second car is purchased by a company for client hospitality, which falls under private investment.
The third car is acquired by a government agency to be used as a police vehicle, making it government spending.
The fourth car is shipped overseas and sold to an international customer, which can be considered net exports.
2. Understanding GDP
GDP is an important tool for economists. It gives valuable insights that help shape government policies. For investors, even though the stock market doesn’t always reflect the economy perfectly, a strong economy usually leads to better returns.
The U.S. economy has been a global leader for a long time, and its stock market often stands out.
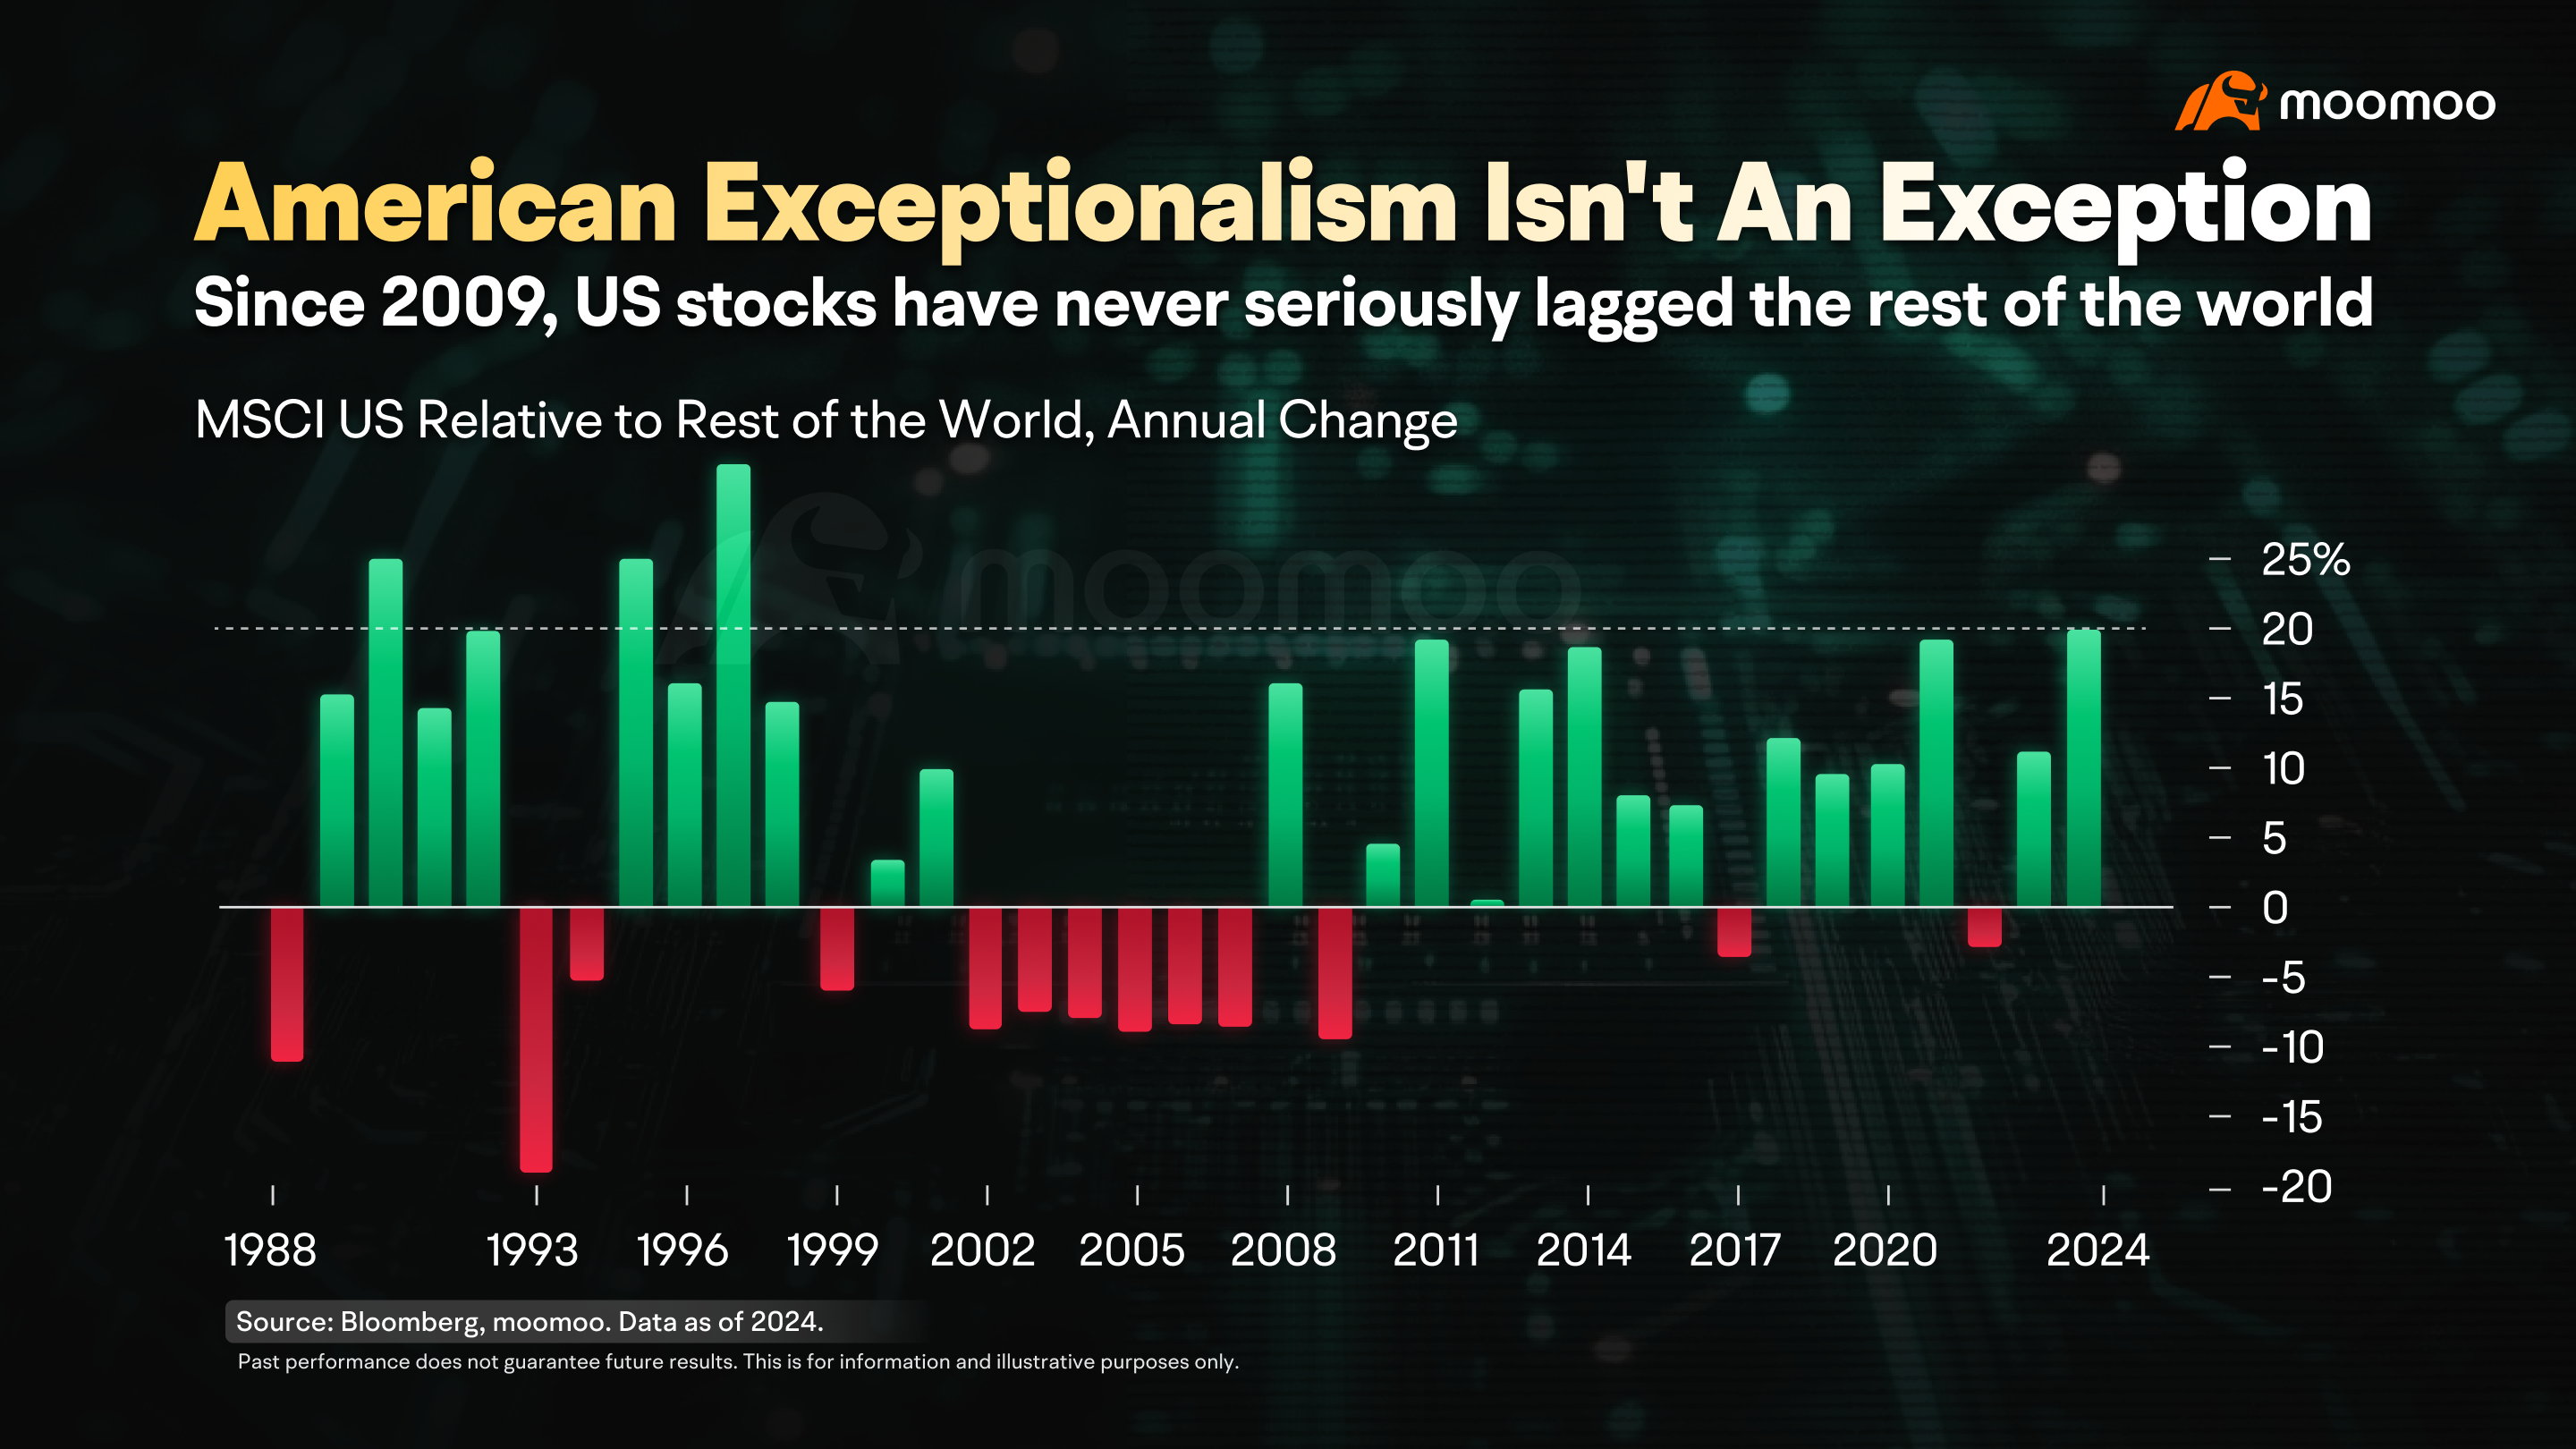
According to Bloomberg, since the late 1980s, the U.S. stock market has frequently outperformed other markets around the world. In fact, in the 15 years after the 2008 financial crisis, the U.S. market consistently did better than others, sometimes by nearly 20%.
This trend is often called "American Exceptionalism." However, given its strong performance over the years, it might feel less like an exception and more like the standard.
GDP can be looked at in two ways: nominal GDP and real GDP. The key difference between them is the "deflator," which adjusts for price increases. For example, if prices rise by 3% in a year, the deflator would be 1.03. By dividing that year’s nominal GDP by 1.03, you get the real GDP.
Because prices generally rise over time, nominal GDP is usually higher than real GDP. Real GDP accounts for inflation, giving us a clearer picture of a country's actual production levels. In everyday conversations, we mostly refer to real GDP.
We can also look at both the absolute level of GDP and its growth rate. A higher GDP means more economic value is being created in a given time frame, which signifies stronger economic power. For instance, in 2023, the U.S. GDP exceeded $27 trillion, surpassing the combined of China, Germany, and Japan.
A higher GDP growth rate signals faster economic expansion. Some Southeast Asian countries have maintained high growth rates after the pandemic, even with smaller economies.
In the U.S., the Bureau of Economic Analysis (BEA) is in charge of collecting and releasing GDP data. They publish preliminary estimates for the previous year's GDP at the end of January, followed by revisions and updates. Quarterly GDP data comes out in January, April, July, and October.
Therefore, GDP is considered a lagging indicator. It doesn’t point you to specific industries or companies but helps you understand the overall economic landscape and where we are in the economic cycle.
3. Buffet Indicator
Another useful measure is the ratio of a country's total market capitalization (TMC) to GDP. This ratio helps assess whether the market is overvalued. Warren Buffett introduced this method, known as the "Buffett Indicator." In an interview, Buffett mentioned, "It is probably the best single measure of where valuations stand at any given moment."
Back in 2001, when Buffett introduced this indicator after the dot-com bubble burst, a TMC-to-GDP ratio over 100% was seen as a sign of market overvaluation. However, the average ratio has gradually increased over time. By the third quarter of 2024, it had surpassed 200% without any significant market correction.
4. Accessing GDP Data on moomoo
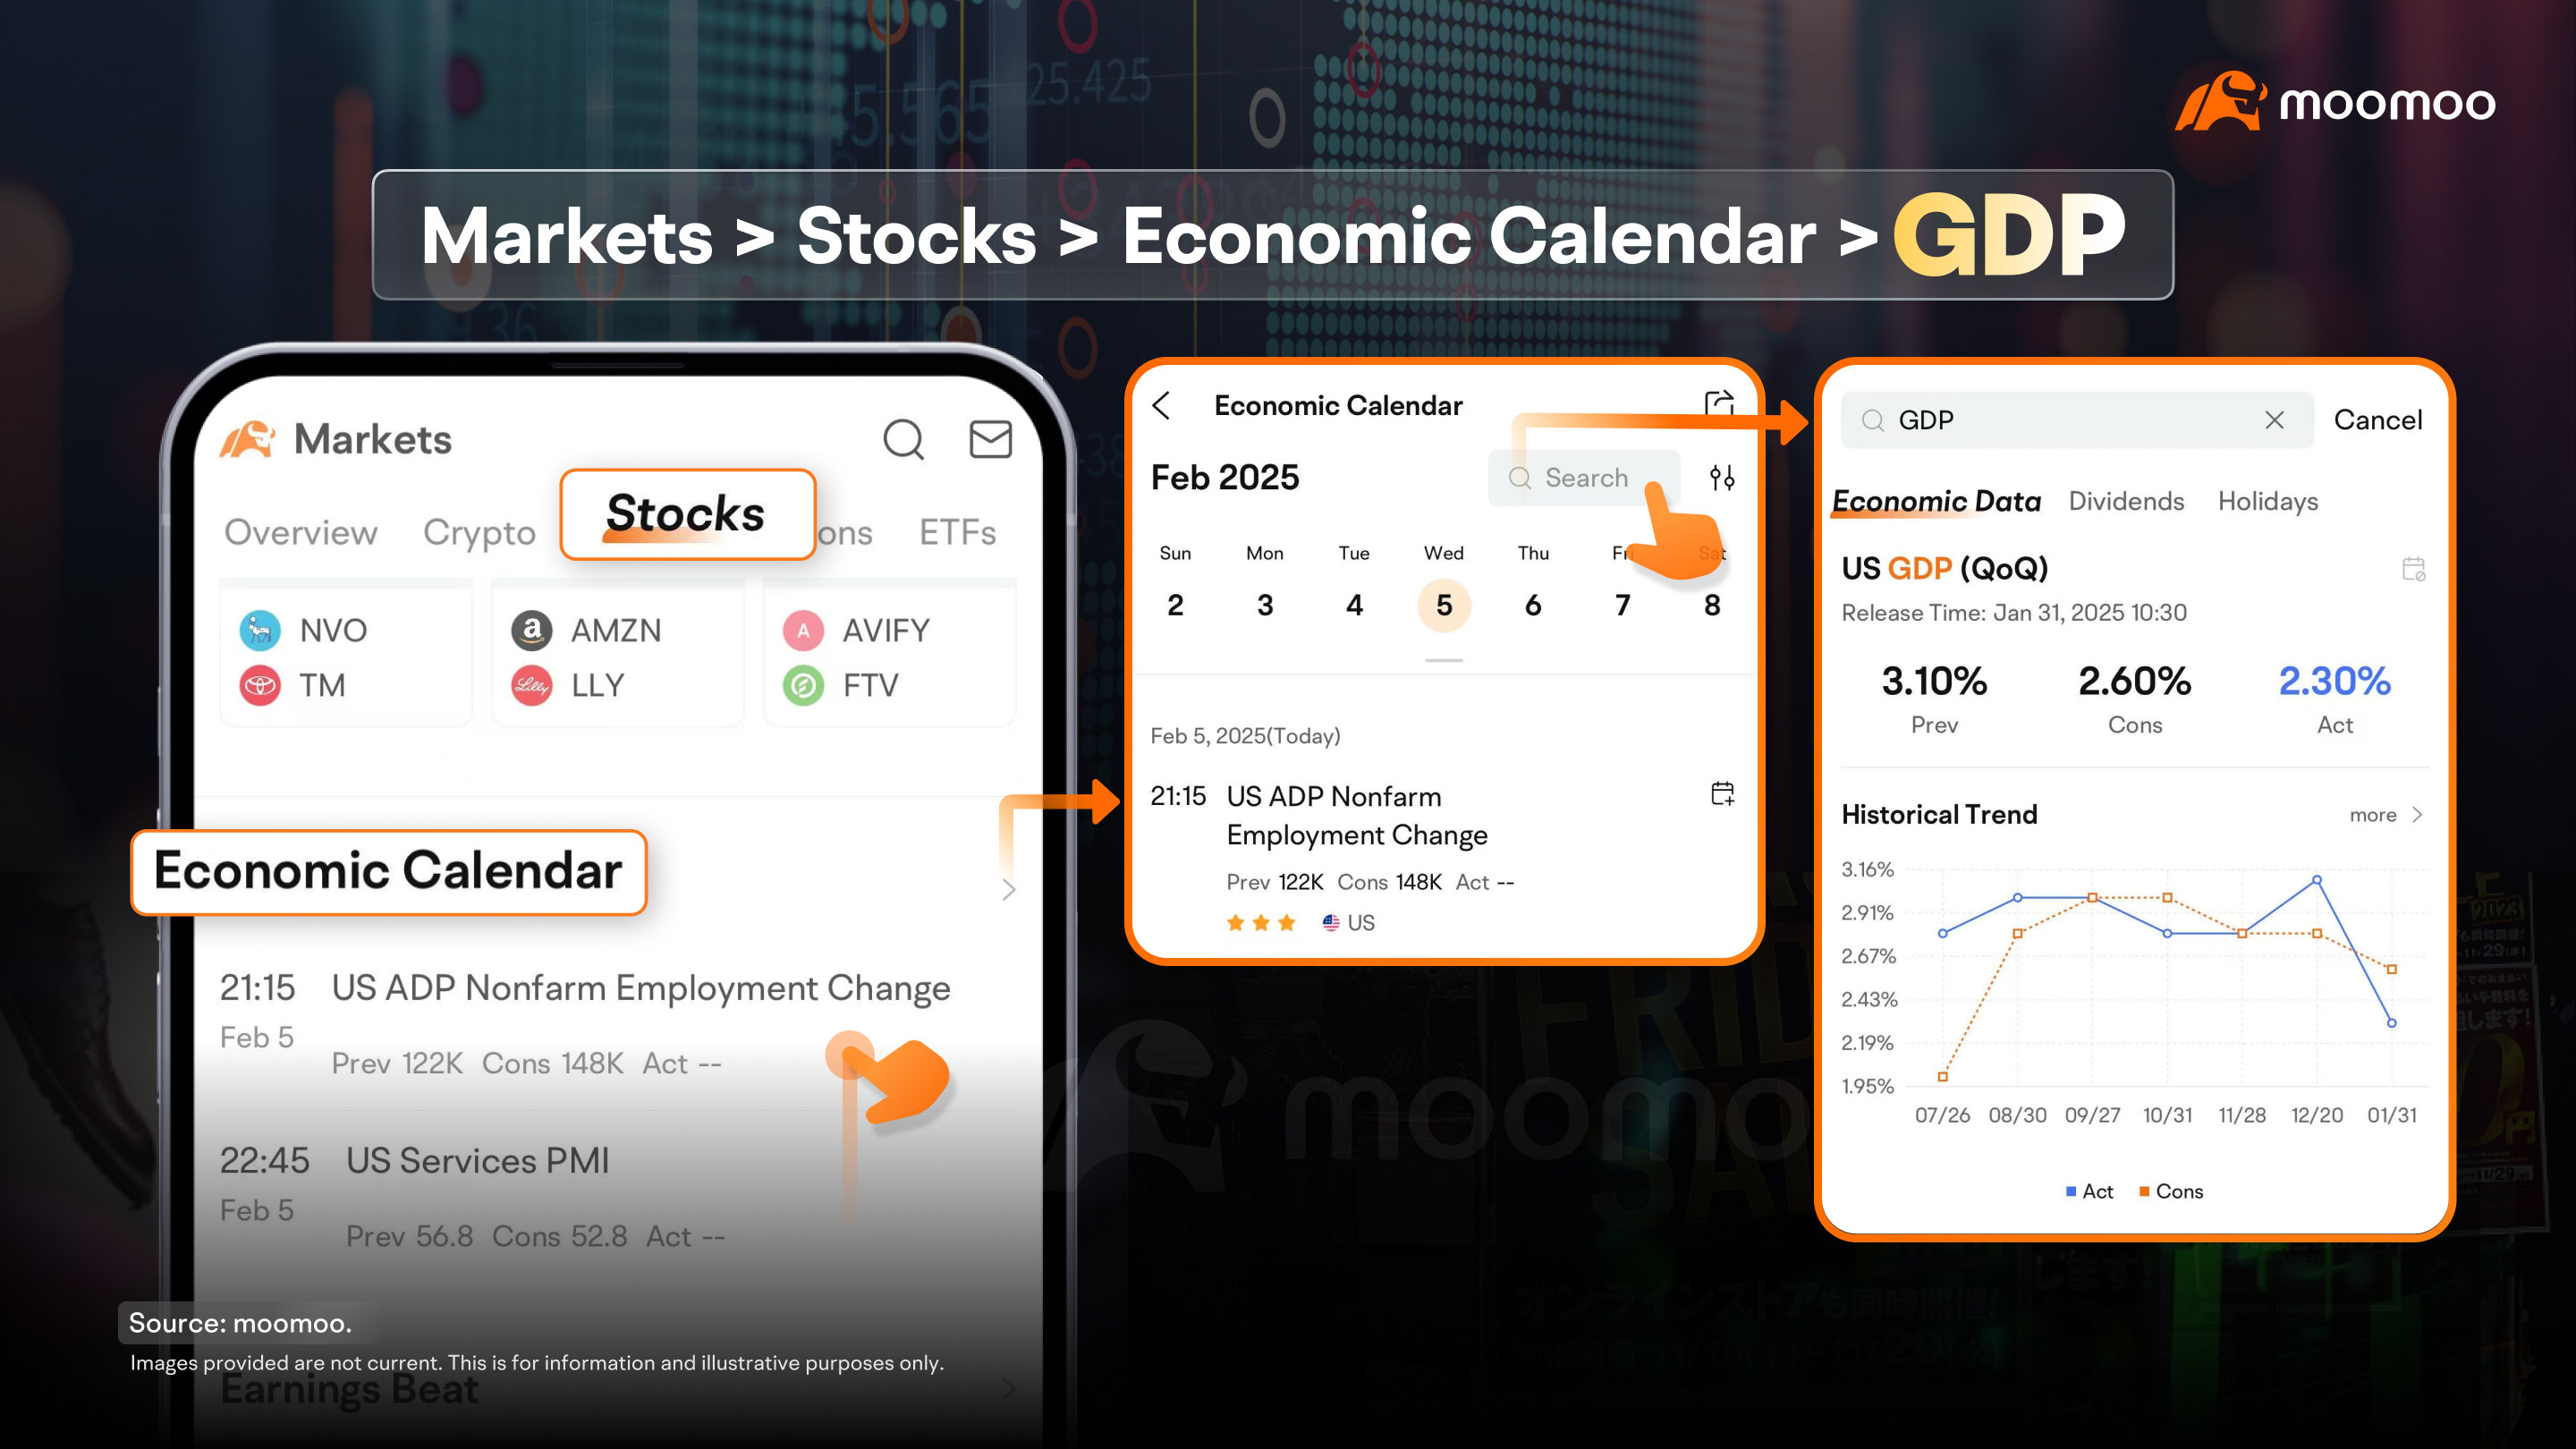
On moomoo, accessing GDP data is quick and easy. Simply go to the Markets section and swipe up to find the Economic Calendar. Type "GDP" into the search bar to locate the relevant information.
When you click on the data, you'll see the release date, historical trends, and past figures. If you’re worried about missing any release times, just click the calendar icon to subscribe. You’ll receive notifications as soon as the data is released.
In the United States, GDP data is typically calculated on a quarter-to-quarter (QoQ) basis, unlike many other countries that compare changes over a year (YoY). The U.S. looks at how much GDP has grown from one quarter to the next and then "annualizes" this number, assuming the same growth rate will continue for the next three quarters.
For example, if GDP grows by 1% compared to the previous quarter, the U.S. method assumes that the next three quarters will also grow by 1% each. This results in an annual growth rate of about 4.06% (1.01^4-1).
That's it for this macroeconomics lesson! If you found this session helpful, feel free to like, share, and leave your comments. Thank you, and see you next time!
This presentation is for informational and educational use only and is not a recommendation or endorsement of any particular investment or investment strategy. Investment information provided in this content is general in nature, strictly for illustrative purposes, and may not be appropriate for all investors. Read more