
Moomoo Insights
Jul 16 15:38
TSMC Earnings: AI Demand Is Stronger Than the Chip Selloff Suggests
Moomoo Insights
Sep 30 05:04
Live Take | Anthropic’s $518B Compute Bet: Who Wins From the AI Buildout?
A doji is the word for a trading session in which the open and close levels of securities are almost identical, as depicted by a candle on a chart. Technical analysts attempt to predict price behavior based on this shape. Doji candlesticks might resemble a cross, an inverted cross, or a plus sign.
Although uncommon, a doji candlestick often indicates a trend reversal to analysts, however, it can also indicate future price hesitation. Generally speaking, candlestick charts can reflect market patterns, market sentiment, momentum, and volatility. Candlestick charts show the patterns that result from market movements and reactions.
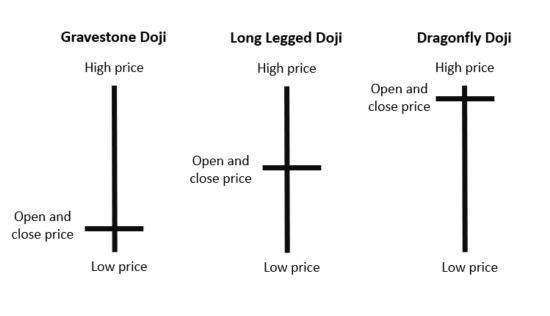
In Japanese, "doji" ((どうじ/ 同事) means "the same thing," referring to the rarity of a security's opening and closing prices being identical. Depending on where the open/close line lies, a doji can be described as a gravestone, long-legged, or dragonfly.
Technical analysts believe that the stock's price reflects all available information or that the price is efficient. However, previous price performance does not predict future price performance, and a stock's actual price may not reflect its real or intrinsic worth. In order to decrease the noise and identify the trades with the highest likelihood, technical analysts employ tools.
Every candlestick pattern is defined by four kinds of data. Analysts can draw inferences about price behavior based on this structure. Each candlestick has an open, high, low, and close. The time period or tick interval utilized is irrelevant. The body is the filled or hollow bar that is generated by the candlestick pattern. Shadows are the lines that emanate from the body. A stock that closes higher than it opened will have a hollow candlestick. The body will have a filled candlestick if the stock closes at a lower price. The doji is one of the most significant candlestick formations.
A doji, which can apply to both singular and plural variants, is formed when the open and close of a stock are almost identical. Doji typically has little or nonexistent bodies and resembles a cross or plus sign. From the perspective of auction theory, doji signifies indecision on the part of both buyers and sellers. All parties are equally matched, hence the price remains unchanged; buyers and sellers are in a stalemate.
Some experts take this as a hint of a price reversal. It may also be a moment when buyers or sellers acquire the impetus to continue a trend. Doji is frequently observed during consolidation periods and can assist analysts in identifying potential price breakouts.
A doji candlestick is one neutral indicator that may provide limited information when viewed alone. In addition, a doji is a rare occurrence; consequently, it is not a trustworthy indicator for detecting price reversals. When a reversal does occur, it is not always trustworthy. There is no promise that the price will continue in the expected direction after the confirmation candle.
Depending on the length of the doji's tail or wick and the size of the confirmation candle, the entry position for a trade may be far from the stop-loss location. This means that traders will need to locate another position for the stop-loss, or they may need to abandon the transaction because the possible benefit of the trade may not justify the stop-loss amount.
In addition, it can be difficult to estimate the potential profit of a doji-informed transaction because candlestick patterns often lack price goals. Therefore, traders must use other candlestick patterns, technical indicators, or strategies before making the final investment decision.
Moomoo stock trading app provides free advanced stock charting tools to help various investors to analyze trends and patterns with 60+ technical indicators and add visuals to charts using 38+ drawing tools. Sign up and download the moomoo app today to access these charting tools!
This presentation is for informational and educational use only and is not a recommendation or endorsement of any particular investment or investment strategy. Investment information provided in this content is general in nature, strictly for illustrative purposes, and may not be appropriate for all investors. Read more
Recommend
How to Read a Point and Figure Chart (P&F)

Moving Average Crossover: How to Use It in Trading
What Is the Ichimoku Cloud?

What Is a Pivot Point in Stock Market
What Is Technical Analysis of Stock Market?
The Basics of Technical vs Fundamental Analysis
10 Stock Chart Patterns for Beginner Traders
Top Trading Tools Traders Should Know
What Is the Parabolic SAR Indicator?
What Is the Price Channel Indicator
What Is the Average True Range (ATR)
What Is Volume of Trade?
What Is a Harami Cross?
What Is a Morning Star?
What Is Turnover?
What Is Keltner Channel?
What Is a Doji?
What Is the Directional Divergence Index?
What Is Three White Soldiers Candlestick Pattern?
What Is Three Inside Up and Three Inside Down?
What Is the Price Percentage Oscillator?
What Is a Bullish Harami?
What Are the Three Black Crows?
What Is an Evening Star?
What Is the Ichimoku Kinko Hyo?
What Is a Detrended Price Oscillator?
What Is the Rate of Change (ROC)?
What Is a Detrended Price Oscillator (DPO)?
What Is the Pattern of Inverted Hammer Candlesticks?
What Is Bullish and Bearish Breakaway Candlestick Pattern?
What Is a Three Outside Up and Down?
What Is a Bearish Harami?
What Is the Separating Lines Candlestick Pattern?
What Is a Shooting Star?
What Is a Bearish Engulfing Pattern?
What does Williams %R mean?
What Is a Bullish Engulfing Pattern?
What Is a Hammer Candlestick?
Triple Exponential Average (TRIX): What Does That Mean?
What Is Bias Ratio?
What Does the Directional Movement Index (DMI) Indicate?
What Is Bull Bear Ratio?
What Is Commodity Channel Index?
Everything About Stock Heatmaps That Investors Should Know
What Is a Psychological Line
How Stock Charting Tools Can Help Investors in the Stock Market
Using Moving Average Crossovers for Decision Making
How to Read Candlestick Charts
Triple Tops and Bottoms in Technical Analysis
3 Market indicators that reflect market volatility
How to Analyze Stock Market Trends: Technical Analysis vs. Fundamental Analysis
Optimize Your Stock Portfolio with Technical Analysis
How to Use the Free Stock Screener
What is the Exponential Moving Average (EMA): Usage and Limitations
What Is an Oscillator
What Is the Ease of Movement Indicator?
What Is Parabolic Stop and Reverse (SAR)
How to Identify Advanced Candlestick Patterns
Entry and Exit Strategies: Make Informed Decisions with Bollinger Bands®
Introduction to Level II Quotes
What Is a Volume Moving Average (VMA)
How to Read a Point and Figure Chart (P&F)
Moving Average Crossover: How to Use It in Trading
What Is the Ichimoku Cloud?
What Is a Pivot Point in Stock Market
What Is Technical Analysis of Stock Market?
The Basics of Technical vs Fundamental Analysis
10 Stock Chart Patterns for Beginner Traders
Top Trading Tools Traders Should Know
What Is the Parabolic SAR Indicator?
What Is the Price Channel Indicator
What Is the Average True Range (ATR)
What Is Volume of Trade?
What Is a Harami Cross?
What Is a Morning Star?
What Is Turnover?
What Is Keltner Channel?
What Is a Doji?
What Is the Directional Divergence Index?
What Is Three White Soldiers Candlestick Pattern?
What Is Three Inside Up and Three Inside Down?
What Is the Price Percentage Oscillator?
What Is a Bullish Harami?
What Are the Three Black Crows?
What Is an Evening Star?
What Is the Ichimoku Kinko Hyo?
What Is a Detrended Price Oscillator?
What Is the Rate of Change (ROC)?
What Is a Detrended Price Oscillator (DPO)?
What Is the Pattern of Inverted Hammer Candlesticks?
What Is Bullish and Bearish Breakaway Candlestick Pattern?
What Is a Three Outside Up and Down?
What Is a Bearish Harami?
What Is the Separating Lines Candlestick Pattern?
What Is a Shooting Star?
What Is a Bearish Engulfing Pattern?
What does Williams %R mean?
What Is a Bullish Engulfing Pattern?
What Is a Hammer Candlestick?
Triple Exponential Average (TRIX): What Does That Mean?
What Is Bias Ratio?
What Does the Directional Movement Index (DMI) Indicate?
What Is Bull Bear Ratio?
What Is Commodity Channel Index?
Everything About Stock Heatmaps That Investors Should Know
What Is a Psychological Line
How Stock Charting Tools Can Help Investors in the Stock Market
Using Moving Average Crossovers for Decision Making
How to Read Candlestick Charts
Triple Tops and Bottoms in Technical Analysis
3 Market indicators that reflect market volatility
How to Analyze Stock Market Trends: Technical Analysis vs. Fundamental Analysis
Optimize Your Stock Portfolio with Technical Analysis
How to Use the Free Stock Screener
What is the Exponential Moving Average (EMA): Usage and Limitations
What Is an Oscillator
What Is the Ease of Movement Indicator?
What Is Parabolic Stop and Reverse (SAR)
How to Identify Advanced Candlestick Patterns
Entry and Exit Strategies: Make Informed Decisions with Bollinger Bands®
Introduction to Level II Quotes
What Is a Volume Moving Average (VMA)

