
Moomoo Insights
Jul 16 15:38
TSMC Earnings: AI Demand Is Stronger Than the Chip Selloff Suggests
Moomoo Insights
Sep 30 05:04
Live Take | Anthropic’s $518B Compute Bet: Who Wins From the AI Buildout?
A charting tool for stocks is a software application that helps investors and traders visualize and analyze the performance of individual stocks. These tools typically allow users to display historical price data and other key metrics, such as volume and moving averages, in the form of charts and graphs. Some common features of stock charting tools include technical analysis indicators, customizable time frames, and the ability to compare multiple stocks on a single chart.
Professional traders typically use a variety of different chart types, depending on their trading style, the type of security they're trading, and their goals. Some of the most commonly used charts by professional traders include:
1. Candlestick charts: These charts display the price action of an asset over a set time period, using candlesticks to indicate the opening, closing, high, and low prices.
2. Line charts: Line charts are simple and straightforward, showing the closing price of an asset over a set time period.
3. Bar charts: Bar charts are similar to candlestick charts, but instead of showing the full price range for a given period, they only show the high and low prices.
4. Renko charts: Renko charts are similar to bar charts, but instead of using time intervals, they use price movement to determine when a new bar is formed.
5. Point and Figure charts: Point and Figure charts are a type of chart that is primarily used for identifying trend and support/resistance levels.
6. Heikin-Ashi charts: Heikin-Ashi charts are a type of candlestick chart that uses a unique calculation method to create a smoother representation of price action.
Professional traders will often use a combination of these chart types and apply technical analysis techniques, such as trend lines, moving averages, and oscillators, to help make informed trading decisions.
To use a stock charting tool to help analyze stock market trends, you can follow these steps:
Choose the stock or stocks you want to analyze: Enter the ticker symbols for the stocks you're interested in and select the time frame you want to analyze.
Choose the type of chart: Different chart types can display data in different ways, so choose the chart type that best fits your needs. For example, candlestick charts are popular for displaying price and volume data, while line charts are simple and straightforward.
Add technical indicators: Technical indicators, such as moving averages and relative strength index (RSI), can help you identify trends and potential entry and exit points. You can add these indicators to your chart by selecting them from the charting tool's menu.
Set up trend lines: Trend lines are lines drawn on the chart to show the direction of price movement. You can draw trend lines by connecting two or more price points on the chart and extending the line into the future.
Look for support and resistance levels: Support levels are price points where the stock has a tendency to stop falling, while resistance levels are price points where the stock has a tendency to stop rising. Identifying these levels can help you determine potential entry and exit points.
Watch for chart patterns: Common chart patterns, such as head and shoulders and flags, can provide clues about the stock's future price movement.
Keep track of news and events: It's important to keep track of news and events that could impact the stock's price, such as earnings releases, analyst upgrades and downgrades, and major market events.
Keep in mind that while chart analysis can be a valuable tool, it is just one aspect of stock market analysis and should be used in conjunction with other forms of analysis, such as fundamental analysis and market sentiment analysis, to make informed investment decisions.
Pros of using a stock charting tool for technical analysis include:
Visual representation of data: Stock charting tools provide a visual representation of price and volume data, making it easier to identify trends and potential entry and exit points.
Customizability: Stock charting tools offer a variety of customization options, such as different chart types, time frames, and technical indicators, allowing traders to tailor the tool to their specific needs and preferences.
Technical analysis tools: Many stock charting tools include technical analysis tools, such as trend lines, moving averages, and oscillators, that can help traders make informed decisions.
Access to historical data: Stock charting tools provide access to historical data, allowing traders to analyze past performance and make predictions about future price movements.
Cons of using a stock charting tool for technical analysis include:
Over-reliance on charts: While charts can be a valuable tool, relying solely on charts for stock market analysis can be misleading. Charts only provide a limited view of the market and should be used in conjunction with other forms of analysis, such as fundamental analysis and market sentiment analysis.
The risk of misinterpretation: The interpretation of chart patterns and technical indicators is subjective, and traders can misinterpret data, leading to poor investment decisions.
False signals: Technical analysis is not a perfect science, and traders can be misled by false signals generated by the charting tool.
Limited fundamental analysis: Stock charting tools are primarily designed for technical analysis, and may not provide the level of detail required for a comprehensive fundamental analysis.
In conclusion, stock charting tools can be a valuable asset for technical analysis with their visual representation of data, customization options, and technical analysis tools. However, traders must be aware of the potential limitations and use charting tools in conjunction with other forms of analysis for informed investment decisions.
Moomoo stock trading app provides investors with powerful stock charting tools to meet various investors' charting needs and help to make investing decisions. Moomoo stock charting tools consist of 38 types of charts, support for saving and synchronization of charts, and customized color patterns, etc. Sign up and download the moomoo app today to unlock these free charting tools!
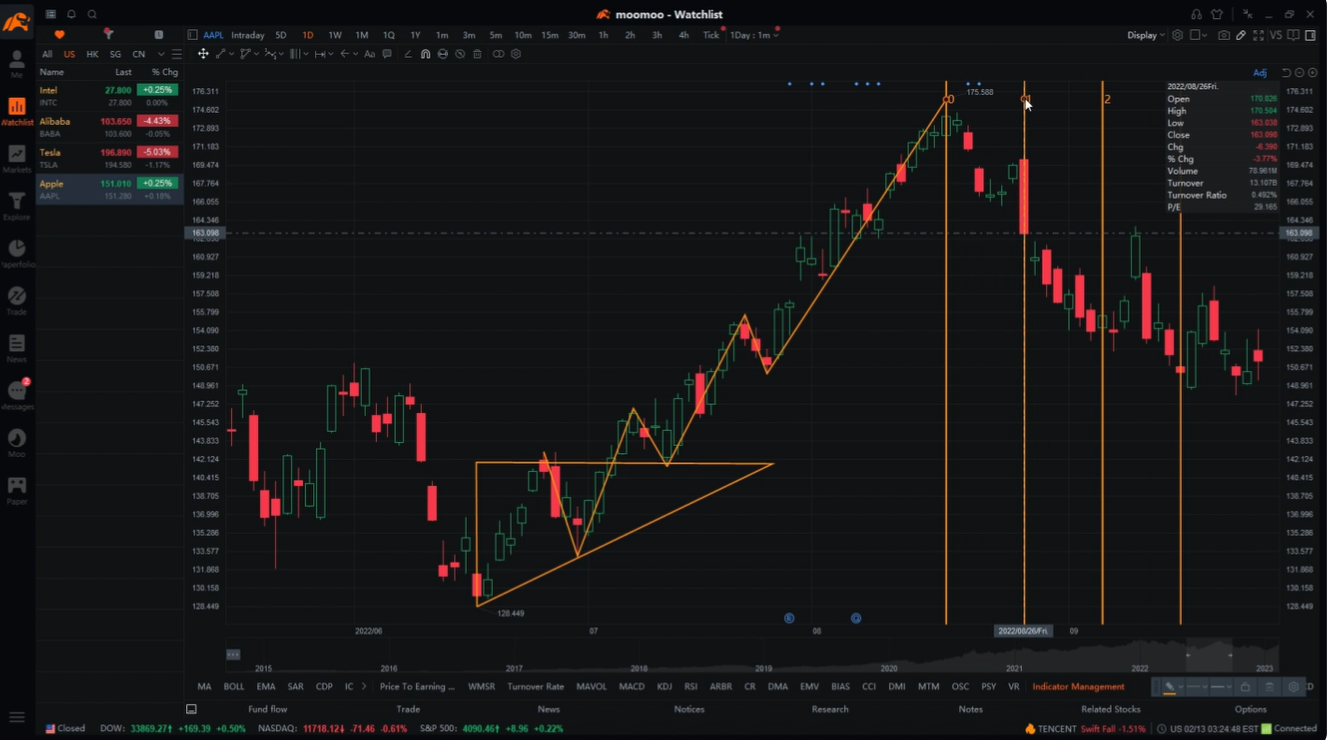
Images provided are not current and any securities are shown for illustrative purposes only.
This presentation is for informational and educational use only and is not a recommendation or endorsement of any particular investment or investment strategy. Investment information provided in this content is general in nature, strictly for illustrative purposes, and may not be appropriate for all investors. Read more
Recommend
How to Read a Point and Figure Chart (P&F)

Moving Average Crossover: How to Use It in Trading
What Is the Ichimoku Cloud?

What Is a Pivot Point in Stock Market
What Is Technical Analysis of Stock Market?
The Basics of Technical vs Fundamental Analysis
10 Stock Chart Patterns for Beginner Traders
Top Trading Tools Traders Should Know
What Is the Parabolic SAR Indicator?
What Is the Price Channel Indicator
What Is the Average True Range (ATR)
What Is Volume of Trade?
What Is a Harami Cross?
What Is a Morning Star?
What Is Turnover?
What Is Keltner Channel?
What Is a Doji?
What Is the Directional Divergence Index?
What Is Three White Soldiers Candlestick Pattern?
What Is Three Inside Up and Three Inside Down?
What Is the Price Percentage Oscillator?
What Is a Bullish Harami?
What Are the Three Black Crows?
What Is an Evening Star?
What Is the Ichimoku Kinko Hyo?
What Is a Detrended Price Oscillator?
What Is the Rate of Change (ROC)?
What Is a Detrended Price Oscillator (DPO)?
What Is the Pattern of Inverted Hammer Candlesticks?
What Is Bullish and Bearish Breakaway Candlestick Pattern?
What Is a Three Outside Up and Down?
What Is a Bearish Harami?
What Is the Separating Lines Candlestick Pattern?
What Is a Shooting Star?
What Is a Bearish Engulfing Pattern?
What does Williams %R mean?
What Is a Bullish Engulfing Pattern?
What Is a Hammer Candlestick?
Triple Exponential Average (TRIX): What Does That Mean?
What Is Bias Ratio?
What Does the Directional Movement Index (DMI) Indicate?
What Is Bull Bear Ratio?
What Is Commodity Channel Index?
Everything About Stock Heatmaps That Investors Should Know
What Is a Psychological Line
How Stock Charting Tools Can Help Investors in the Stock Market
Using Moving Average Crossovers for Decision Making
How to Read Candlestick Charts
Triple Tops and Bottoms in Technical Analysis
3 Market indicators that reflect market volatility
How to Analyze Stock Market Trends: Technical Analysis vs. Fundamental Analysis
Optimize Your Stock Portfolio with Technical Analysis
How to Use the Free Stock Screener
What is the Exponential Moving Average (EMA): Usage and Limitations
What Is an Oscillator
What Is the Ease of Movement Indicator?
What Is Parabolic Stop and Reverse (SAR)
How to Identify Advanced Candlestick Patterns
Entry and Exit Strategies: Make Informed Decisions with Bollinger Bands®
Introduction to Level II Quotes
What Is a Volume Moving Average (VMA)
How to Read a Point and Figure Chart (P&F)
Moving Average Crossover: How to Use It in Trading
What Is the Ichimoku Cloud?
What Is a Pivot Point in Stock Market
What Is Technical Analysis of Stock Market?
The Basics of Technical vs Fundamental Analysis
10 Stock Chart Patterns for Beginner Traders
Top Trading Tools Traders Should Know
What Is the Parabolic SAR Indicator?
What Is the Price Channel Indicator
What Is the Average True Range (ATR)
What Is Volume of Trade?
What Is a Harami Cross?
What Is a Morning Star?
What Is Turnover?
What Is Keltner Channel?
What Is a Doji?
What Is the Directional Divergence Index?
What Is Three White Soldiers Candlestick Pattern?
What Is Three Inside Up and Three Inside Down?
What Is the Price Percentage Oscillator?
What Is a Bullish Harami?
What Are the Three Black Crows?
What Is an Evening Star?
What Is the Ichimoku Kinko Hyo?
What Is a Detrended Price Oscillator?
What Is the Rate of Change (ROC)?
What Is a Detrended Price Oscillator (DPO)?
What Is the Pattern of Inverted Hammer Candlesticks?
What Is Bullish and Bearish Breakaway Candlestick Pattern?
What Is a Three Outside Up and Down?
What Is a Bearish Harami?
What Is the Separating Lines Candlestick Pattern?
What Is a Shooting Star?
What Is a Bearish Engulfing Pattern?
What does Williams %R mean?
What Is a Bullish Engulfing Pattern?
What Is a Hammer Candlestick?
Triple Exponential Average (TRIX): What Does That Mean?
What Is Bias Ratio?
What Does the Directional Movement Index (DMI) Indicate?
What Is Bull Bear Ratio?
What Is Commodity Channel Index?
Everything About Stock Heatmaps That Investors Should Know
What Is a Psychological Line
How Stock Charting Tools Can Help Investors in the Stock Market
Using Moving Average Crossovers for Decision Making
How to Read Candlestick Charts
Triple Tops and Bottoms in Technical Analysis
3 Market indicators that reflect market volatility
How to Analyze Stock Market Trends: Technical Analysis vs. Fundamental Analysis
Optimize Your Stock Portfolio with Technical Analysis
How to Use the Free Stock Screener
What is the Exponential Moving Average (EMA): Usage and Limitations
What Is an Oscillator
What Is the Ease of Movement Indicator?
What Is Parabolic Stop and Reverse (SAR)
How to Identify Advanced Candlestick Patterns
Entry and Exit Strategies: Make Informed Decisions with Bollinger Bands®
Introduction to Level II Quotes
What Is a Volume Moving Average (VMA)

