
Moomoo Insights
Jul 16 15:38
TSMC Earnings: AI Demand Is Stronger Than the Chip Selloff Suggests
Moomoo Insights
Sep 30 05:04
Live Take | Anthropic’s $518B Compute Bet: Who Wins From the AI Buildout?
In technical analysis, a detrended price oscillator is a tool that removes the influence of price trends to calculate an estimate of the duration of price cycles from peak to peak or trough to trough.
The divergence of prices over time is not a momentum indicator like some other oscillators, such as moving average convergence divergence (MACD). Instead, it draws attention to price highs and lows, which are then used to help identify buy and sell positions in a manner that is consistent with the historical cycle.
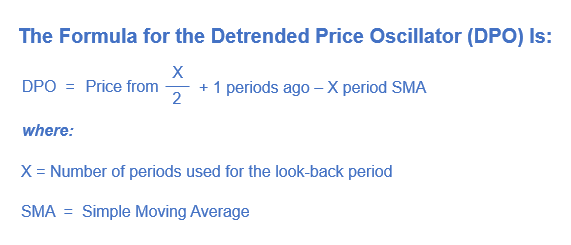
The aim of the detrended price oscillator is to assist traders in determining an asset's price cycle. This is accomplished by comparing a simple moving average (SMA) to a historical price close to the lookback period's center.
By looking at the indicator's historical highs and lows, peaks, and valleys. Traders often draw vertical lines at these junctures and count the time since the last line was removed. These lines will be lined with price peaks and valleys.
If each bottom occurs two months after the previous base, this helps determine when the next chance to purchase may present itself. This is accomplished by identifying the most recent low point in the indicator or price and then using that point as a reference point to predict the next low point two months into the future.
A trader might locate the high that occurred the most recently and then assume that the next peak would occur 1.5 months after that one if peaks tend to occur at intervals of 1.5 months. This anticipated high point and time provide an opportunity to be taken advantage of to sell a position before the price falls.
The distance between a peak and a trough may be used to estimate the length of a long trade, while the distance between a mountain and a track can be used to estimate the duration of a short transaction. Both of these measurements can help with the timing of trades.
The indicator is considered to be in a positive state when the price from x/2+1 periods ago is located above the SMA. When the price x/2 + 1 period ago is lower than the SMA, the indicator is said to be negative.
The detrended price oscillator does not completely update to reflect the most recent price. The DPO compares the price over the last x/2+1 periods to the SMA to determine its value. As a result, the maximum weight the indicator may reach is limited to x/2 + 1 period ago. Yet, this is not a problem since the purpose of the indicator is to draw attention to historical highs and lows.
Since the indicator fluctuates and is also shifted into the past, there needs to be a better real-time gauge for determining the direction of the trend. By its very nature, the indicator cannot be used for trend analysis. Because of this, it is up to the trader to decide which deals to participate in. During an upswing, the cycle bottoms will likely provide good chances for purchasing, and the cycle peaks will present substantial selling opportunities.
The DPO is not a stand-alone indicator that may be used to time trades; it is an extra tool that can be used in this capacity. It achieves this by analyzing the times in the past when the price reached its highest and lowest points. Although this information could serve as a point of reference or a baseline for future expectations, it is essential to note that. There is no assurance that the duration of the cycles that have occurred in the past will be repeated in the future. In the end, the length of cycles may either lengthen or shrink.
The trend is not taken into account by the indicator either. The trader is the one who is responsible for deciding which direction to trade in. Even if the price of an asset has reached its cycle low, it may not be worthwhile to purchase it if it is now in free fall since the price may continue to decline soon anyway.
Not all peaks and troughs on the DPO will simultaneously move to the same level. As a result, it is essential to keep an eye on the price to identify the significant highs and lows represented by the indicator. Sometimes the indicator will go down very little or up very far. But, a price reversal from such a level still has the potential to be substantially moving forward.
Moomoo stock trading app provides powerful stock charting tools to meet various investors' technical analysis needs and help to make investing decisions. Moomoo stock charting tools consist of 63+ technical indicators, 38 types of charts, support for saving and synchronization of charts, and customized color patterns, etc. Download the moomoo app today to get access to these free charting tools!
This presentation is for informational and educational use only and is not a recommendation or endorsement of any particular investment or investment strategy. Investment information provided in this content is general in nature, strictly for illustrative purposes, and may not be appropriate for all investors. Read more
Recommend
How to Read a Point and Figure Chart (P&F)

Moving Average Crossover: How to Use It in Trading
What Is the Ichimoku Cloud?

What Is a Pivot Point in Stock Market
What Is Technical Analysis of Stock Market?
The Basics of Technical vs Fundamental Analysis
10 Stock Chart Patterns for Beginner Traders
Top Trading Tools Traders Should Know
What Is the Parabolic SAR Indicator?
What Is the Price Channel Indicator
What Is the Average True Range (ATR)
What Is Volume of Trade?
What Is a Harami Cross?
What Is a Morning Star?
What Is Turnover?
What Is Keltner Channel?
What Is a Doji?
What Is the Directional Divergence Index?
What Is Three White Soldiers Candlestick Pattern?
What Is Three Inside Up and Three Inside Down?
What Is the Price Percentage Oscillator?
What Is a Bullish Harami?
What Are the Three Black Crows?
What Is an Evening Star?
What Is the Ichimoku Kinko Hyo?
What Is a Detrended Price Oscillator?
What Is the Rate of Change (ROC)?
What Is a Detrended Price Oscillator (DPO)?
What Is the Pattern of Inverted Hammer Candlesticks?
What Is Bullish and Bearish Breakaway Candlestick Pattern?
What Is a Three Outside Up and Down?
What Is a Bearish Harami?
What Is the Separating Lines Candlestick Pattern?
What Is a Shooting Star?
What Is a Bearish Engulfing Pattern?
What does Williams %R mean?
What Is a Bullish Engulfing Pattern?
What Is a Hammer Candlestick?
Triple Exponential Average (TRIX): What Does That Mean?
What Is Bias Ratio?
What Does the Directional Movement Index (DMI) Indicate?
What Is Bull Bear Ratio?
What Is Commodity Channel Index?
Everything About Stock Heatmaps That Investors Should Know
What Is a Psychological Line
How Stock Charting Tools Can Help Investors in the Stock Market
Using Moving Average Crossovers for Decision Making
How to Read Candlestick Charts
Triple Tops and Bottoms in Technical Analysis
3 Market indicators that reflect market volatility
How to Analyze Stock Market Trends: Technical Analysis vs. Fundamental Analysis
Optimize Your Stock Portfolio with Technical Analysis
How to Use the Free Stock Screener
What is the Exponential Moving Average (EMA): Usage and Limitations
What Is an Oscillator
What Is the Ease of Movement Indicator?
What Is Parabolic Stop and Reverse (SAR)
How to Identify Advanced Candlestick Patterns
Entry and Exit Strategies: Make Informed Decisions with Bollinger Bands®
Introduction to Level II Quotes
What Is a Volume Moving Average (VMA)
How to Read a Point and Figure Chart (P&F)
Moving Average Crossover: How to Use It in Trading
What Is the Ichimoku Cloud?
What Is a Pivot Point in Stock Market
What Is Technical Analysis of Stock Market?
The Basics of Technical vs Fundamental Analysis
10 Stock Chart Patterns for Beginner Traders
Top Trading Tools Traders Should Know
What Is the Parabolic SAR Indicator?
What Is the Price Channel Indicator
What Is the Average True Range (ATR)
What Is Volume of Trade?
What Is a Harami Cross?
What Is a Morning Star?
What Is Turnover?
What Is Keltner Channel?
What Is a Doji?
What Is the Directional Divergence Index?
What Is Three White Soldiers Candlestick Pattern?
What Is Three Inside Up and Three Inside Down?
What Is the Price Percentage Oscillator?
What Is a Bullish Harami?
What Are the Three Black Crows?
What Is an Evening Star?
What Is the Ichimoku Kinko Hyo?
What Is a Detrended Price Oscillator?
What Is the Rate of Change (ROC)?
What Is a Detrended Price Oscillator (DPO)?
What Is the Pattern of Inverted Hammer Candlesticks?
What Is Bullish and Bearish Breakaway Candlestick Pattern?
What Is a Three Outside Up and Down?
What Is a Bearish Harami?
What Is the Separating Lines Candlestick Pattern?
What Is a Shooting Star?
What Is a Bearish Engulfing Pattern?
What does Williams %R mean?
What Is a Bullish Engulfing Pattern?
What Is a Hammer Candlestick?
Triple Exponential Average (TRIX): What Does That Mean?
What Is Bias Ratio?
What Does the Directional Movement Index (DMI) Indicate?
What Is Bull Bear Ratio?
What Is Commodity Channel Index?
Everything About Stock Heatmaps That Investors Should Know
What Is a Psychological Line
How Stock Charting Tools Can Help Investors in the Stock Market
Using Moving Average Crossovers for Decision Making
How to Read Candlestick Charts
Triple Tops and Bottoms in Technical Analysis
3 Market indicators that reflect market volatility
How to Analyze Stock Market Trends: Technical Analysis vs. Fundamental Analysis
Optimize Your Stock Portfolio with Technical Analysis
How to Use the Free Stock Screener
What is the Exponential Moving Average (EMA): Usage and Limitations
What Is an Oscillator
What Is the Ease of Movement Indicator?
What Is Parabolic Stop and Reverse (SAR)
How to Identify Advanced Candlestick Patterns
Entry and Exit Strategies: Make Informed Decisions with Bollinger Bands®
Introduction to Level II Quotes
What Is a Volume Moving Average (VMA)

