
Moomoo Insights
Jul 16 15:38
TSMC Earnings: AI Demand Is Stronger Than the Chip Selloff Suggests
Moomoo Insights
Sep 30 05:04
Live Take | Anthropic’s $518B Compute Bet: Who Wins From the AI Buildout?
The Ease of Movement indicator, often known as EOM or EMV, was developed by Richard Arms. It is a technical analysis that aims to quantify a blend of momentum and volume information into a single number.
The purpose of using this number is to determine whether or not prices can go up or down with minimal opposition in the directional movement of the market.
If prices could fluctuate freely, they would continue to do so for an extended length of time, during which stocks could be potentially traded for a profit.
Richard W. Arms Jr. invented an oscillator called the Ease of Movement indicator, also called the Ease of Movement Value (EMV) indicator. This oscillator's purpose is to assist traders in determining the "ease" of price movement. When determining the intensity of a trend, many traders find it helpful since it considers both the price volatility and the volume.
The EMV indicator is comprised of several distinct formulas, one of which is a simple moving average:
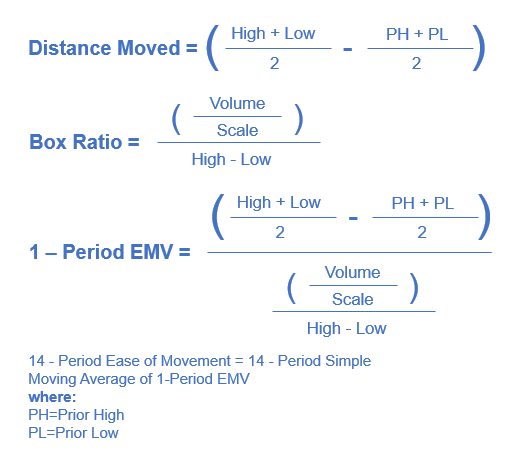
Depending on the typical daily trading volume of the stock, the scale represents anywhere from 1,000 to 1,000,000,000. If you want the indicator value to be in the single or double digits, you need to make the scale higher. The more actively traded the stock is, the larger the scale should be.
The price rises on the low trading volume when the indicator generates positive output values and rises above zero. Conversely, when the indicator generates output values that are falling negatively, the price falls on the low trading volume.
Some experts believe the EMV line may be improved by including a moving average and then using this new line as the trigger line for generating trading signals. Traders may also watch for divergences and convergences among the price and the ease of movement as an indication of potential forthcoming reversals in the market. As a consequence of the computations used to determine the EMV, a line that is very similar to a movement or rate-of-change indicator is produced. As a result, the EMV is comparable to a volume-weighted velocity line. Comparing the EMV to the momentum indicator might reveal relevant information regarding the relationship between volume and price.
EMV is often used in combination with many other kinds of technical analysis, including technical indicators & chart patterns, by the majority of traders in order to make better investment choices. Rather than relying solely on an indicator, a trader may potentially notice a bullish reversal chart pattern, notice the improvement of the Ease of Movement, and may consider buying the stock after it breaks out of a specific price point. This is because the trader does not want to be caught off guard by a sudden change in price.
Traders may initiate positions when there is a high degree of ease of movement since this may imply buying into a continuing rally or short selling into a selloff already underway. It is typically suggested that the ease of movement be combined with other instruments, as with most technical indications.
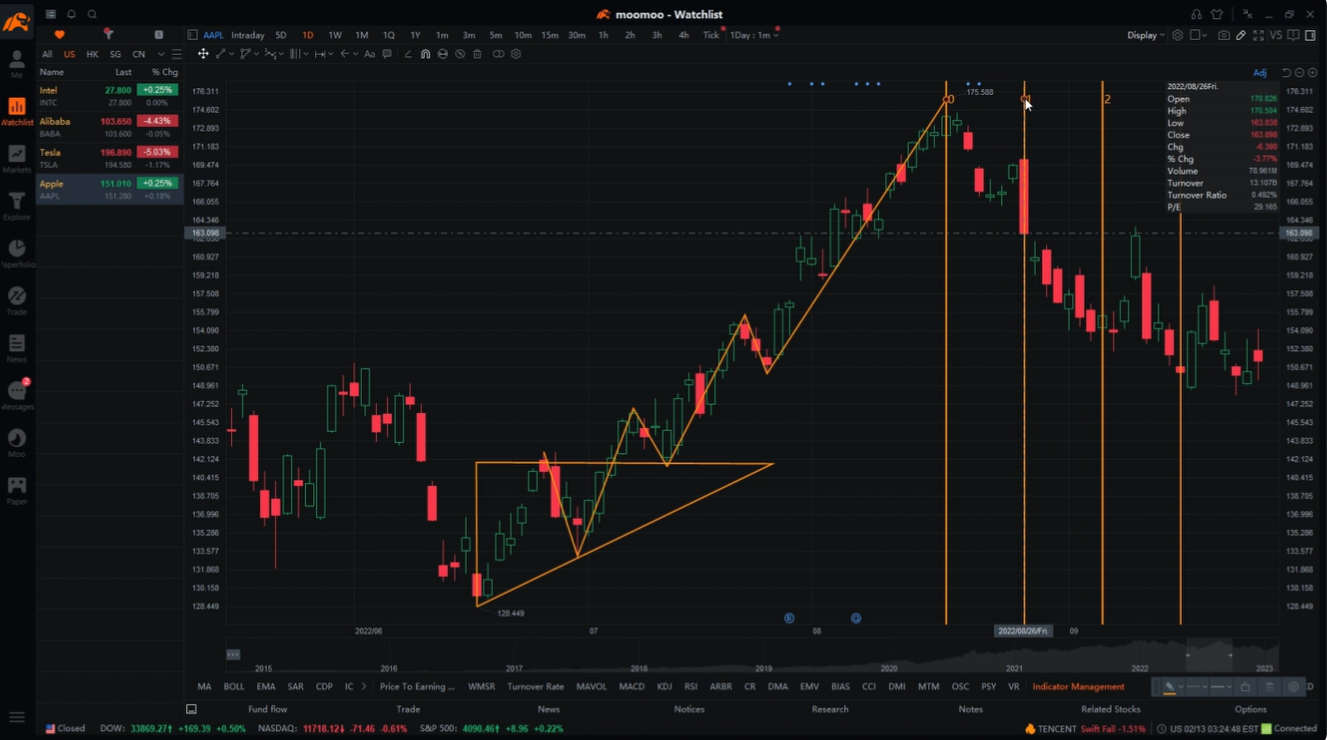
Moomoo stock trading app provides investors with powerful stock charting tools to meet various investors' charting needs and help to make investing decisions. Moomoo stock charting tools consist of 63+ technical indicators, 38 types of charts, support for saving and synchronization of charts, and customized color patterns, etc. Sign up and download the moomoo app today to unlock these free charting tools!
Images provided are not current and any securities are shown for illustrative purposes only.
*This article discusses technical analysis, other approaches, including fundamental analysis, may offer very different views. The examples provided are for illustrative purposes only and are not intended to be reflective of the results you can expect to achieve. Specific security charts used are for illustrative purposes only and are not a recommendation, offer to sell, or a solicitation of an offer to buy any security.
This presentation is for informational and educational use only and is not a recommendation or endorsement of any particular investment or investment strategy. Investment information provided in this content is general in nature, strictly for illustrative purposes, and may not be appropriate for all investors. Read more
Recommend
How to Read a Point and Figure Chart (P&F)

Moving Average Crossover: How to Use It in Trading
What Is the Ichimoku Cloud?

What Is a Pivot Point in Stock Market
What Is Technical Analysis of Stock Market?
The Basics of Technical vs Fundamental Analysis
10 Stock Chart Patterns for Beginner Traders
Top Trading Tools Traders Should Know
What Is the Parabolic SAR Indicator?
What Is the Price Channel Indicator
What Is the Average True Range (ATR)
What Is Volume of Trade?
What Is a Harami Cross?
What Is a Morning Star?
What Is Turnover?
What Is Keltner Channel?
What Is a Doji?
What Is the Directional Divergence Index?
What Is Three White Soldiers Candlestick Pattern?
What Is Three Inside Up and Three Inside Down?
What Is the Price Percentage Oscillator?
What Is a Bullish Harami?
What Are the Three Black Crows?
What Is an Evening Star?
What Is the Ichimoku Kinko Hyo?
What Is a Detrended Price Oscillator?
What Is the Rate of Change (ROC)?
What Is a Detrended Price Oscillator (DPO)?
What Is the Pattern of Inverted Hammer Candlesticks?
What Is Bullish and Bearish Breakaway Candlestick Pattern?
What Is a Three Outside Up and Down?
What Is a Bearish Harami?
What Is the Separating Lines Candlestick Pattern?
What Is a Shooting Star?
What Is a Bearish Engulfing Pattern?
What does Williams %R mean?
What Is a Bullish Engulfing Pattern?
What Is a Hammer Candlestick?
Triple Exponential Average (TRIX): What Does That Mean?
What Is Bias Ratio?
What Does the Directional Movement Index (DMI) Indicate?
What Is Bull Bear Ratio?
What Is Commodity Channel Index?
Everything About Stock Heatmaps That Investors Should Know
What Is a Psychological Line
How Stock Charting Tools Can Help Investors in the Stock Market
Using Moving Average Crossovers for Decision Making
How to Read Candlestick Charts
Triple Tops and Bottoms in Technical Analysis
3 Market indicators that reflect market volatility
How to Analyze Stock Market Trends: Technical Analysis vs. Fundamental Analysis
Optimize Your Stock Portfolio with Technical Analysis
How to Use the Free Stock Screener
What is the Exponential Moving Average (EMA): Usage and Limitations
What Is an Oscillator
What Is the Ease of Movement Indicator?
What Is Parabolic Stop and Reverse (SAR)
How to Identify Advanced Candlestick Patterns
Entry and Exit Strategies: Make Informed Decisions with Bollinger Bands®
Introduction to Level II Quotes
What Is a Volume Moving Average (VMA)
How to Read a Point and Figure Chart (P&F)
Moving Average Crossover: How to Use It in Trading
What Is the Ichimoku Cloud?
What Is a Pivot Point in Stock Market
What Is Technical Analysis of Stock Market?
The Basics of Technical vs Fundamental Analysis
10 Stock Chart Patterns for Beginner Traders
Top Trading Tools Traders Should Know
What Is the Parabolic SAR Indicator?
What Is the Price Channel Indicator
What Is the Average True Range (ATR)
What Is Volume of Trade?
What Is a Harami Cross?
What Is a Morning Star?
What Is Turnover?
What Is Keltner Channel?
What Is a Doji?
What Is the Directional Divergence Index?
What Is Three White Soldiers Candlestick Pattern?
What Is Three Inside Up and Three Inside Down?
What Is the Price Percentage Oscillator?
What Is a Bullish Harami?
What Are the Three Black Crows?
What Is an Evening Star?
What Is the Ichimoku Kinko Hyo?
What Is a Detrended Price Oscillator?
What Is the Rate of Change (ROC)?
What Is a Detrended Price Oscillator (DPO)?
What Is the Pattern of Inverted Hammer Candlesticks?
What Is Bullish and Bearish Breakaway Candlestick Pattern?
What Is a Three Outside Up and Down?
What Is a Bearish Harami?
What Is the Separating Lines Candlestick Pattern?
What Is a Shooting Star?
What Is a Bearish Engulfing Pattern?
What does Williams %R mean?
What Is a Bullish Engulfing Pattern?
What Is a Hammer Candlestick?
Triple Exponential Average (TRIX): What Does That Mean?
What Is Bias Ratio?
What Does the Directional Movement Index (DMI) Indicate?
What Is Bull Bear Ratio?
What Is Commodity Channel Index?
Everything About Stock Heatmaps That Investors Should Know
What Is a Psychological Line
How Stock Charting Tools Can Help Investors in the Stock Market
Using Moving Average Crossovers for Decision Making
How to Read Candlestick Charts
Triple Tops and Bottoms in Technical Analysis
3 Market indicators that reflect market volatility
How to Analyze Stock Market Trends: Technical Analysis vs. Fundamental Analysis
Optimize Your Stock Portfolio with Technical Analysis
How to Use the Free Stock Screener
What is the Exponential Moving Average (EMA): Usage and Limitations
What Is an Oscillator
What Is the Ease of Movement Indicator?
What Is Parabolic Stop and Reverse (SAR)
How to Identify Advanced Candlestick Patterns
Entry and Exit Strategies: Make Informed Decisions with Bollinger Bands®
Introduction to Level II Quotes
What Is a Volume Moving Average (VMA)

