
Moomoo Insights
Jul 16 15:38
TSMC Earnings: AI Demand Is Stronger Than the Chip Selloff Suggests
Moomoo Insights
Sep 30 05:04
Live Take | Anthropic’s $518B Compute Bet: Who Wins From the AI Buildout?
Williams %R, sometimes called the Williams Percent Range, is a form of momentum indicator that ranges from 0 to -100 and gauges overbought and oversold levels. Finding entry and exit opportunities in the market is possible with the help of the Williams %R indicator. The indicator may be used in a manner that is analogous to that of the stochastic oscillator because of its striking similarities. Larry Williams was the one who came up with the idea, and it evaluates the current price of a stock concerning its high and low prices during a predetermined time, which is often 14 days or longer.
The Formula for the Williams %R Is:
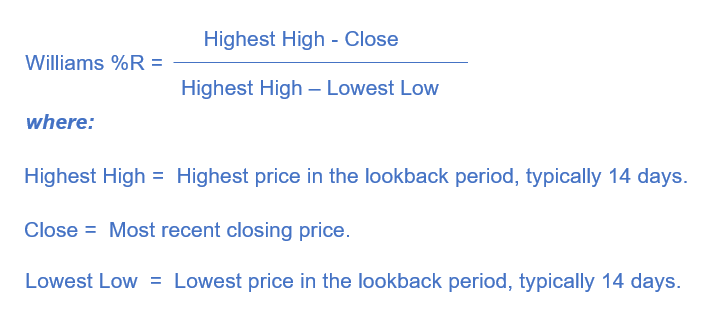
Price information determines the Williams %R, often looking back over the previous 14 periods.
Note the top and low scores for each of the 14 time periods.
Take note of the current price and the highest and lowest prices throughout the 14th session. Completing all of the Williams %R formula variables should be easy.
Take note of the current price, as well as the highest and lowest price, but only for the previous 14 periods, for the 15th period (not the last 15). Determine the new value for Williams %R.
Calculate the new Williams %R once each period has ended, but only use the most recent 14 periods of data.
The indicator gives a trader information about where the current price is compared to the maximum high seen in the previous 14 periods (or the number of look-back periods chosen).
When the indicator is between -20 and zero, which indicates that the price is approaching the peak of its previous price range, it is said to be overbought. When the indicator is between -80 and -100, the price is considered oversold or much lower than the high point of its most recent range.
Even if the indicator shows that conditions are "overbought" or "oversold," this is not guaranteed that a trend will reverse. A strong upswing should routinely see prices pushing to or beyond historical highs, and overbought readings validate an uptrend since this happens more frequently during a substantial advance (what the indicator is calculating).
The indicator may be too sensitive, which means that it may produce an excessive amount of misleading signals. For instance, the indicator may be in the oversold region and begin to climb upward, but the price may not follow suit and continue down. This is because the indicator only considers data from the last 14 periods. Even if the price has not changed much, the relative position of the current price concerning the highs and lows seen in the look-back period will shift with time.
Moomoo stock trading app provides powerful stock charting tools to meet various investors' technical analysis needs and help to make investing decisions. Moomoo stock charting tools consist of 63+ technical indicators, 38 types of charts, support for saving and synchronization of charts, and customized color patterns, etc. Sign up and download the moomoo app today to get access to these free charting tools!
This presentation is for informational and educational use only and is not a recommendation or endorsement of any particular investment or investment strategy. Investment information provided in this content is general in nature, strictly for illustrative purposes, and may not be appropriate for all investors. Read more
Recommend
How to Read a Point and Figure Chart (P&F)
Moving Average Crossover: How to Use It in Trading
What Is the Ichimoku Cloud?

What Is a Pivot Point in Stock Market
What Is Technical Analysis of Stock Market?
The Basics of Technical vs Fundamental Analysis
10 Stock Chart Patterns for Beginner Traders
Top Trading Tools Traders Should Know
What Is the Parabolic SAR Indicator?
What Is the Price Channel Indicator
What Is the Average True Range (ATR)
What Is Volume of Trade?
What Is a Harami Cross?
What Is a Morning Star?
What Is Turnover?
What Is Keltner Channel?
What Is a Doji?
What Is the Directional Divergence Index?
What Is Three White Soldiers Candlestick Pattern?
What Is Three Inside Up and Three Inside Down?
What Is the Price Percentage Oscillator?
What Is a Bullish Harami?
What Are the Three Black Crows?
What Is an Evening Star?
What Is the Ichimoku Kinko Hyo?
What Is a Detrended Price Oscillator?
What Is the Rate of Change (ROC)?
What Is a Detrended Price Oscillator (DPO)?
What Is the Pattern of Inverted Hammer Candlesticks?
What Is Bullish and Bearish Breakaway Candlestick Pattern?
What Is a Three Outside Up and Down?
What Is a Bearish Harami?
What Is the Separating Lines Candlestick Pattern?
What Is a Shooting Star?
What Is a Bearish Engulfing Pattern?
What does Williams %R mean?
What Is a Bullish Engulfing Pattern?
What Is a Hammer Candlestick?
Triple Exponential Average (TRIX): What Does That Mean?
What Is Bias Ratio?
What Does the Directional Movement Index (DMI) Indicate?
What Is Bull Bear Ratio?
What Is Commodity Channel Index?
Everything About Stock Heatmaps That Investors Should Know
What Is a Psychological Line
How Stock Charting Tools Can Help Investors in the Stock Market
Using Moving Average Crossovers for Decision Making
How to Read Candlestick Charts
Triple Tops and Bottoms in Technical Analysis
3 Market indicators that reflect market volatility
How to Analyze Stock Market Trends: Technical Analysis vs. Fundamental Analysis
Optimize Your Stock Portfolio with Technical Analysis
How to Use the Free Stock Screener
What is the Exponential Moving Average (EMA): Usage and Limitations
What Is an Oscillator
What Is the Ease of Movement Indicator?
What Is Parabolic Stop and Reverse (SAR)
How to Identify Advanced Candlestick Patterns
Entry and Exit Strategies: Make Informed Decisions with Bollinger Bands®
Introduction to Level II Quotes
What Is a Volume Moving Average (VMA)
How to Read a Point and Figure Chart (P&F)
Moving Average Crossover: How to Use It in Trading
What Is the Ichimoku Cloud?
What Is a Pivot Point in Stock Market
What Is Technical Analysis of Stock Market?
The Basics of Technical vs Fundamental Analysis
10 Stock Chart Patterns for Beginner Traders
Top Trading Tools Traders Should Know
What Is the Parabolic SAR Indicator?
What Is the Price Channel Indicator
What Is the Average True Range (ATR)
What Is Volume of Trade?
What Is a Harami Cross?
What Is a Morning Star?
What Is Turnover?
What Is Keltner Channel?
What Is a Doji?
What Is the Directional Divergence Index?
What Is Three White Soldiers Candlestick Pattern?
What Is Three Inside Up and Three Inside Down?
What Is the Price Percentage Oscillator?
What Is a Bullish Harami?
What Are the Three Black Crows?
What Is an Evening Star?
What Is the Ichimoku Kinko Hyo?
What Is a Detrended Price Oscillator?
What Is the Rate of Change (ROC)?
What Is a Detrended Price Oscillator (DPO)?
What Is the Pattern of Inverted Hammer Candlesticks?
What Is Bullish and Bearish Breakaway Candlestick Pattern?
What Is a Three Outside Up and Down?
What Is a Bearish Harami?
What Is the Separating Lines Candlestick Pattern?
What Is a Shooting Star?
What Is a Bearish Engulfing Pattern?
What does Williams %R mean?
What Is a Bullish Engulfing Pattern?
What Is a Hammer Candlestick?
Triple Exponential Average (TRIX): What Does That Mean?
What Is Bias Ratio?
What Does the Directional Movement Index (DMI) Indicate?
What Is Bull Bear Ratio?
What Is Commodity Channel Index?
Everything About Stock Heatmaps That Investors Should Know
What Is a Psychological Line
How Stock Charting Tools Can Help Investors in the Stock Market
Using Moving Average Crossovers for Decision Making
How to Read Candlestick Charts
Triple Tops and Bottoms in Technical Analysis
3 Market indicators that reflect market volatility
How to Analyze Stock Market Trends: Technical Analysis vs. Fundamental Analysis
Optimize Your Stock Portfolio with Technical Analysis
How to Use the Free Stock Screener
What is the Exponential Moving Average (EMA): Usage and Limitations
What Is an Oscillator
What Is the Ease of Movement Indicator?
What Is Parabolic Stop and Reverse (SAR)
How to Identify Advanced Candlestick Patterns
Entry and Exit Strategies: Make Informed Decisions with Bollinger Bands®
Introduction to Level II Quotes
What Is a Volume Moving Average (VMA)

