Moomoo Insights
Jul 16 15:38
TSMC Earnings: AI Demand Is Stronger Than the Chip Selloff Suggests
Moomoo Insights
Sep 30 05:04
Live Take | Anthropic’s $518B Compute Bet: Who Wins From the AI Buildout?
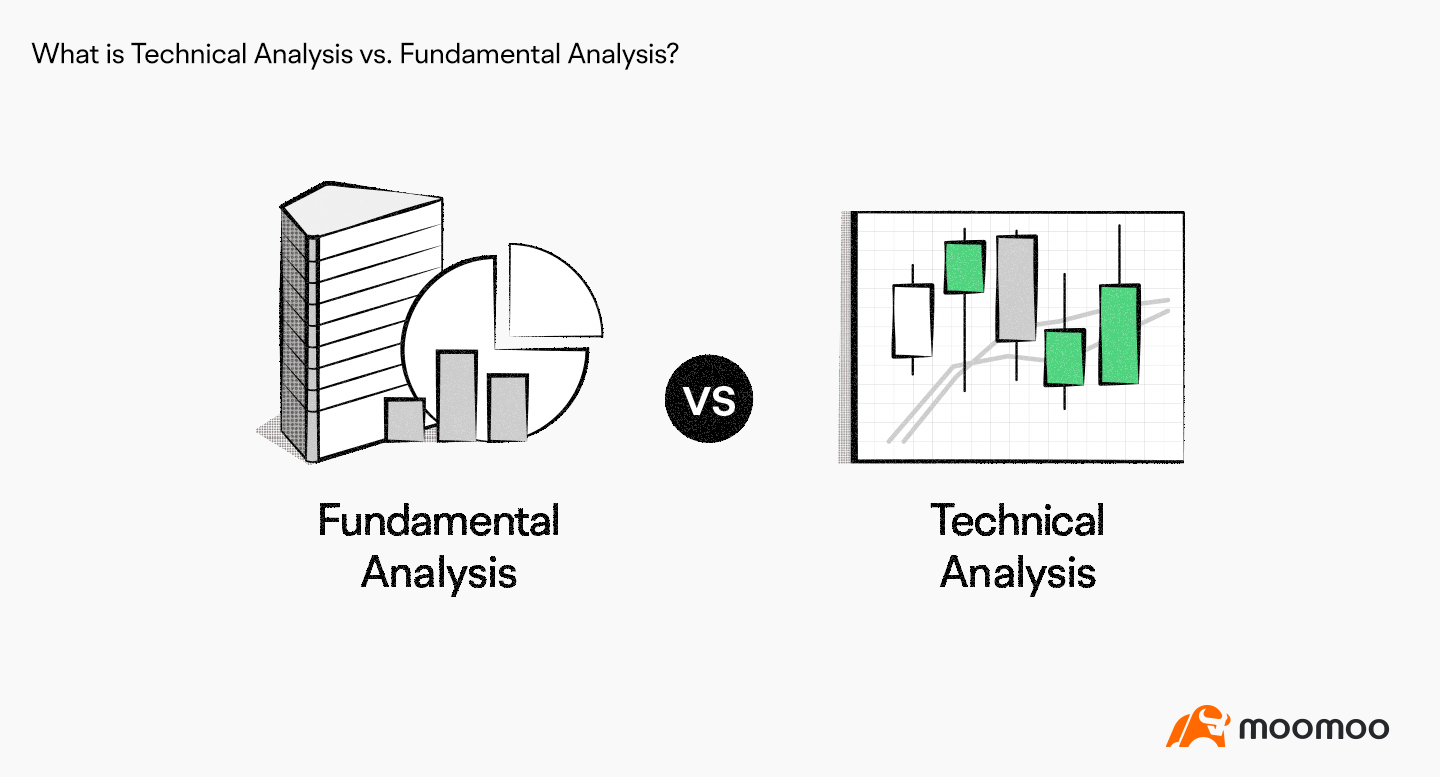
When evaluating the stock market, investors must consider technical analysis vs. fundamental analysis. Though these two methods represent the two main schools of thought regarding the stock market, they couldn’t be more different. Here’s how to choose the one that’s right for you.
Technical analysis relies on statistics to help predict how a stock might perform in the future. Thus, technical analysis focuses on a stock's past performance, referring to data such as price movements, volume and investor behavior.
While it sounds advanced, even beginner traders can perform technical analysis. Here are some key considerations:
Identify what stock/security to analyze
Determine the trend (upward, downward, constant)
Choose a strategy that matches the trend
Select a trading account and learn the tools and interface
Practice with “paper trades” that simulate real-world trades
Many online brokerage accounts can supply you with tools and resources to help you analyze data and trends. The more you get used to using these tools, the better equipped you’ll be to perform technical analysis.
Once you become more familiar with technical analysis, you’ll be able to match your
investing strategy to pricing trends.
Here’s an example of technical analysis in real life: imagine that you wish to buy stock in Company X. You notice Company X is experiencing an upward price trajectory. This trend leads you to believe the price will continue to rise.
Consequently, you might consider taking a long position, which will help you if the stock price increases.
Technical analysis can offer many potential advantages because it
Relies on direct data rather than knowledge of market mechanics
Can help suggest possible trends to inform your strategies
May provide possible clear entry and exit points for investors
Helps traders set clear criteria for stop-loss orders
These potential advantages make technical analysis popular for many for day traders since day trading requires investors to make quick decisions about which stocks to invest in and how to manage the positions.
Technical analysis does come with limitations.
Past prices aren’t always indicative of future results.
Some data can be open to interpretation. There can be conflicting and confusing signals.
Technical analysis ignores information used in fundamental analysis.
Stock prices might drop for stop-loss orders regardless of a clear price trend.
These limitations don’t negate the potential value of technical analysis. After all, no one can predict the future. Investors should exercise the usual precautions to manage risk when making stock purchases. Keep in mind, an investor shouldn’t buy or sell based solely on any indicator.
While technical analysis relies on statistical data, fundamental analysis relies on a
company’s intrinsic value to determine the viability of its stock.
This type of analysis requires a holistic view of the company that accounts for changes facing the U.S. economy, the industry, and the company itself. It calls for more specialized financial knowledge than price movement data-driven technical analysis.
Fundamental analysis requires a bit more research on the individual companies than technical analysis but can be easily accomplished by doing the following:
Study the company’s history
Evaluate the company’s revenue
Analyze the company’s earnings per share (EPS)
Look at the price/earnings (P/E) ratio
Check the company balance sheet
Research the company’s debt
Compare the company to its competitors
You might start by searching through the SEC’s EDGAR database to evaluate a company's history and performance. This practice also demonstrates a key difference between technical analysis vs. fundamental analysis: fundamental analysis looks at a broader section of financial data, while technical analysis focuses on price trends.
Here’s a quick example of fundamental analysis: let’s say you’re interested in buying stock in Company Y, but you’re not sure whether it’s a good long-range plan. You spend some time reading industry publications and looking at the company’s financial data to make an informed decision.
After completing your research, you learn that the company demonstrated strong resilience in the post-pandemic economy and that the industry as a whole is expected to flourish in the next decade. You conclude that Company Y appears like a sound investment and make your purchase accordingly.
Fundamental analysis can help you in several distinct ways. For example, it:
Can help identify long-term trends
Can help identify undervalued stocks
Develops your understanding of business/economics
Unlike technical analysis, which mostly relies on short-term data, fundamental analysis
can help you better understand a company’s long-term trajectory.
Fundamental analysis also has its limits, including:
It can be hard to stay objective.
Companies can “spin” their data to influence investors.
Industries can be influenced by untold numbers of factors.
There’s no clear winner when it comes to technical analysis vs. fundamental analysis; it just means investors need to understand the strengths and weaknesses of each method and manage risk accordingly.
These two methods aren’t mutually exclusive. Investors can potentially use both
fundamental and technical analysis to plan their trades.
For example, technical analysis might uncover an upward trend in a company’s price, while fundamental analysis reveals a strong company history and industry growth. When combined, these analytical methods can provide a comprehensive understanding of a company’s stock and help investors make informed buying and selling decisions.
Unlike gambling, which hinges on chance alone, stock market investing is based on careful, diligent research. Both fundamental and technical analysis allow you to make more informed decisions about your stock portfolio to help you become a wiser, more confident investor.
Which method is easier: fundamental analysis or technical analysis? While neither method is necessarily “easy,” technical analysis relies on a snapshot of statistical trends, which for some can be simpler than the industry and company research associated with fundamental analysis.
Is it imperative for traders to employ fundamental analysis? Not necessarily, though it can provide important data for long-term investments and may help better identify value stocks.
Does one type of analysis fare better in the stock market? There may not be a “best” approach, and investors might consider using both methods to obtain a holistic understanding of a stock’s value.
This presentation is for informational and educational use only and is not a recommendation or endorsement of any particular investment or investment strategy. Investment information provided in this content is general in nature, strictly for illustrative purposes, and may not be appropriate for all investors. Read more
Recommend
How to Read a Point and Figure Chart (P&F)

Moving Average Crossover: How to Use It in Trading
What Is the Ichimoku Cloud?

What Is a Pivot Point in Stock Market
What Is Technical Analysis of Stock Market?
The Basics of Technical vs Fundamental Analysis
10 Stock Chart Patterns for Beginner Traders
Top Trading Tools Traders Should Know
What Is the Parabolic SAR Indicator?
What Is the Price Channel Indicator
What Is the Average True Range (ATR)
What Is Volume of Trade?
What Is a Harami Cross?
What Is a Morning Star?
What Is Turnover?
What Is Keltner Channel?
What Is a Doji?
What Is the Directional Divergence Index?
What Is Three White Soldiers Candlestick Pattern?
What Is Three Inside Up and Three Inside Down?
What Is the Price Percentage Oscillator?
What Is a Bullish Harami?
What Are the Three Black Crows?
What Is an Evening Star?
What Is the Ichimoku Kinko Hyo?
What Is a Detrended Price Oscillator?
What Is the Rate of Change (ROC)?
What Is a Detrended Price Oscillator (DPO)?
What Is the Pattern of Inverted Hammer Candlesticks?
What Is Bullish and Bearish Breakaway Candlestick Pattern?
What Is a Three Outside Up and Down?
What Is a Bearish Harami?
What Is the Separating Lines Candlestick Pattern?
What Is a Shooting Star?
What Is a Bearish Engulfing Pattern?
What does Williams %R mean?
What Is a Bullish Engulfing Pattern?
What Is a Hammer Candlestick?
Triple Exponential Average (TRIX): What Does That Mean?
What Is Bias Ratio?
What Does the Directional Movement Index (DMI) Indicate?
What Is Bull Bear Ratio?
What Is Commodity Channel Index?
Everything About Stock Heatmaps That Investors Should Know
What Is a Psychological Line
How Stock Charting Tools Can Help Investors in the Stock Market
Using Moving Average Crossovers for Decision Making
How to Read Candlestick Charts
Triple Tops and Bottoms in Technical Analysis
3 Market indicators that reflect market volatility
How to Analyze Stock Market Trends: Technical Analysis vs. Fundamental Analysis
Optimize Your Stock Portfolio with Technical Analysis
How to Use the Free Stock Screener
What is the Exponential Moving Average (EMA): Usage and Limitations
What Is an Oscillator
What Is the Ease of Movement Indicator?
What Is Parabolic Stop and Reverse (SAR)
How to Identify Advanced Candlestick Patterns
Entry and Exit Strategies: Make Informed Decisions with Bollinger Bands®
Introduction to Level II Quotes
What Is a Volume Moving Average (VMA)
How to Read a Point and Figure Chart (P&F)
Moving Average Crossover: How to Use It in Trading
What Is the Ichimoku Cloud?
What Is a Pivot Point in Stock Market
What Is Technical Analysis of Stock Market?
The Basics of Technical vs Fundamental Analysis
10 Stock Chart Patterns for Beginner Traders
Top Trading Tools Traders Should Know
What Is the Parabolic SAR Indicator?
What Is the Price Channel Indicator
What Is the Average True Range (ATR)
What Is Volume of Trade?
What Is a Harami Cross?
What Is a Morning Star?
What Is Turnover?
What Is Keltner Channel?
What Is a Doji?
What Is the Directional Divergence Index?
What Is Three White Soldiers Candlestick Pattern?
What Is Three Inside Up and Three Inside Down?
What Is the Price Percentage Oscillator?
What Is a Bullish Harami?
What Are the Three Black Crows?
What Is an Evening Star?
What Is the Ichimoku Kinko Hyo?
What Is a Detrended Price Oscillator?
What Is the Rate of Change (ROC)?
What Is a Detrended Price Oscillator (DPO)?
What Is the Pattern of Inverted Hammer Candlesticks?
What Is Bullish and Bearish Breakaway Candlestick Pattern?
What Is a Three Outside Up and Down?
What Is a Bearish Harami?
What Is the Separating Lines Candlestick Pattern?
What Is a Shooting Star?
What Is a Bearish Engulfing Pattern?
What does Williams %R mean?
What Is a Bullish Engulfing Pattern?
What Is a Hammer Candlestick?
Triple Exponential Average (TRIX): What Does That Mean?
What Is Bias Ratio?
What Does the Directional Movement Index (DMI) Indicate?
What Is Bull Bear Ratio?
What Is Commodity Channel Index?
Everything About Stock Heatmaps That Investors Should Know
What Is a Psychological Line
How Stock Charting Tools Can Help Investors in the Stock Market
Using Moving Average Crossovers for Decision Making
How to Read Candlestick Charts
Triple Tops and Bottoms in Technical Analysis
3 Market indicators that reflect market volatility
How to Analyze Stock Market Trends: Technical Analysis vs. Fundamental Analysis
Optimize Your Stock Portfolio with Technical Analysis
How to Use the Free Stock Screener
What is the Exponential Moving Average (EMA): Usage and Limitations
What Is an Oscillator
What Is the Ease of Movement Indicator?
What Is Parabolic Stop and Reverse (SAR)
How to Identify Advanced Candlestick Patterns
Entry and Exit Strategies: Make Informed Decisions with Bollinger Bands®
Introduction to Level II Quotes
What Is a Volume Moving Average (VMA)