


Moomoo Insights
Jul 16 15:38
TSMC Earnings: AI Demand Is Stronger Than the Chip Selloff Suggests
Moomoo Insights
Sep 30 05:04
Live Take | Anthropic’s $518B Compute Bet: Who Wins From the AI Buildout?
Level II offers insights into bid scope and price levels. It can tell you detailed information about the 5-10 highest bids and lowest asks, including sizes, and much more.
Keep reading to find out how Level II works and how it can help you understand the stock's open interest.
Key Takeaways
Level II displays the stock order book along with the best bid.
Level II discloses the trader's identity, the price offered and the order size.
Traders who sell and buy stock, electronic communication networks (ECNs), and wholesalers who work directly with brokers are three main players in the stock market.
Level II is a trading service that offers real-time access to individual market makers registered in Nasdaq stocks. Orders are placed through different market makers and market participants.
Through level II, different participants can see the best bid for a particular stock. In this way, you can get a thorough understanding of price action. All this information could be quite helpful for you.
An example of a level II quote is as follows:
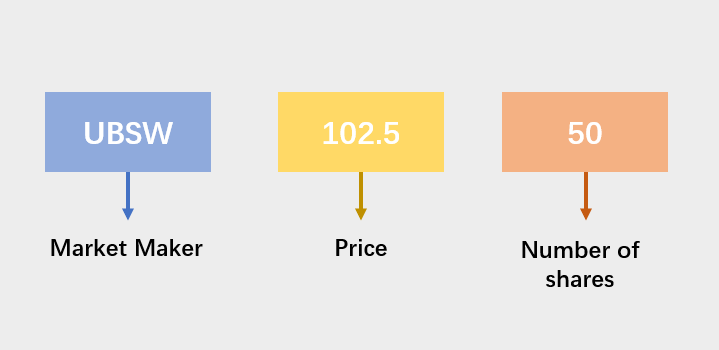
The diagram indicates that UBS securities want to buy 5,000 shares for 102.5. Notably, there are hundreds of claims (x100). Let's investigate the players in the market.
Three different players in the marketplace are:
market makers
Electronic communication networks
Wholesalers
Market makers provide liquidity in the stock market. They make the market and trade when no one is buying or selling.
Electronic communication networks refer to computerized order placement systems. Anybody, even large institutional traders, could trade through ECNs.
Wholesales buy order flow from online brokers. They then execute these orders for retail traders and online brokers.
A four-letter ID is assigned to each market participant. This ID number is also present on the level II quotes. The following table highlights the four-letter ID of some well-known market participants. [1]
Ax is one of the well-known market makers that control the stock's price. You can identify ax by carefully observing the level II action for a few days. The consistent leader of the market will be the ax.
Level II offers you insights into stock trading activity. For instance, you can
Examine the type of market participants to know the type of buying—institutional or retail.
Identify that institutional players are trying to conceal their buying by carefully examining the irregularities in the ECN order sizes.
Better understand a stock's price trend by analyzing the trades between the bid and ask.
moomoo trading app provides traders and investors with free real-time level 2 data. It will help users to understand real-time order placement and real-time pending orders, making order viewing and trading more efficient and aiding investing decisions. Sign up and download moomoo today to get the free real-time level II now!
Images provided are not current and any securities are shown for illustrative purposes only.
Indeed Level II offers you deep insights into the stock market. But it is also deceptive. Below are some most common tricks that market makers play:
Most market makers hide their order sizes. They do so by placing small orders and updating them as soon as they get filled. This trick helps them pick up large orders without scaring other traders.
Market makers also use their order size and timing to deceive other traders. For instance, JPMS may make a huge offer to trap short sellers from placing a large bid. This trick can convince new short sellers to cover.
Market makers also use ECNs to hide their actions. Since anyone could use ECN, you can't identify the type of ECN orders.
Indeed Level II offers you deep insights into the stock market. But it is also deceptive. So, if you're an average trader, you shouldn't rely on level II entirely. Instead, you can use it with other forms of analysis while trading a stock.
This presentation is for informational and educational use only and is not a recommendation or endorsement of any particular investment or investment strategy. Investment information provided in this content is general in nature, strictly for illustrative purposes, and may not be appropriate for all investors. Read more
Recommend
How to Read a Point and Figure Chart (P&F)
Moving Average Crossover: How to Use It in Trading
What Is the Ichimoku Cloud?

What Is a Pivot Point in Stock Market
What Is Technical Analysis of Stock Market?
The Basics of Technical vs Fundamental Analysis
10 Stock Chart Patterns for Beginner Traders
Top Trading Tools Traders Should Know
What Is the Parabolic SAR Indicator?
What Is the Price Channel Indicator
What Is the Average True Range (ATR)
What Is Volume of Trade?
What Is a Harami Cross?
What Is a Morning Star?
What Is Turnover?
What Is Keltner Channel?
What Is a Doji?
What Is the Directional Divergence Index?
What Is Three White Soldiers Candlestick Pattern?
What Is Three Inside Up and Three Inside Down?
What Is the Price Percentage Oscillator?
What Is a Bullish Harami?
What Are the Three Black Crows?
What Is an Evening Star?
What Is the Ichimoku Kinko Hyo?
What Is a Detrended Price Oscillator?
What Is the Rate of Change (ROC)?
What Is a Detrended Price Oscillator (DPO)?
What Is the Pattern of Inverted Hammer Candlesticks?
What Is Bullish and Bearish Breakaway Candlestick Pattern?
What Is a Three Outside Up and Down?
What Is a Bearish Harami?
What Is the Separating Lines Candlestick Pattern?
What Is a Shooting Star?
What Is a Bearish Engulfing Pattern?
What does Williams %R mean?
What Is a Bullish Engulfing Pattern?
What Is a Hammer Candlestick?
Triple Exponential Average (TRIX): What Does That Mean?
What Is Bias Ratio?
What Does the Directional Movement Index (DMI) Indicate?
What Is Bull Bear Ratio?
What Is Commodity Channel Index?
Everything About Stock Heatmaps That Investors Should Know
What Is a Psychological Line
How Stock Charting Tools Can Help Investors in the Stock Market
Using Moving Average Crossovers for Decision Making
How to Read Candlestick Charts
Triple Tops and Bottoms in Technical Analysis
3 Market indicators that reflect market volatility
How to Analyze Stock Market Trends: Technical Analysis vs. Fundamental Analysis
Optimize Your Stock Portfolio with Technical Analysis
How to Use the Free Stock Screener
What is the Exponential Moving Average (EMA): Usage and Limitations
What Is an Oscillator
What Is the Ease of Movement Indicator?
What Is Parabolic Stop and Reverse (SAR)
How to Identify Advanced Candlestick Patterns
Entry and Exit Strategies: Make Informed Decisions with Bollinger Bands®
Introduction to Level II Quotes
What Is a Volume Moving Average (VMA)
How to Read a Point and Figure Chart (P&F)
Moving Average Crossover: How to Use It in Trading
What Is the Ichimoku Cloud?
What Is a Pivot Point in Stock Market
What Is Technical Analysis of Stock Market?
The Basics of Technical vs Fundamental Analysis
10 Stock Chart Patterns for Beginner Traders
Top Trading Tools Traders Should Know
What Is the Parabolic SAR Indicator?
What Is the Price Channel Indicator
What Is the Average True Range (ATR)
What Is Volume of Trade?
What Is a Harami Cross?
What Is a Morning Star?
What Is Turnover?
What Is Keltner Channel?
What Is a Doji?
What Is the Directional Divergence Index?
What Is Three White Soldiers Candlestick Pattern?
What Is Three Inside Up and Three Inside Down?
What Is the Price Percentage Oscillator?
What Is a Bullish Harami?
What Are the Three Black Crows?
What Is an Evening Star?
What Is the Ichimoku Kinko Hyo?
What Is a Detrended Price Oscillator?
What Is the Rate of Change (ROC)?
What Is a Detrended Price Oscillator (DPO)?
What Is the Pattern of Inverted Hammer Candlesticks?
What Is Bullish and Bearish Breakaway Candlestick Pattern?
What Is a Three Outside Up and Down?
What Is a Bearish Harami?
What Is the Separating Lines Candlestick Pattern?
What Is a Shooting Star?
What Is a Bearish Engulfing Pattern?
What does Williams %R mean?
What Is a Bullish Engulfing Pattern?
What Is a Hammer Candlestick?
Triple Exponential Average (TRIX): What Does That Mean?
What Is Bias Ratio?
What Does the Directional Movement Index (DMI) Indicate?
What Is Bull Bear Ratio?
What Is Commodity Channel Index?
Everything About Stock Heatmaps That Investors Should Know
What Is a Psychological Line
How Stock Charting Tools Can Help Investors in the Stock Market
Using Moving Average Crossovers for Decision Making
How to Read Candlestick Charts
Triple Tops and Bottoms in Technical Analysis
3 Market indicators that reflect market volatility
How to Analyze Stock Market Trends: Technical Analysis vs. Fundamental Analysis
Optimize Your Stock Portfolio with Technical Analysis
How to Use the Free Stock Screener
What is the Exponential Moving Average (EMA): Usage and Limitations
What Is an Oscillator
What Is the Ease of Movement Indicator?
What Is Parabolic Stop and Reverse (SAR)
How to Identify Advanced Candlestick Patterns
Entry and Exit Strategies: Make Informed Decisions with Bollinger Bands®
Introduction to Level II Quotes
What Is a Volume Moving Average (VMA)

