Using trend lines to help trading
01 Three directions of trend
The concept of a trend is perhaps one of the most important aspects of technical analysis. Many tools used by technical traders, such as price patterns, support and resistance, and moving averages, focus on the purpose of helping identify market trends.
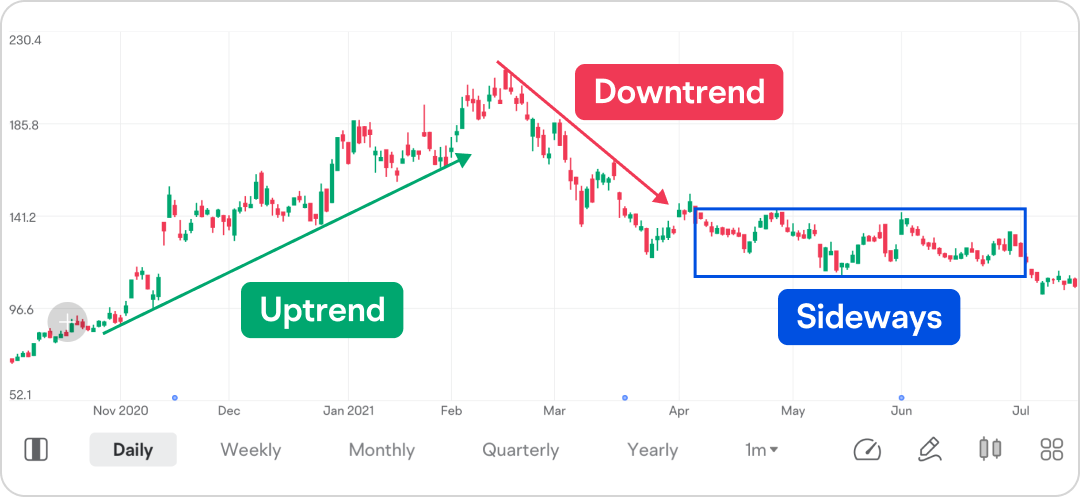
A trend is an overall direction in which the market or asset price moves. It consists of three types:
An uptrend is when the price makes higher swing highs and higher swing lows.
A downtrend is when the price makes lower swing lows and lower swing highs.
A sideways market, which is often referred to as being “trendless”, is price movement within a limited range.
Traders often use trend lines to better understand market directions. However, there are common mistakes that might lead to poor results.
02 How to draw a trend line
An Uptrend line is drawn below the price action, connecting two swing lows with the second low higher than the first and acting as potential support.
A downtrend line is drawn above the price action, connecting two swing highs with the second high lower than the first and acting as a potential resistance.
However, a trend line drawn in these ways is considered tentative. To make a trend line valid, the rule of thumb is that it must have at least three touch points.
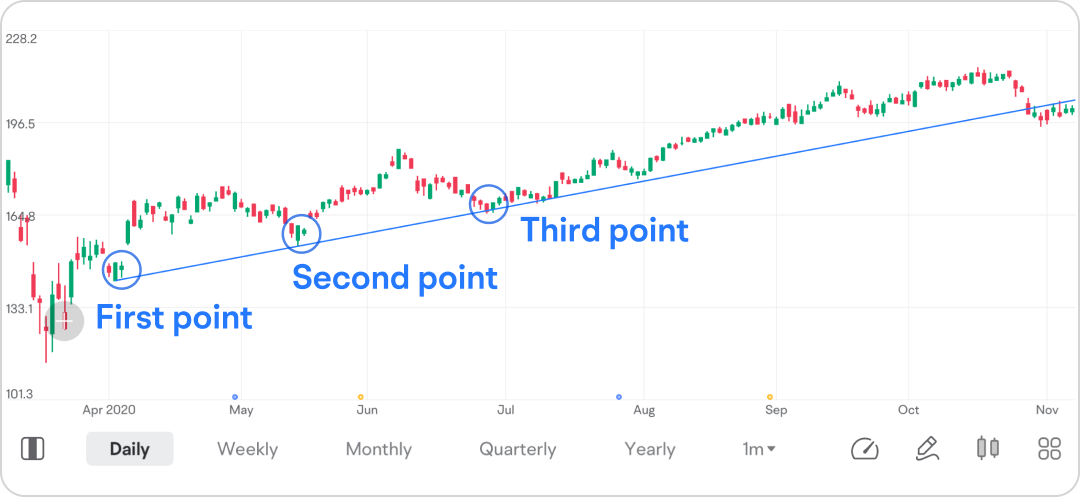
Generally speaking, the more touch points a trend line has, the more significant it is considered to be.
The slope of a trend line indicates the strength of the trend. If a steep trend line is broken, a slower trend line might have to be drawn.
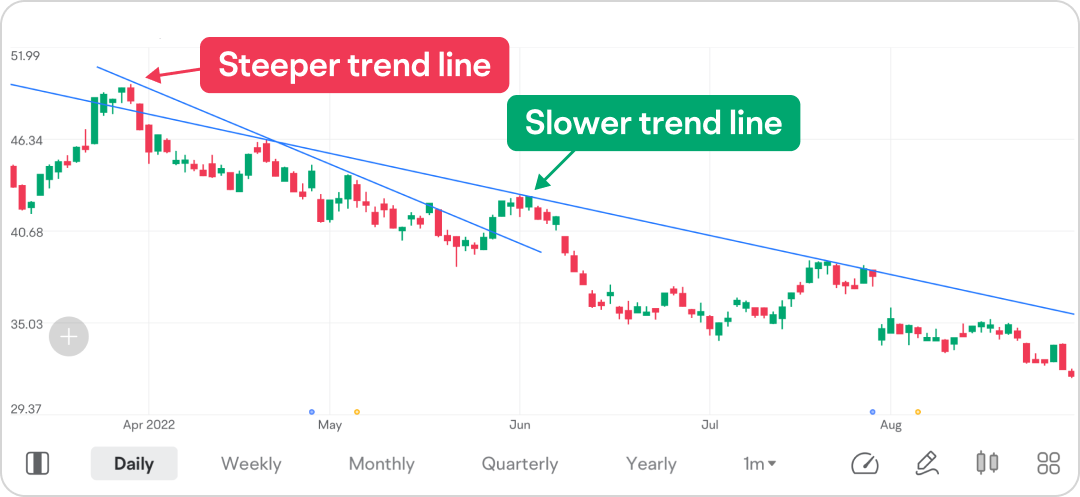
On the other hand, if the trend line is not steep enough to accurately track the asset price movement, a second, steeper trend line can be drawn. This may provide a more accurate representation of the price action.
03 Potential trading signals with trend lines
There are many ways to use trend lines to help trading. The following strategies might be widely used by trend traders.
Trend line bounce
The goal of trend line bounce is to trade with the trend that is perhaps supported by the major trend line.
For instance, in an uptrend, traders might look for buying opportunities when the price approaches or touches the uptrend line and signals a potential bounce.
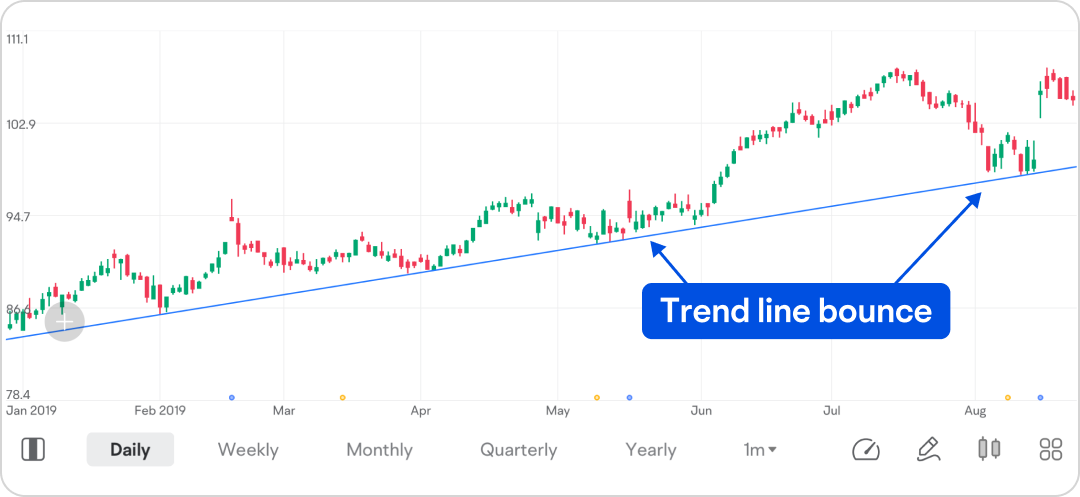
A potential bounce signal might be identified by some candlestick patterns and technical indicators.
Generally speaking, the more touch points a trend line has, the more likely to see the trend line bounce occurs.
Trend line break
The trend line break can be considered a countertrend line trading strategy because it might signal a possible price reversal.
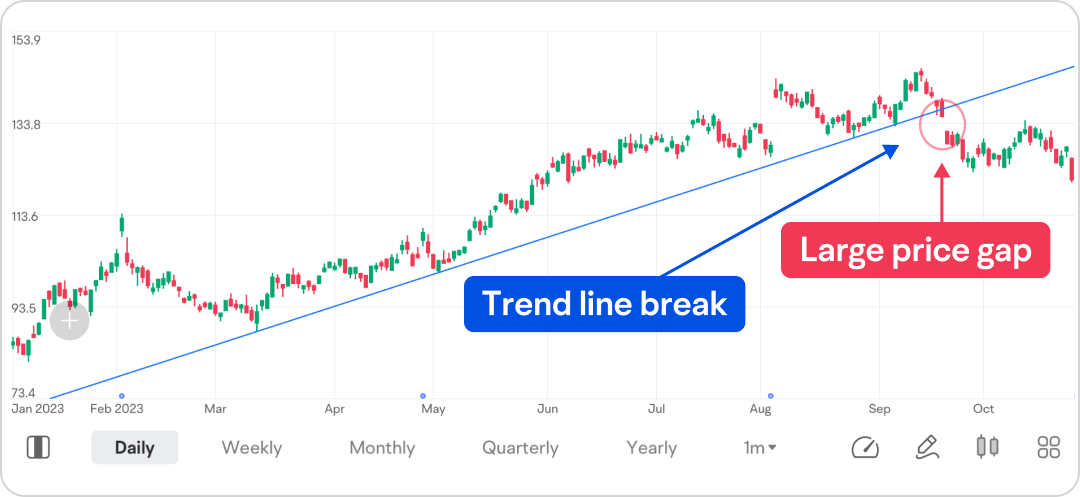
If the price breaks a major trend line with a spike in trading volume and a large price gap, it can be a significant signal of a potential price reversal. However, such circumstances are rare.
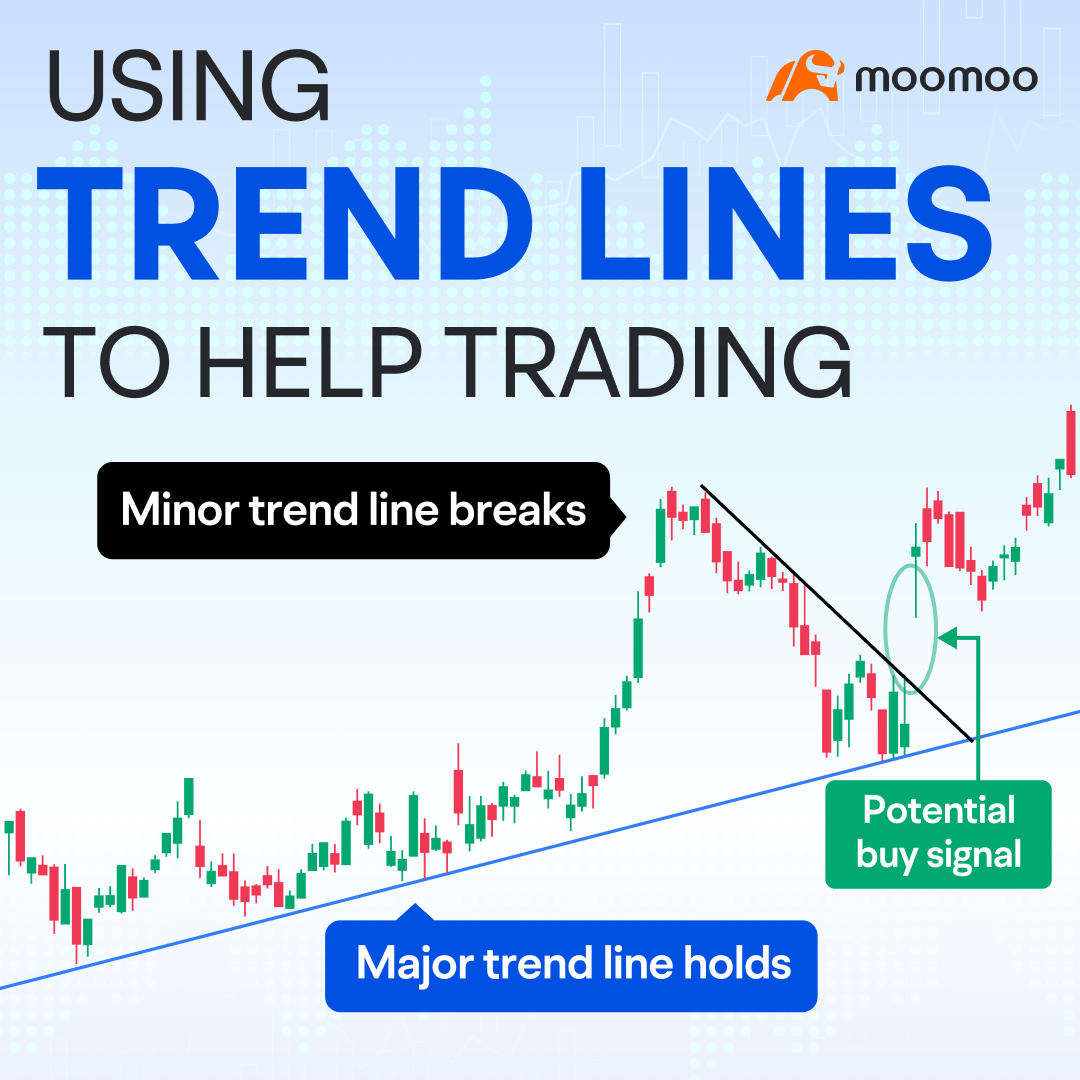
Few trend-following investors take advantage of trend line breaks. However, a short-term trend line break, which is also referred to as minor trend line break, can lead to a longer-term trend following strategy.
What does it mean? For example, a trader has a longer-term uptrend line. A retracement occurs when the price moves against the uptrend. The trader might add a short-term downtrend line to track the retracement and wait for a potential breakout.
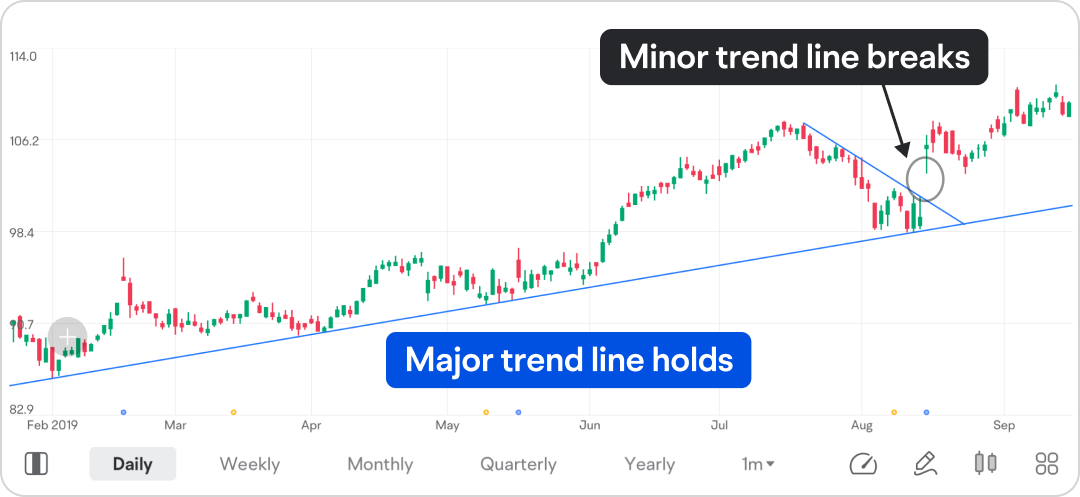
This could mean a countertrend line trading strategy becomes a trend line following strategy from a longer-term perspective.
Trend line retest
A trend line retest occurs when the price breaks a trend line and then trades back into the line before moving in the direction of the new trend.
Making a reversal trade when the price is just breaking through a major trend line is considered aggressive because prices can sometimes violate a trend line on an intraday basis, but then close back in.
A more conservative approach would be wait for a possible trend line retest before making any trades.
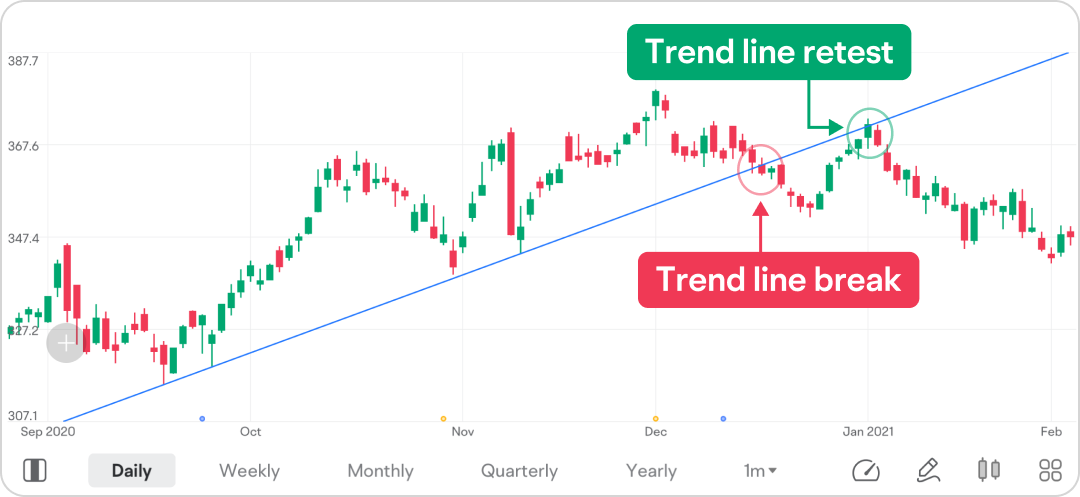
For example, a broken uptrend line might serve as potential resistance. If the broken uptrend line resists the price from rising higher, traders may interpret this as a signal that the price is likely to reverse direction and move downwards.
This presentation discusses technical analysis, other approaches, including fundamental analysis, may offer very different views. The examples provided are for illustrative purposes only and are not intended to be reflective of the results you can expect to achieve.
All investing involves risk, including the potential loss of principal, and there can be no guarantee that any investing strategy will be successful.
This presentation is for informational and educational use only and is not a recommendation or endorsement of any particular investment or investment strategy. Investment information provided in this content is general in nature, strictly for illustrative purposes, and may not be appropriate for all investors. Read more