Adobe shares make a comeback: are they bottoming out?(06/18/2024)
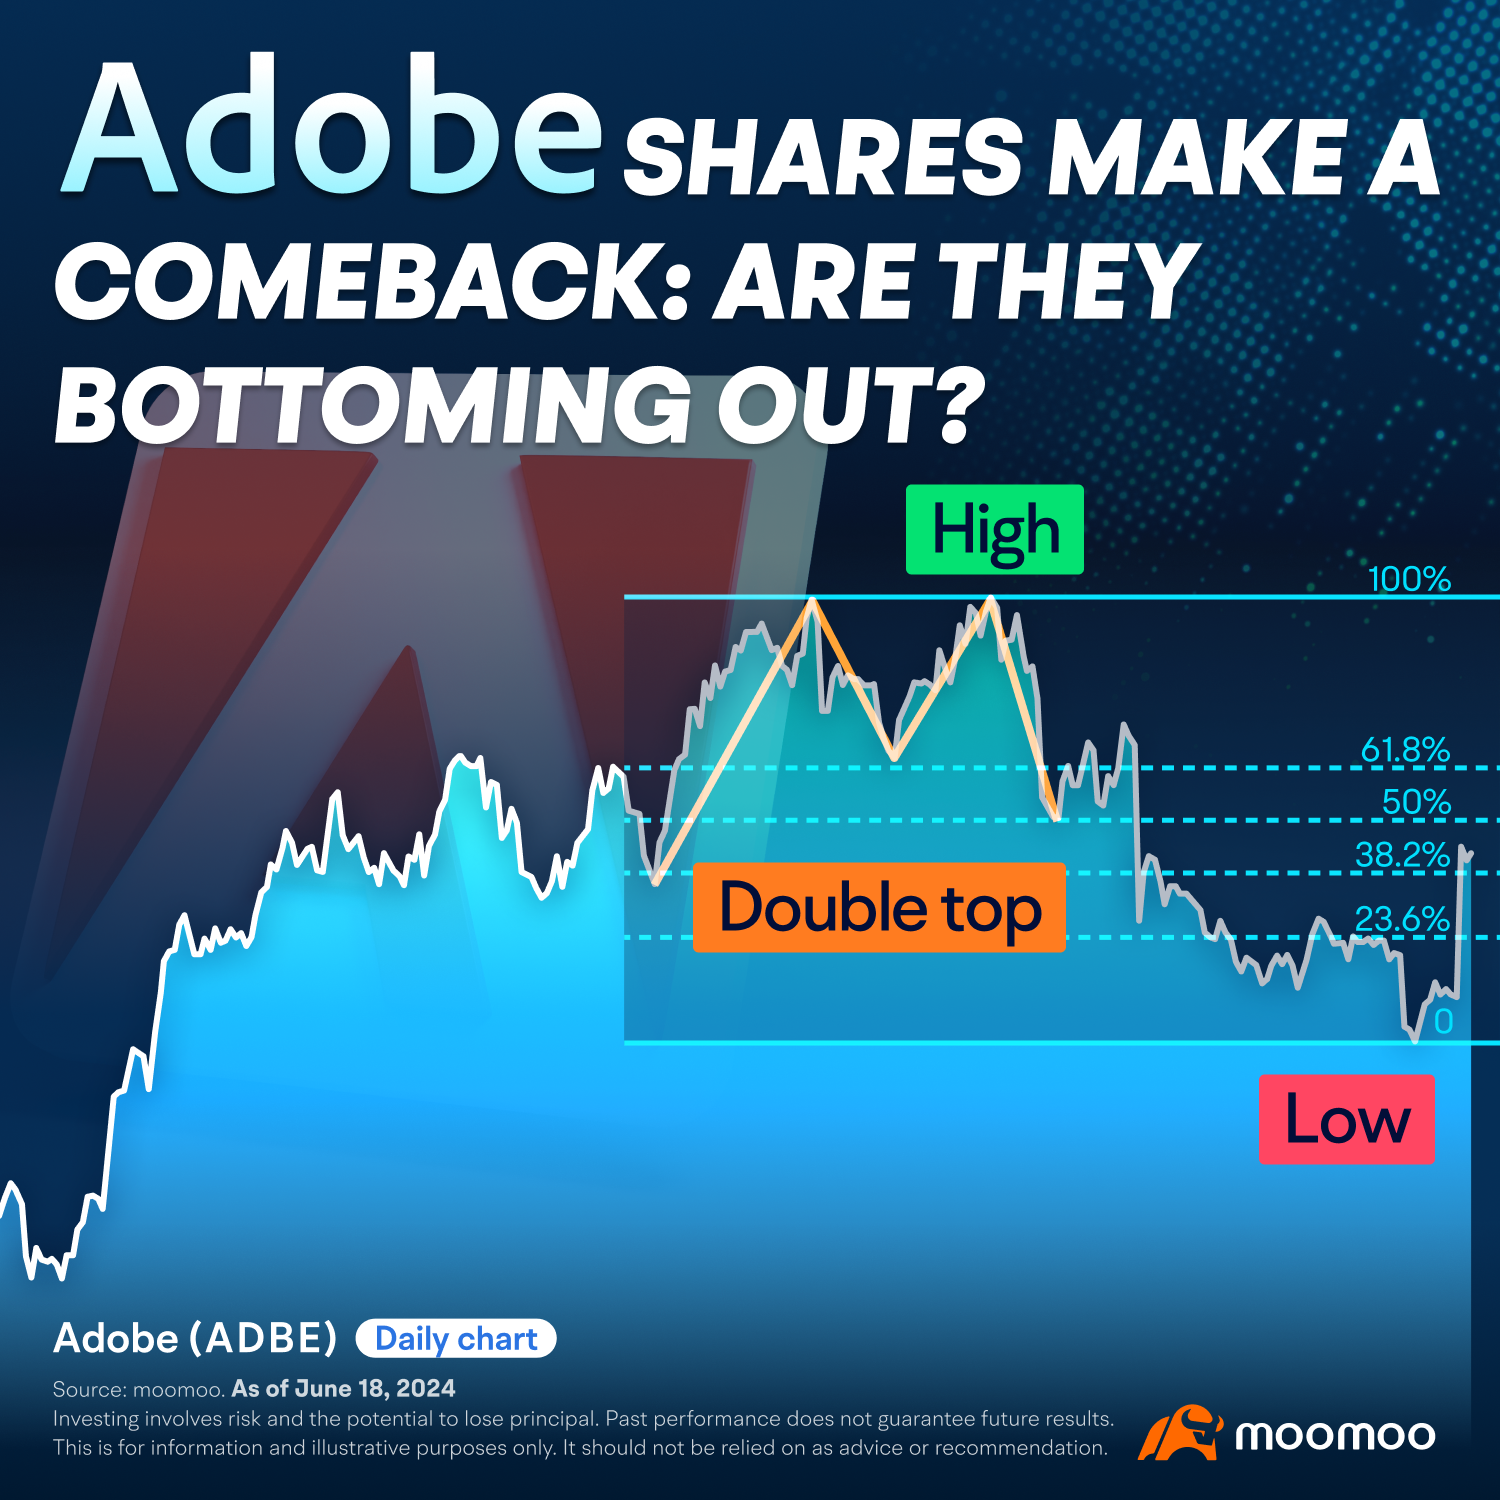
Hello, everyone! This week we turn our spotlight on Adobe Inc. (NASDAQ: ADBE), the maker of popular design and imaging software like Photoshop. We’ll explore the latest trends and take a close look at the company’s recent market activity.
What’s new?
On June 14, 2024, Adobe’s shares surged more than 14% following the release of the company’s earnings report, which exceeded estimates and led to an increase in full-year guidance.
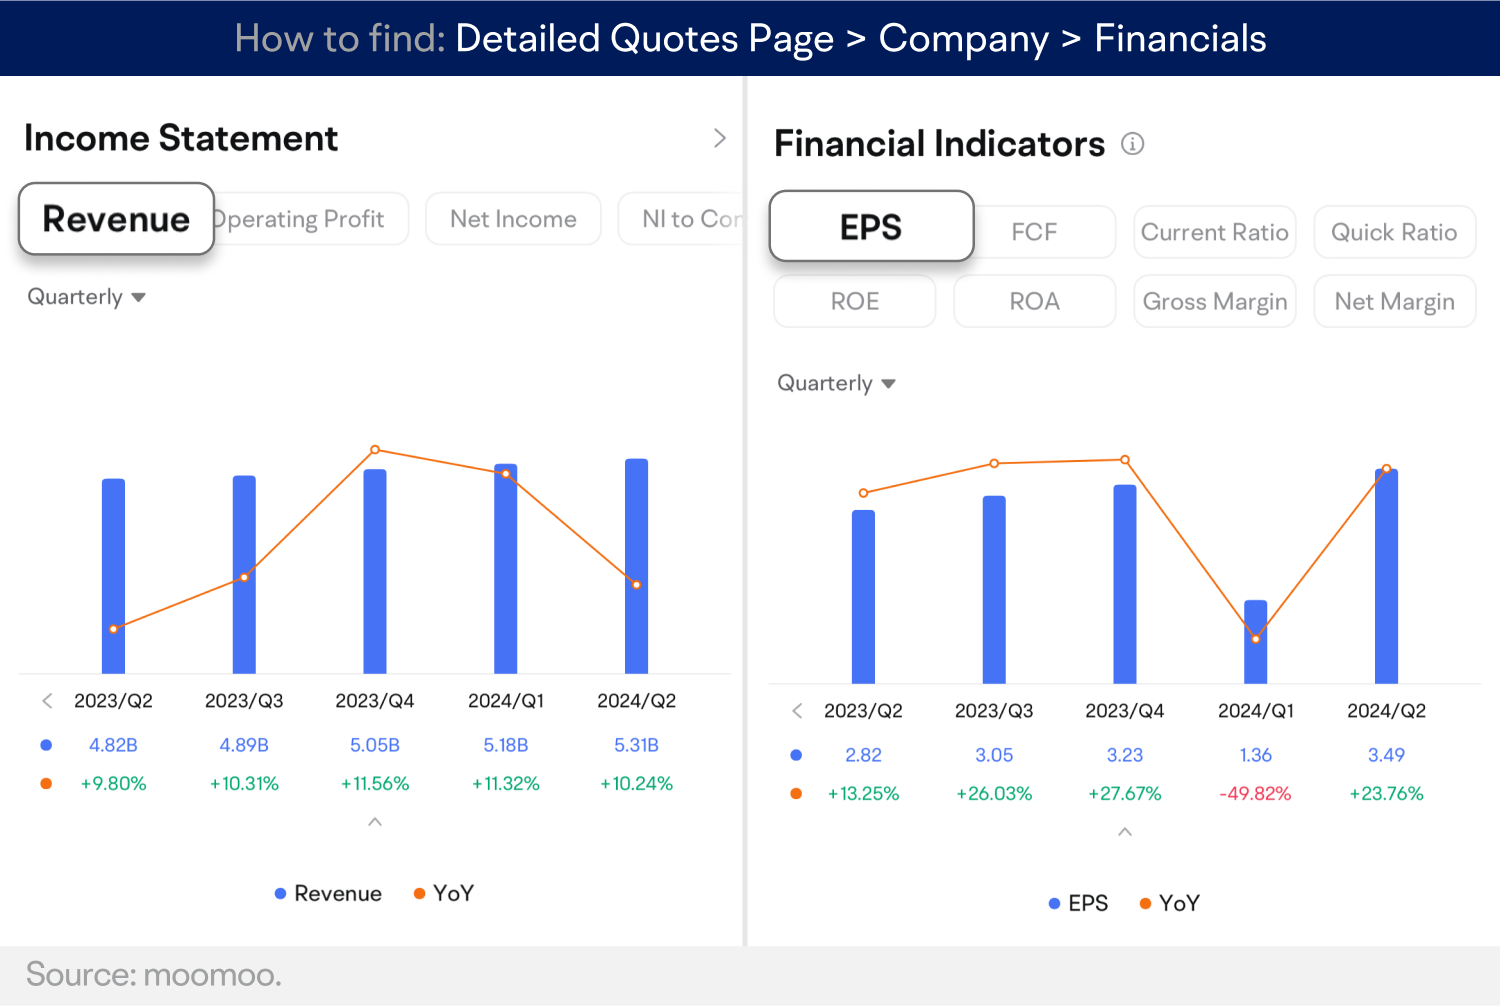
This marked a significant turnaround for the stock, which had been down 23% for the year prior to the announcement.
The software sector had underperformed during this earnings season, leading to doubts about whether Adobe’s Firefly, which offers generative AI tools, would provide a significant boost to their creative and marketing products. However, some of those doubts have now been dispelled.
J.P. Morgan analyst Mark Murphy raised his rating on Adobe stock to “Overweight” from “Neutral” and increased his target price to $580 from $570. He believes that there is a good chance that investors are currently experiencing a “Firefly trough of disillusionment,” but anticipates that monetization will gradually build in the second half of this year and into the next.
One challenge in evaluating Adobe’s success is the lack of disclosure regarding how much of its revenue is generated by AI. This means investors must instead rely on metrics such as “digital media net new annualized recurring revenue,” which measures new business for Adobe’s cloud products for documents and creative applications. This metric came in at $487 million, above the company’s forecast of $440 million.
Chart of the day
Trend analysis:
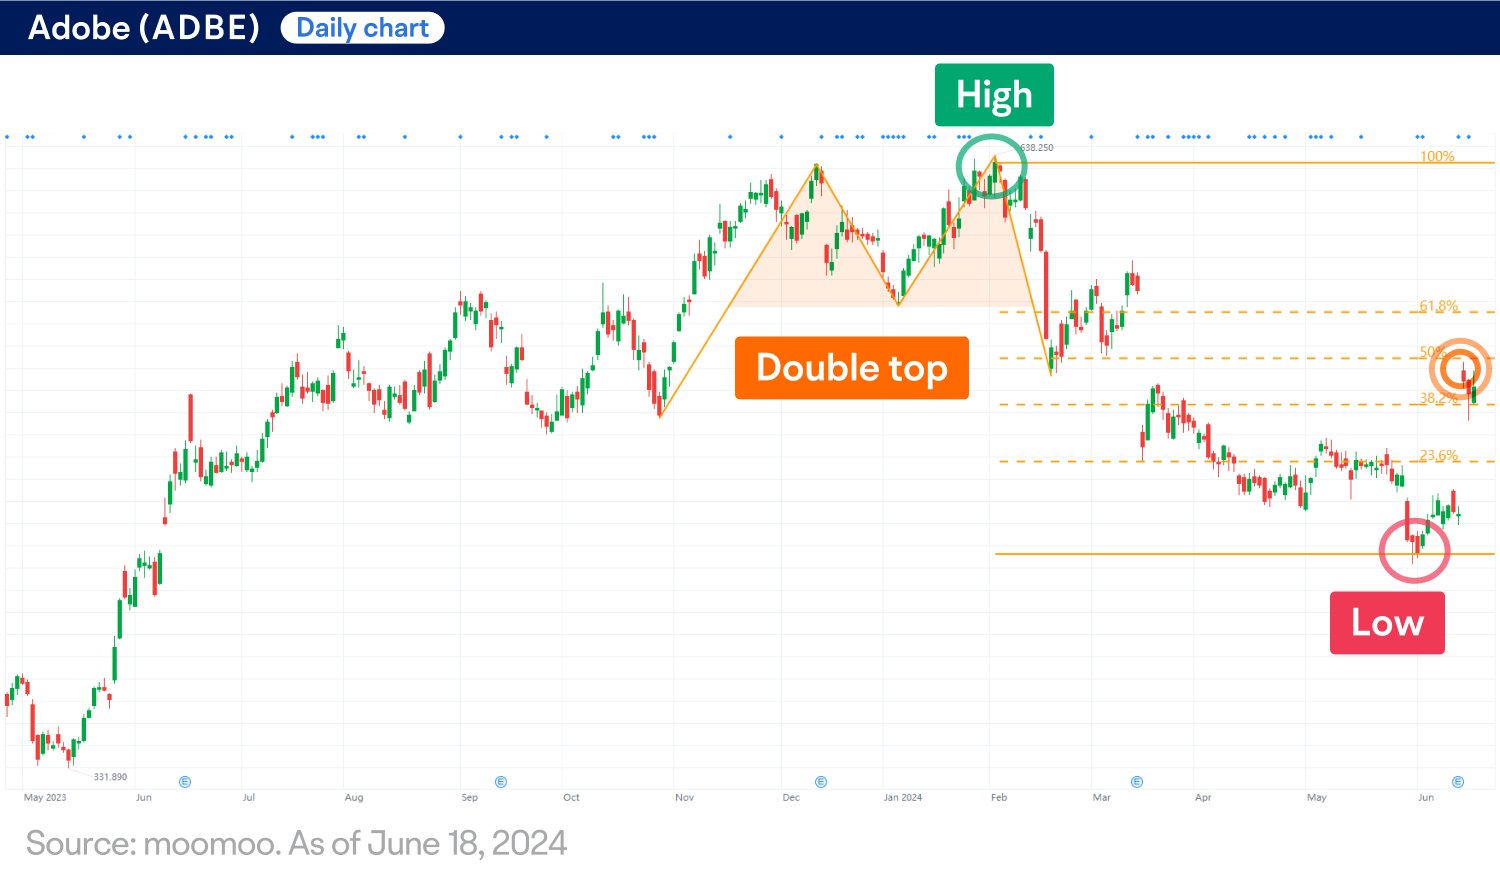
Following a high of $638.25 in early February 2024, Adobe’s shares (ADBE) have been in a downtrend, declining around 30% to reach a low of $433.97 within four months. However, the stock has since rebounded and retraced approximately 50% of its prior declines at one time, as depicted on the Fibonacci retracement tool on the daily chart.
Technical indicators:
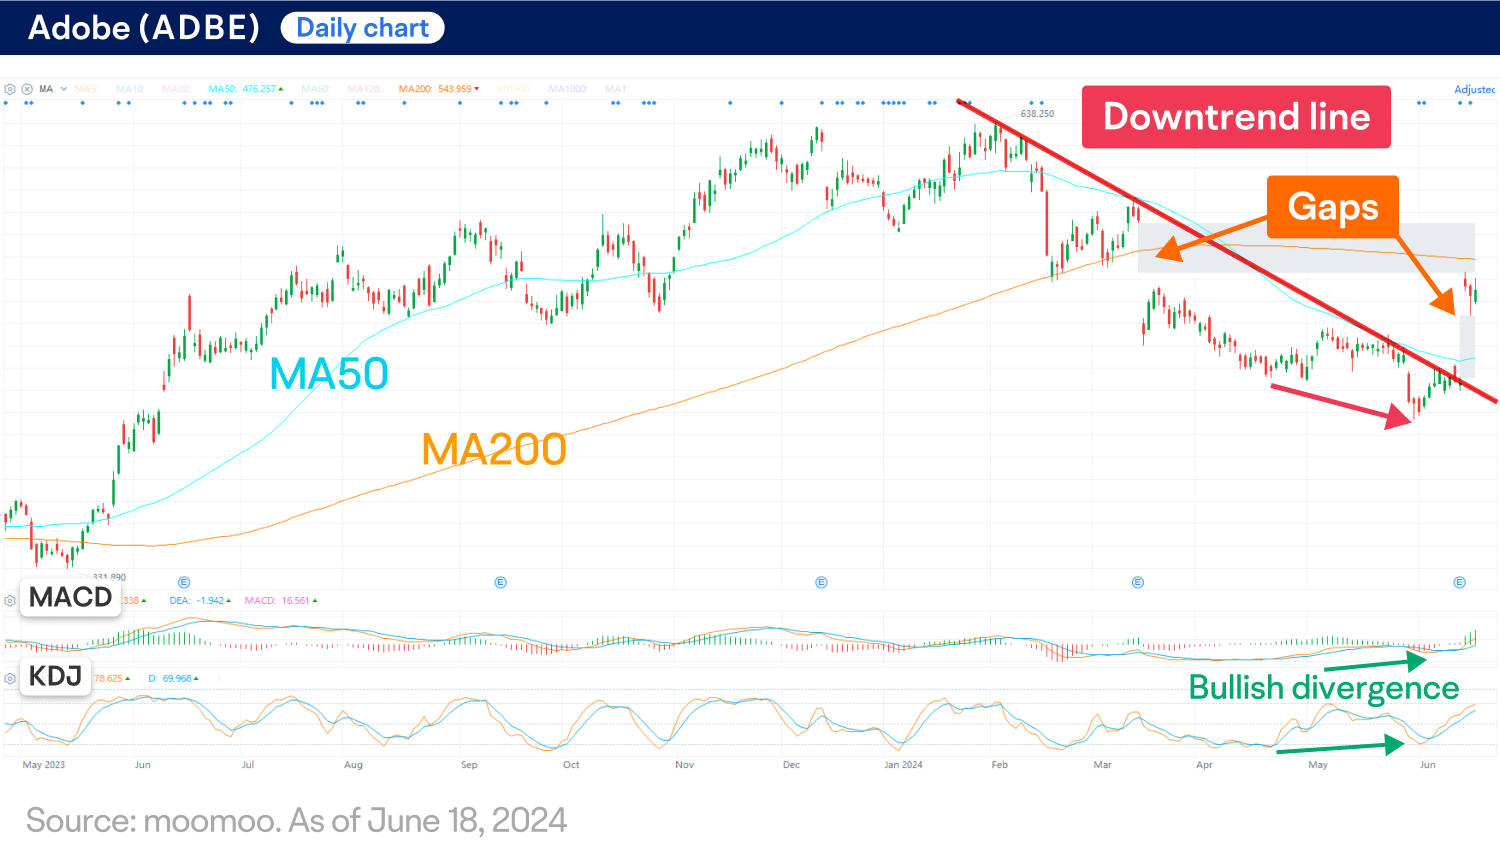
ADBE is currently trading above the 50-day moving average (MA50) after breaking out of a downtrend line, indicating potential upside momentum in the short term.
The moving average convergence/divergence (MACD) oscillator shows a bullish divergence and a bullish crossover signal below the zero line, suggesting the possibility of a short-term market bottom.
The KDJ indicator also corresponds to the bullish signals generated by the MACD.
The price is currently trading between two large gaps that were formed following the company’s most recent earnings reports. This might suggest that traders expect to see a gap fill in the near term.
Next move?
Since hitting a low of $433.97 on May 31, 2024, ADBE has rebounded more than 20%, indicating a potential bull market from a technical standpoint. Traders might want to monitor the key 50% and 61.8% Fibonacci retracement levels on the daily chart, as well as the MA200, which might serve as a potential resistance. Additionally, the impending gap fill could serve as an indicator of the market direction in the near term.
This presentation discusses technical analysis, other approaches, including fundamental analysis, may offer very different views. The examples provided are for illustrative purposes only and are not intended to be reflective of the results you can expect to achieve.
All investing involves risk, including the potential loss of principal, and there can be no guarantee that any investing strategy will be successful.
This presentation discusses technical analysis, other approaches, including fundamental analysis, may offer very different views. The examples provided are for illustrative purposes only and are not intended to be reflective of the results you can expect to achieve.
All investing involves risk, including the potential loss of principal, and there can be no guarantee that any investing strategy will be successful.
This presentation is for informational and educational use only and is not a recommendation or endorsement of any particular investment or investment strategy. Investment information provided in this content is general in nature, strictly for illustrative purposes, and may not be appropriate for all investors. Read more