How to Identify a Tweezer Top

When you see two candlesticks on a price chart coming together like a pair of tweezers, you need to be cautious as this could be a signal of a bearish reversal. This article will introduce this tweezer-like bearish reversal candlestick pattern, known as a Tweezer Top.
What is a tweezer top?
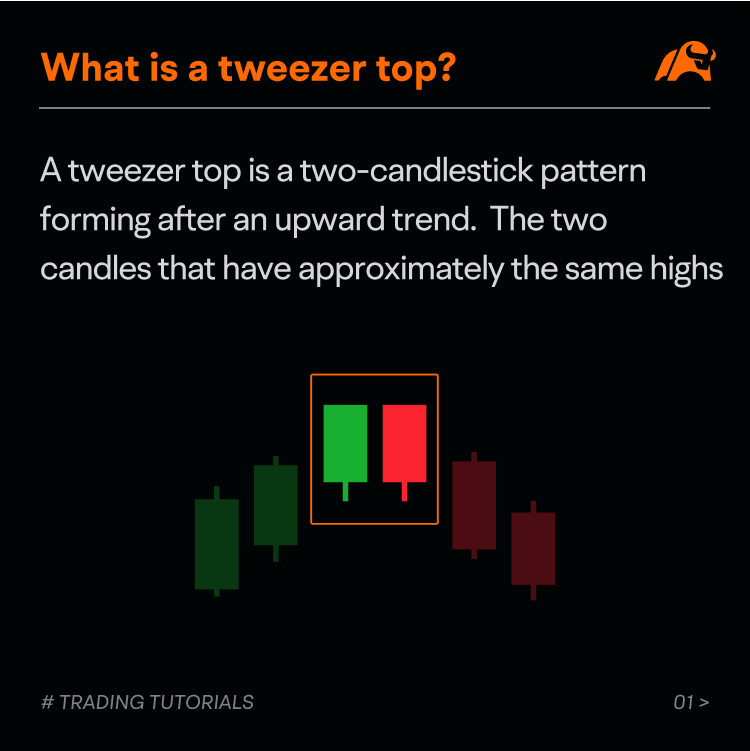
A Tweezer Top is a short-term bearish reversal pattern that typically forms after an upward trend in the market.
It consists of two consecutive candlesticks with nearly identical highs, creating a visual resemblance to a pair of tweezers.
The Tweezer Top pattern may signal a market top, suggesting a shift from an upward trend to a downward trend.
How does a tweezer top occur?
Investors often sell their holdings to secure profits when the price reaches a new high or a record high. This can result in significant selling pressure on the market.
When the price fails to break through the high level on two consecutive attempts, it suggests that the bullish momentum is waning and bears are gaining strength.
This phenomenon may create a temporary top on the chart, indicating a potential price decline in the future.
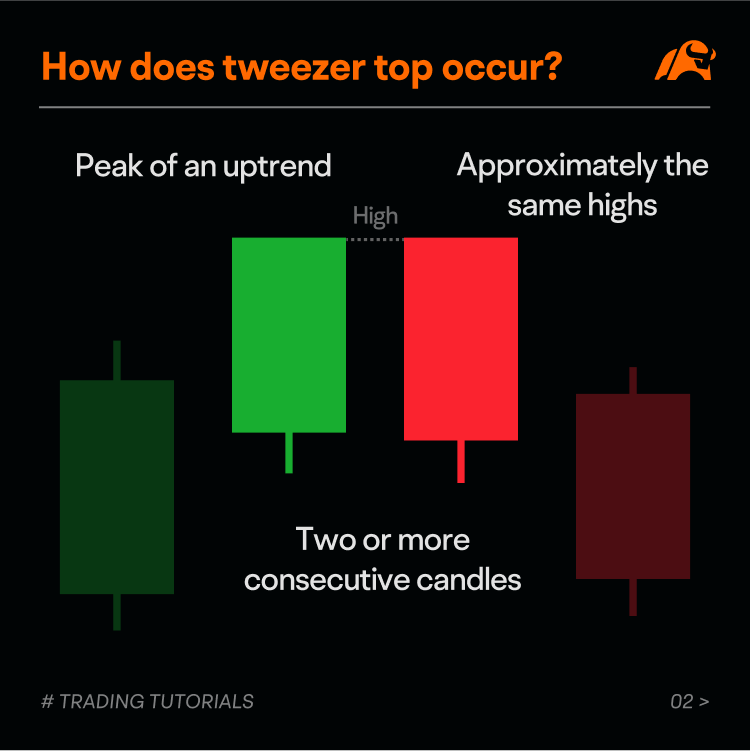
A typical Tweezer Top pattern has the following features:
● It occurs at the peak of an uptrend.
● It consists of two or more consecutive candles, which can be either bullish or bearish. The color of the candles is not crucial, although some traders believe that the first candle in the pattern should be green, while the second one should be red.
● Two consecutive candles with nearly identical highs. They can take various shapes, such as solid bodies, shadows, or doji stars.
How to identify a tweezer top?
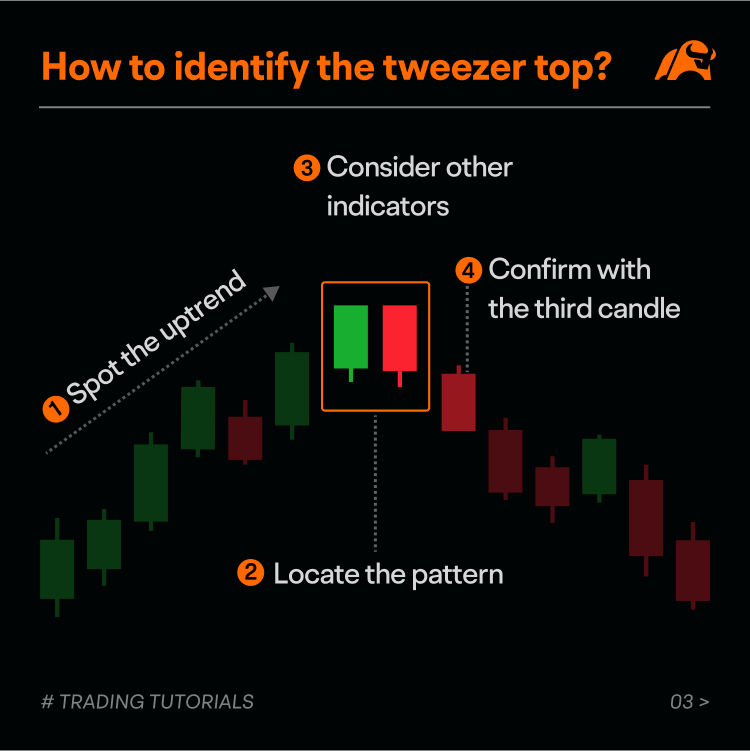
When looking for a Tweezer Top pattern as a reversal signal, you can follow these simple steps:
1. Spot an uptrend: Identify a clear upward trend before the pattern appears. If the Tweezer Top pattern forms at the market's peak, the reversal signal is more reliable.
2. Locate the pattern: Look for at least two consecutive candles with the same highs. This suggests that the price is facing resistance at that level, indicating a possible trend reversal. A large bullish (green) candle followed by a small bearish (red) one enhances the reversal signal.
3. Consider other indicators: If the Tweezer Top pattern coincides with other bearish patterns like a bearish engulfing or dark cloud cover, the reversal is more reliable.
4. Confirm with the third candle: To gain more confidence in the bearish signal, observe the price movement of the third candle. If it is a bearish candle indicating a price drop, it may mark the beginning of a bearish trend.
Case study
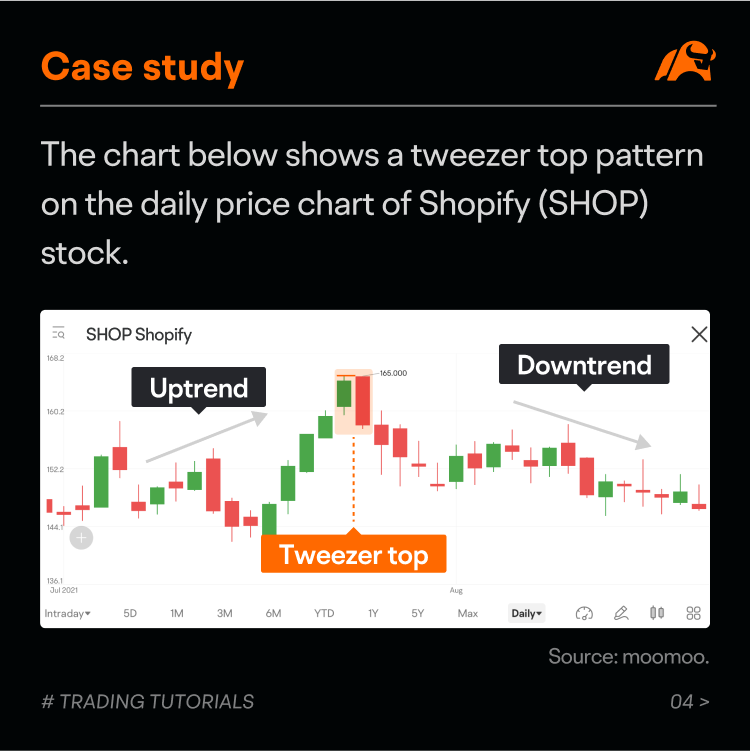
The chart below shows a Tweezer Top pattern on Shopify (SHOP) stock's daily price chart.
Before this pattern emerged, the stock price had been rising strongly, indicating high buying sentiment among investors.
At the top of the uptrend, two consecutive candles with the same highest price formed a Tweezer Top. The first candle was bullish, but the second one was bearish and completely covered the first candle's body, creating a bearish engulfing pattern that suggested a possible price peak.
To confirm this reversal signal, we can look at the next candle, which, in this case, was a bearish down candle. This further supported the prediction of a downward movement in the stock price.
As expected, Shopify's stock price then started to decline.
Summary
The Tweezer Top is a bearish pattern formed with two candles with nearly identical highs appearing at the top of an uptrend.
However, it's important to remember that the pattern is not always guaranteed to be successful and can occasionally produce false signals.
When trading candlestick patterns, it is important to factor in other technical methods.
This presentation is for informational and educational use only and is not a recommendation or endorsement of any particular investment or investment strategy. Investment information provided in this content is general in nature, strictly for illustrative purposes, and may not be appropriate for all investors. Read more