[August.2024]Unlocking the success of Yangzijiang shipbuilding: a deep dive into earnings
Many investors dream of discovering a "ten-bagger" stock that multiplies their investment tenfold. Yangzijiang Shipbuilding, a Chinese shipbuilder listed on the Singapore Exchange, has shown such potential. Since 2021, its stock has surged almost tenfold in under five years.
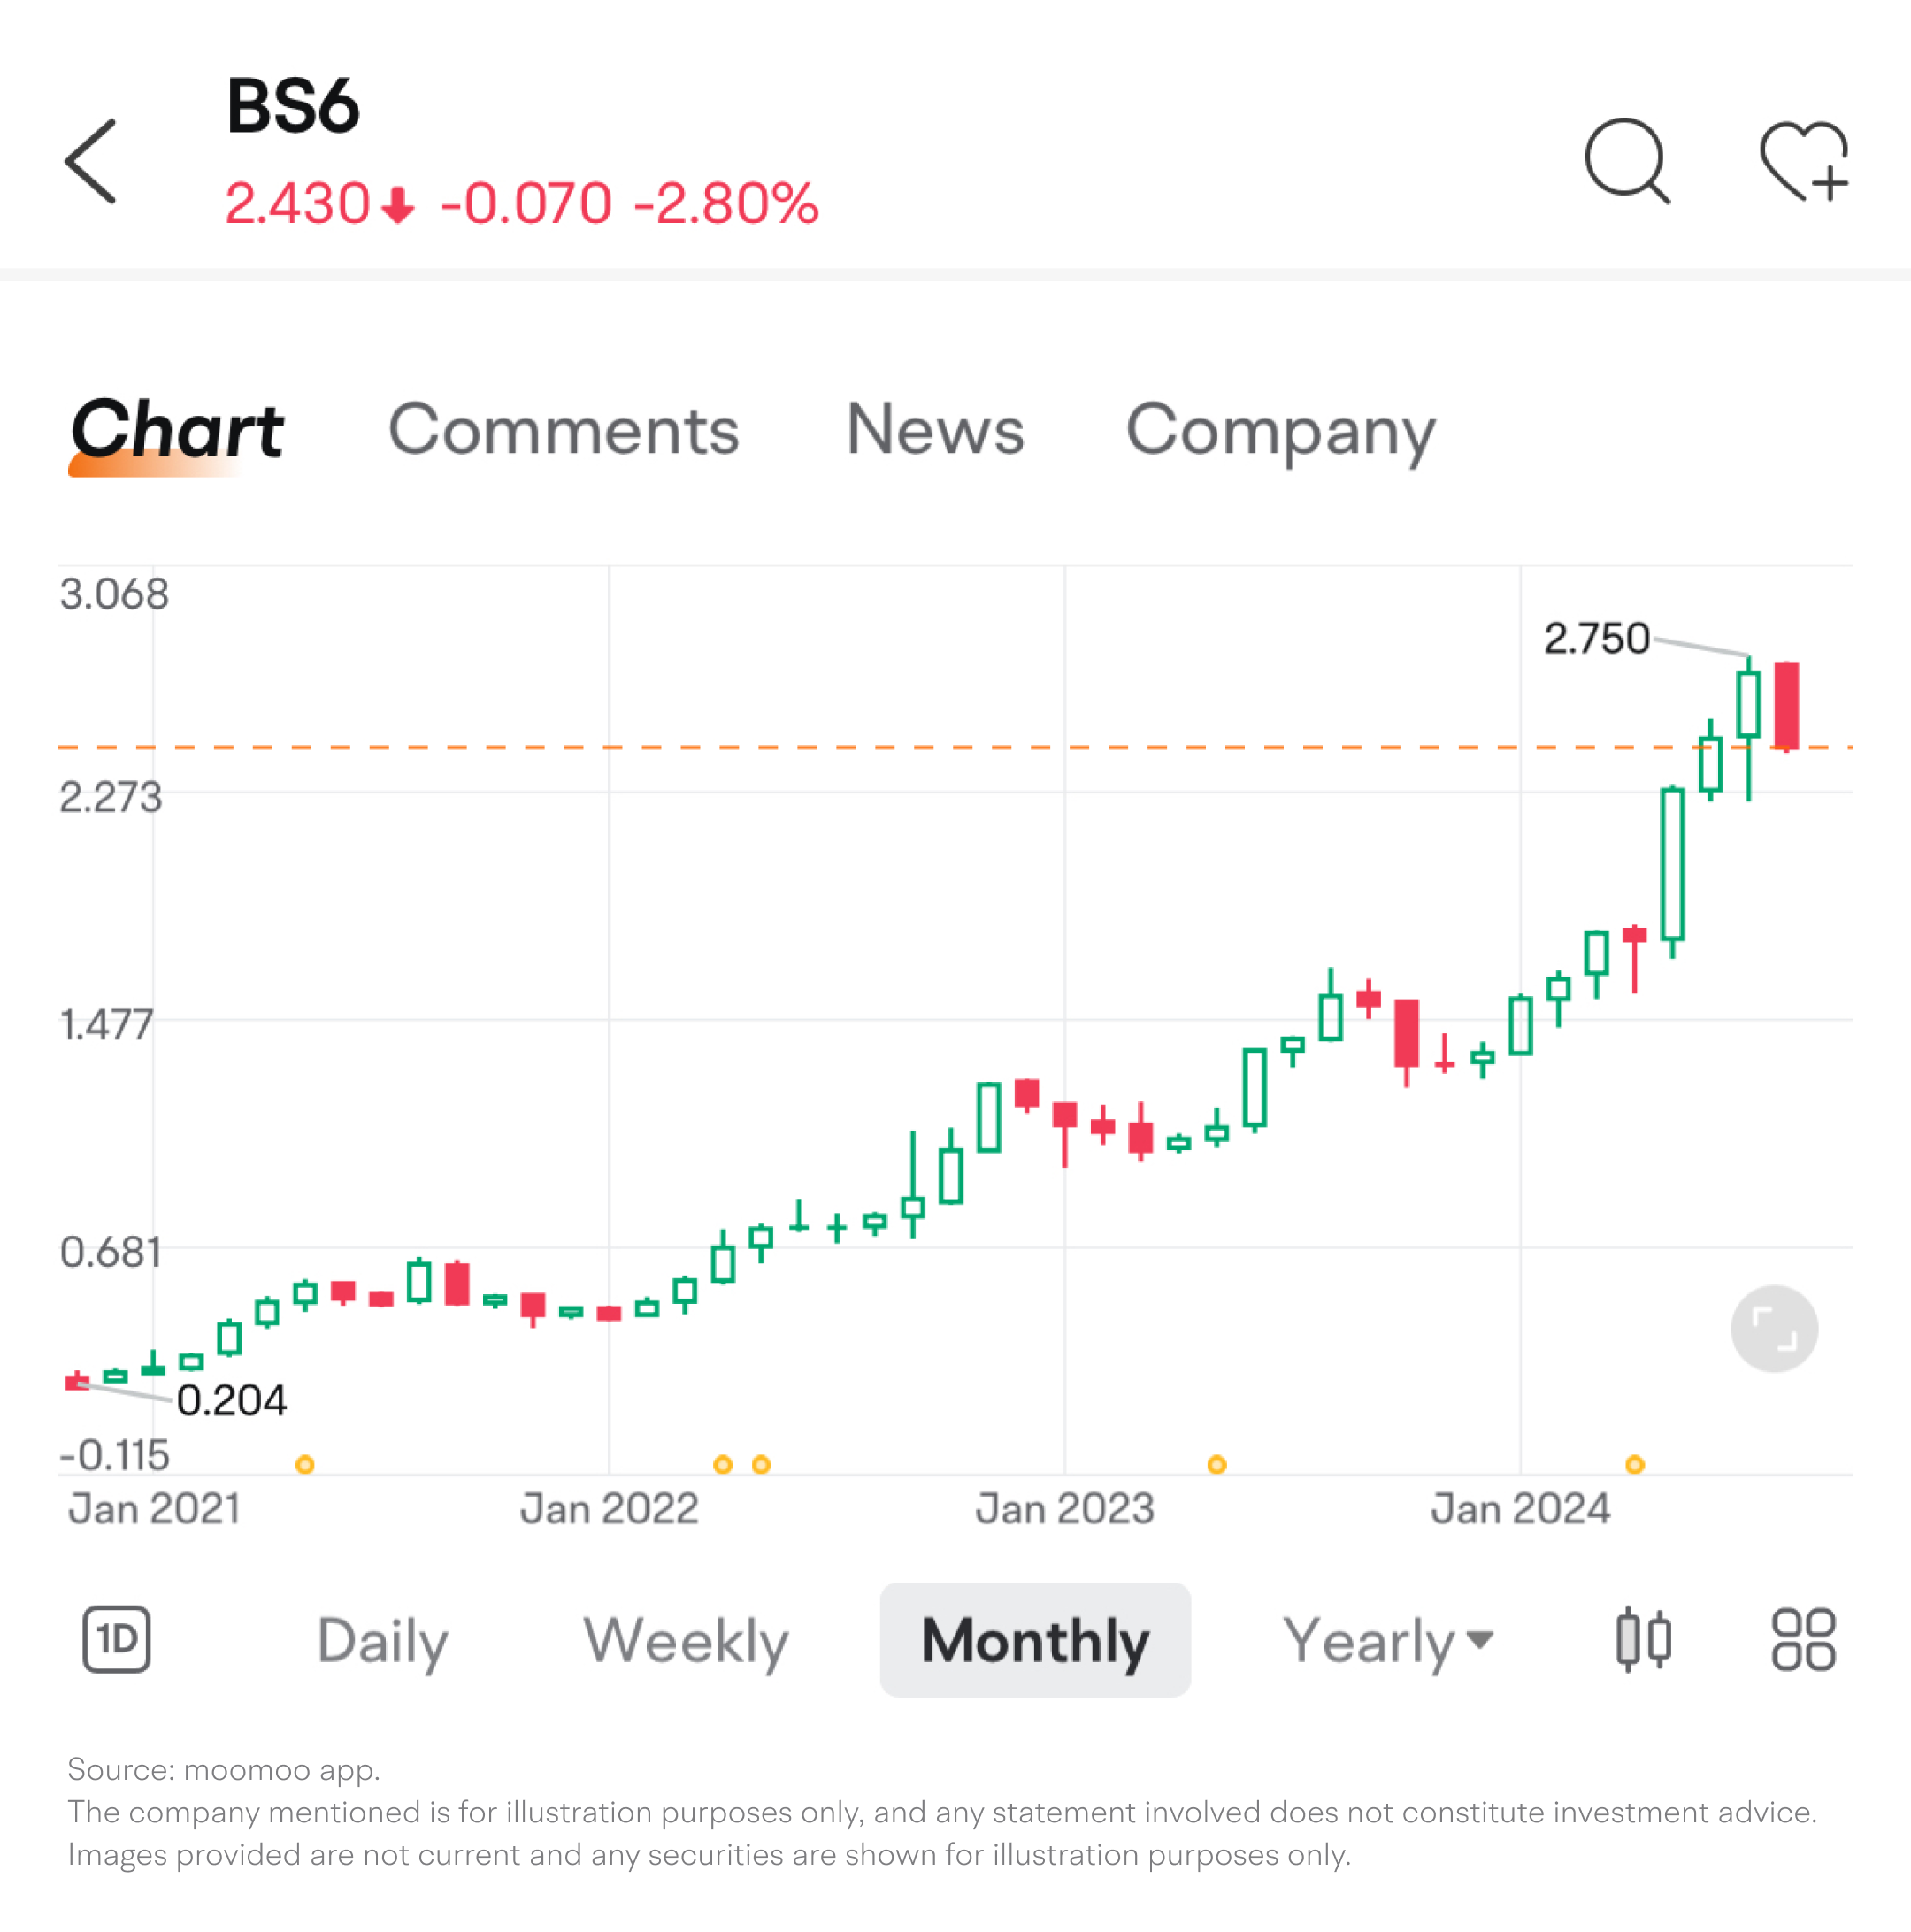
How did this Chinese shipbuilding giant create a rare tenfold return in the capital markets? Let's delve into its financial reports to find the answers.
Each earnings release may signal a potential investment opportunity, but before diving in, investors need to understand how to interpret their financial statements.
To evaluate its performance, we may focus on revenue growth, profitability, financial health, and shareholder returns.
1. Revenue growth
Most of Yangzijiang Shipbuilding’s revenue comes from its shipbuilding business, which is highly cyclical, closely tied to the health of the shipping industry and freight prices.
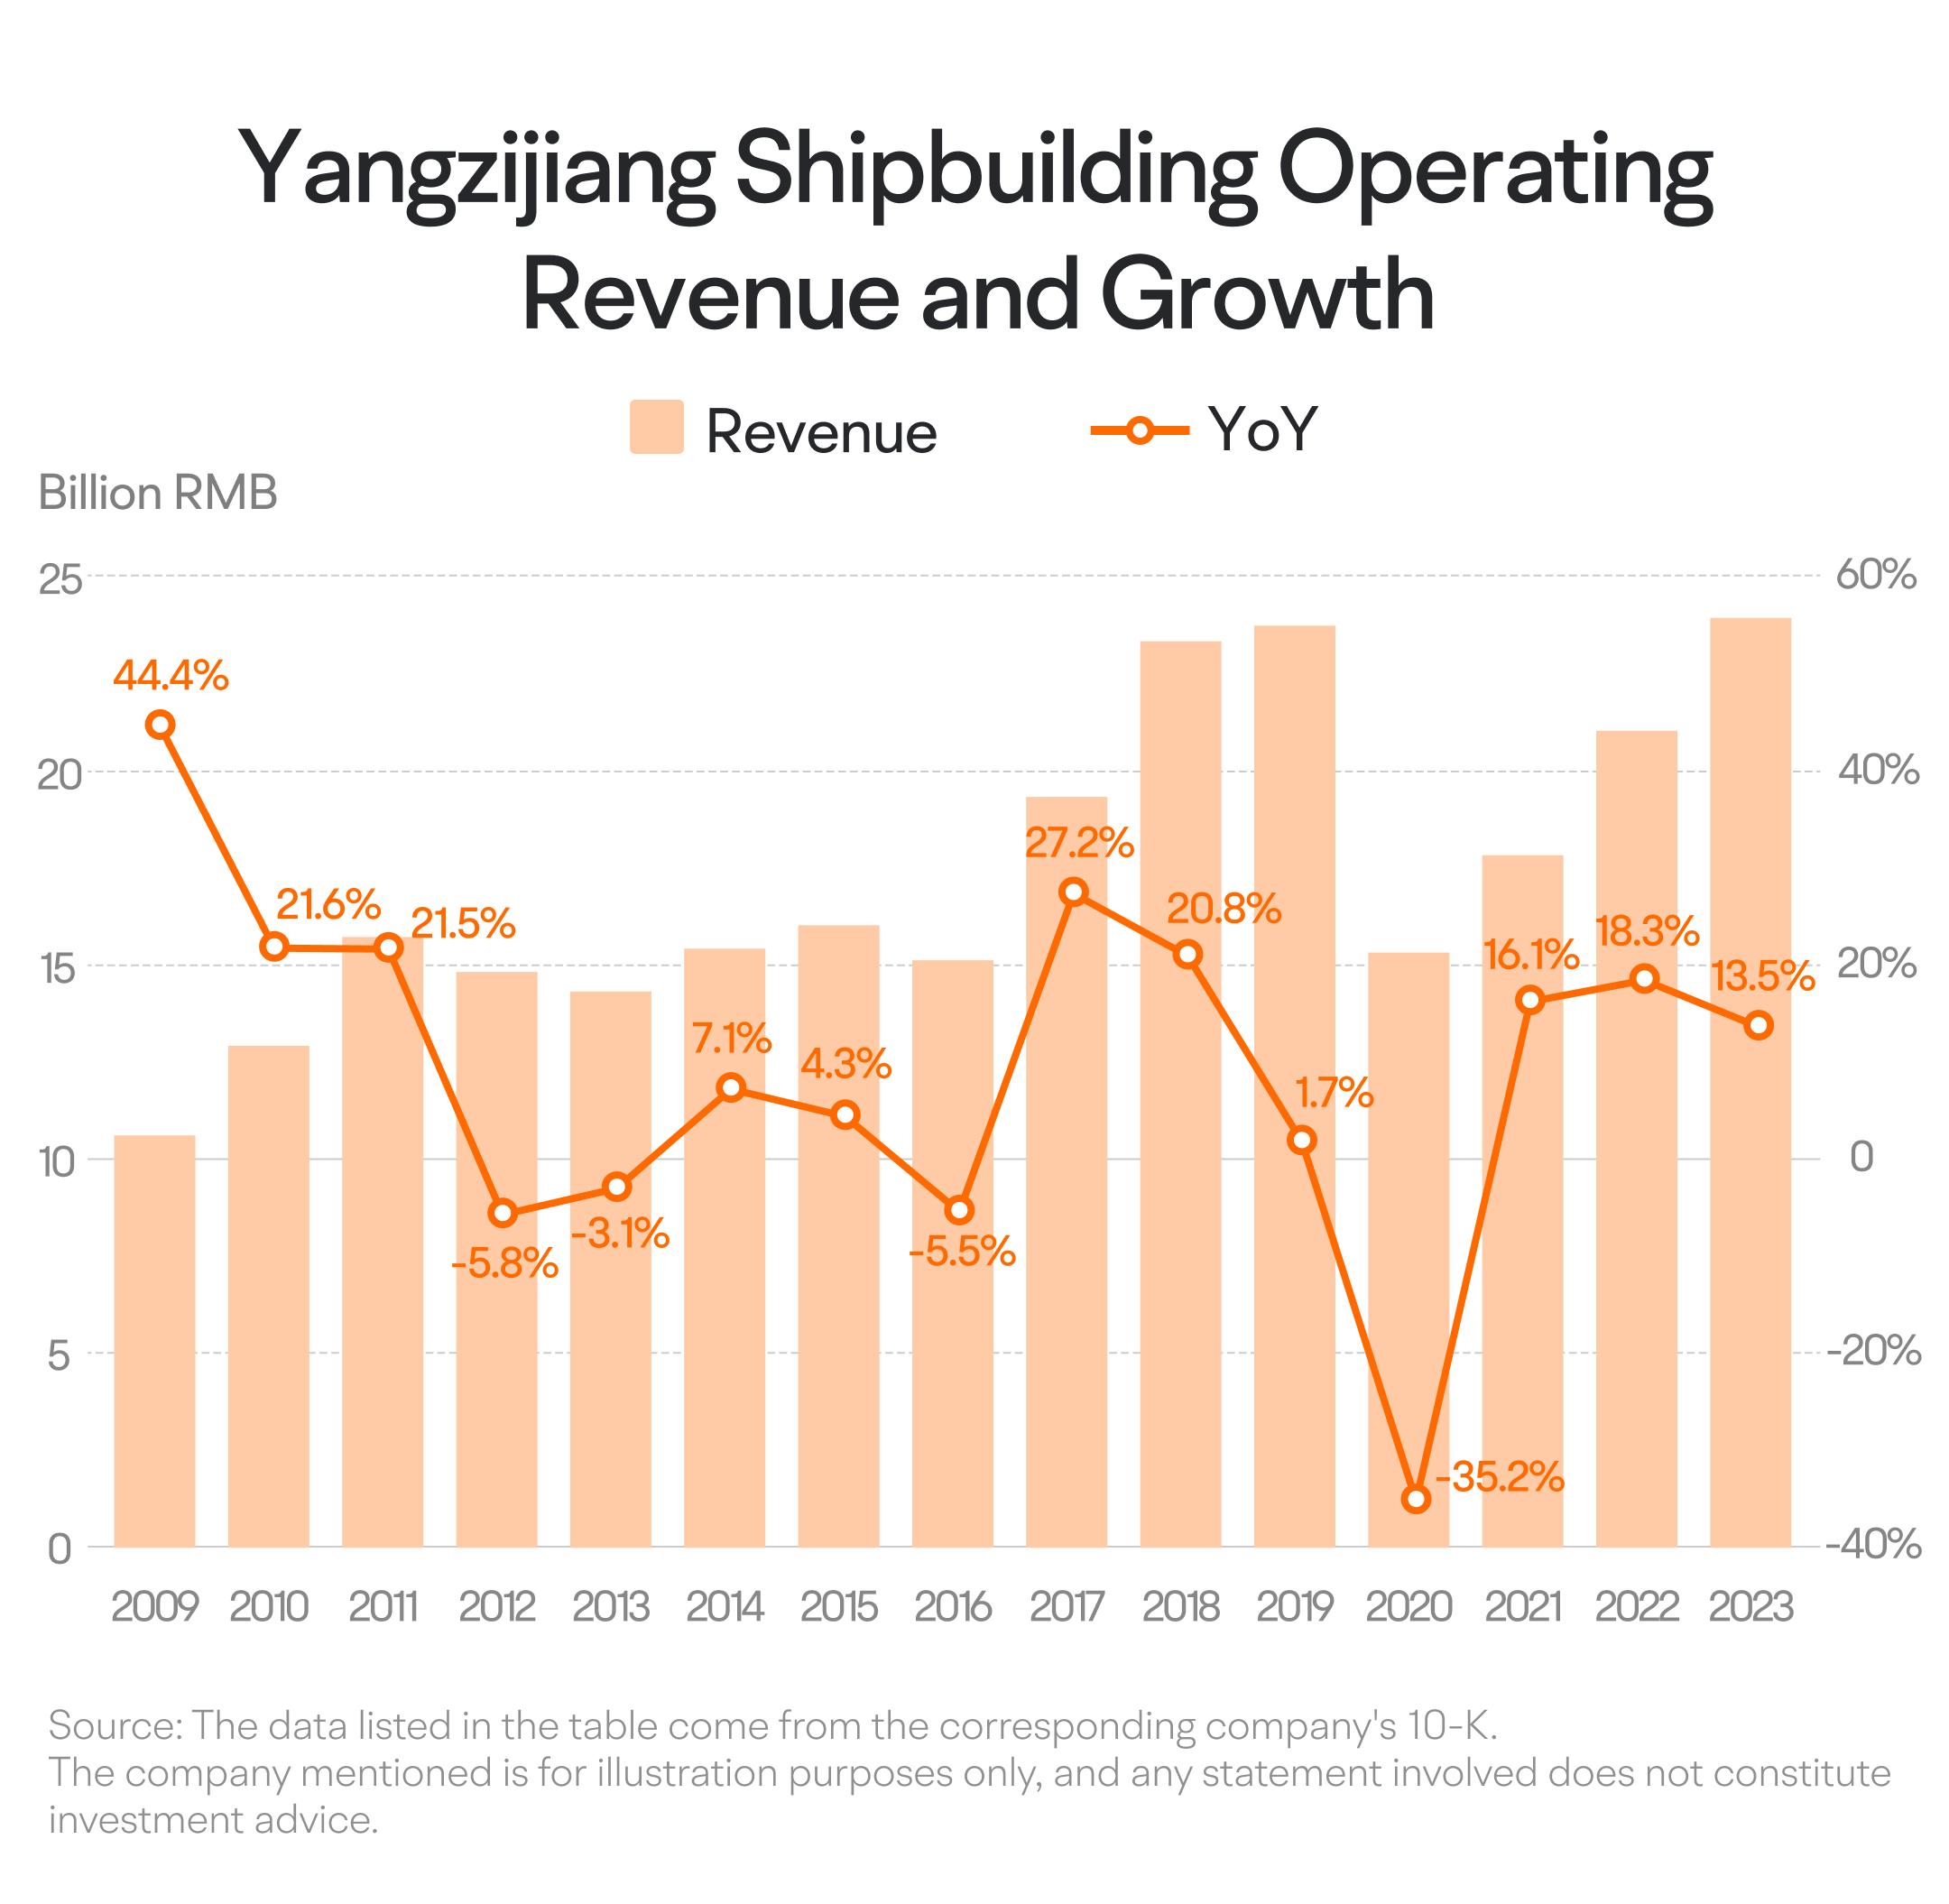
Overall, Yangzijiang's revenue has generally been on an upward trend but with noticeable cyclical fluctuations. Over the past 15 years, it grew from CNY 10.6 billion in 2009 to CNY 23.9 billion in 2023, an increase of 1.25 times. However, there have been periods of decline, such as between 2012 and 2013, when revenue decreased for two consecutive years and more than 30% dropped in 2020. It wasn't until three years of consecutive growth that a new peak was reached.
To forecast Yangzijiang Shipbuilding's future revenue growth, we may primarily focus on two indicators.
The first is the Baltic Dry Index (BDI), frequently mentioned in the company’s financial reports. The BDI tracks shipping rates for bulk commodities like steel and coal and is closely tied to the global economic environment and the health of the shipping industry. When the BDI trends upward, it suggests an expansion in the shipping sector, driving up demand for shipbuilding and boosting Yangzijiang's orders and revenue. Conversely, a declining BDI can pressure revenue growth. For instance, in 2023, a nearly 30% rise in the BDI helped Yangzijiang achieve record revenue.
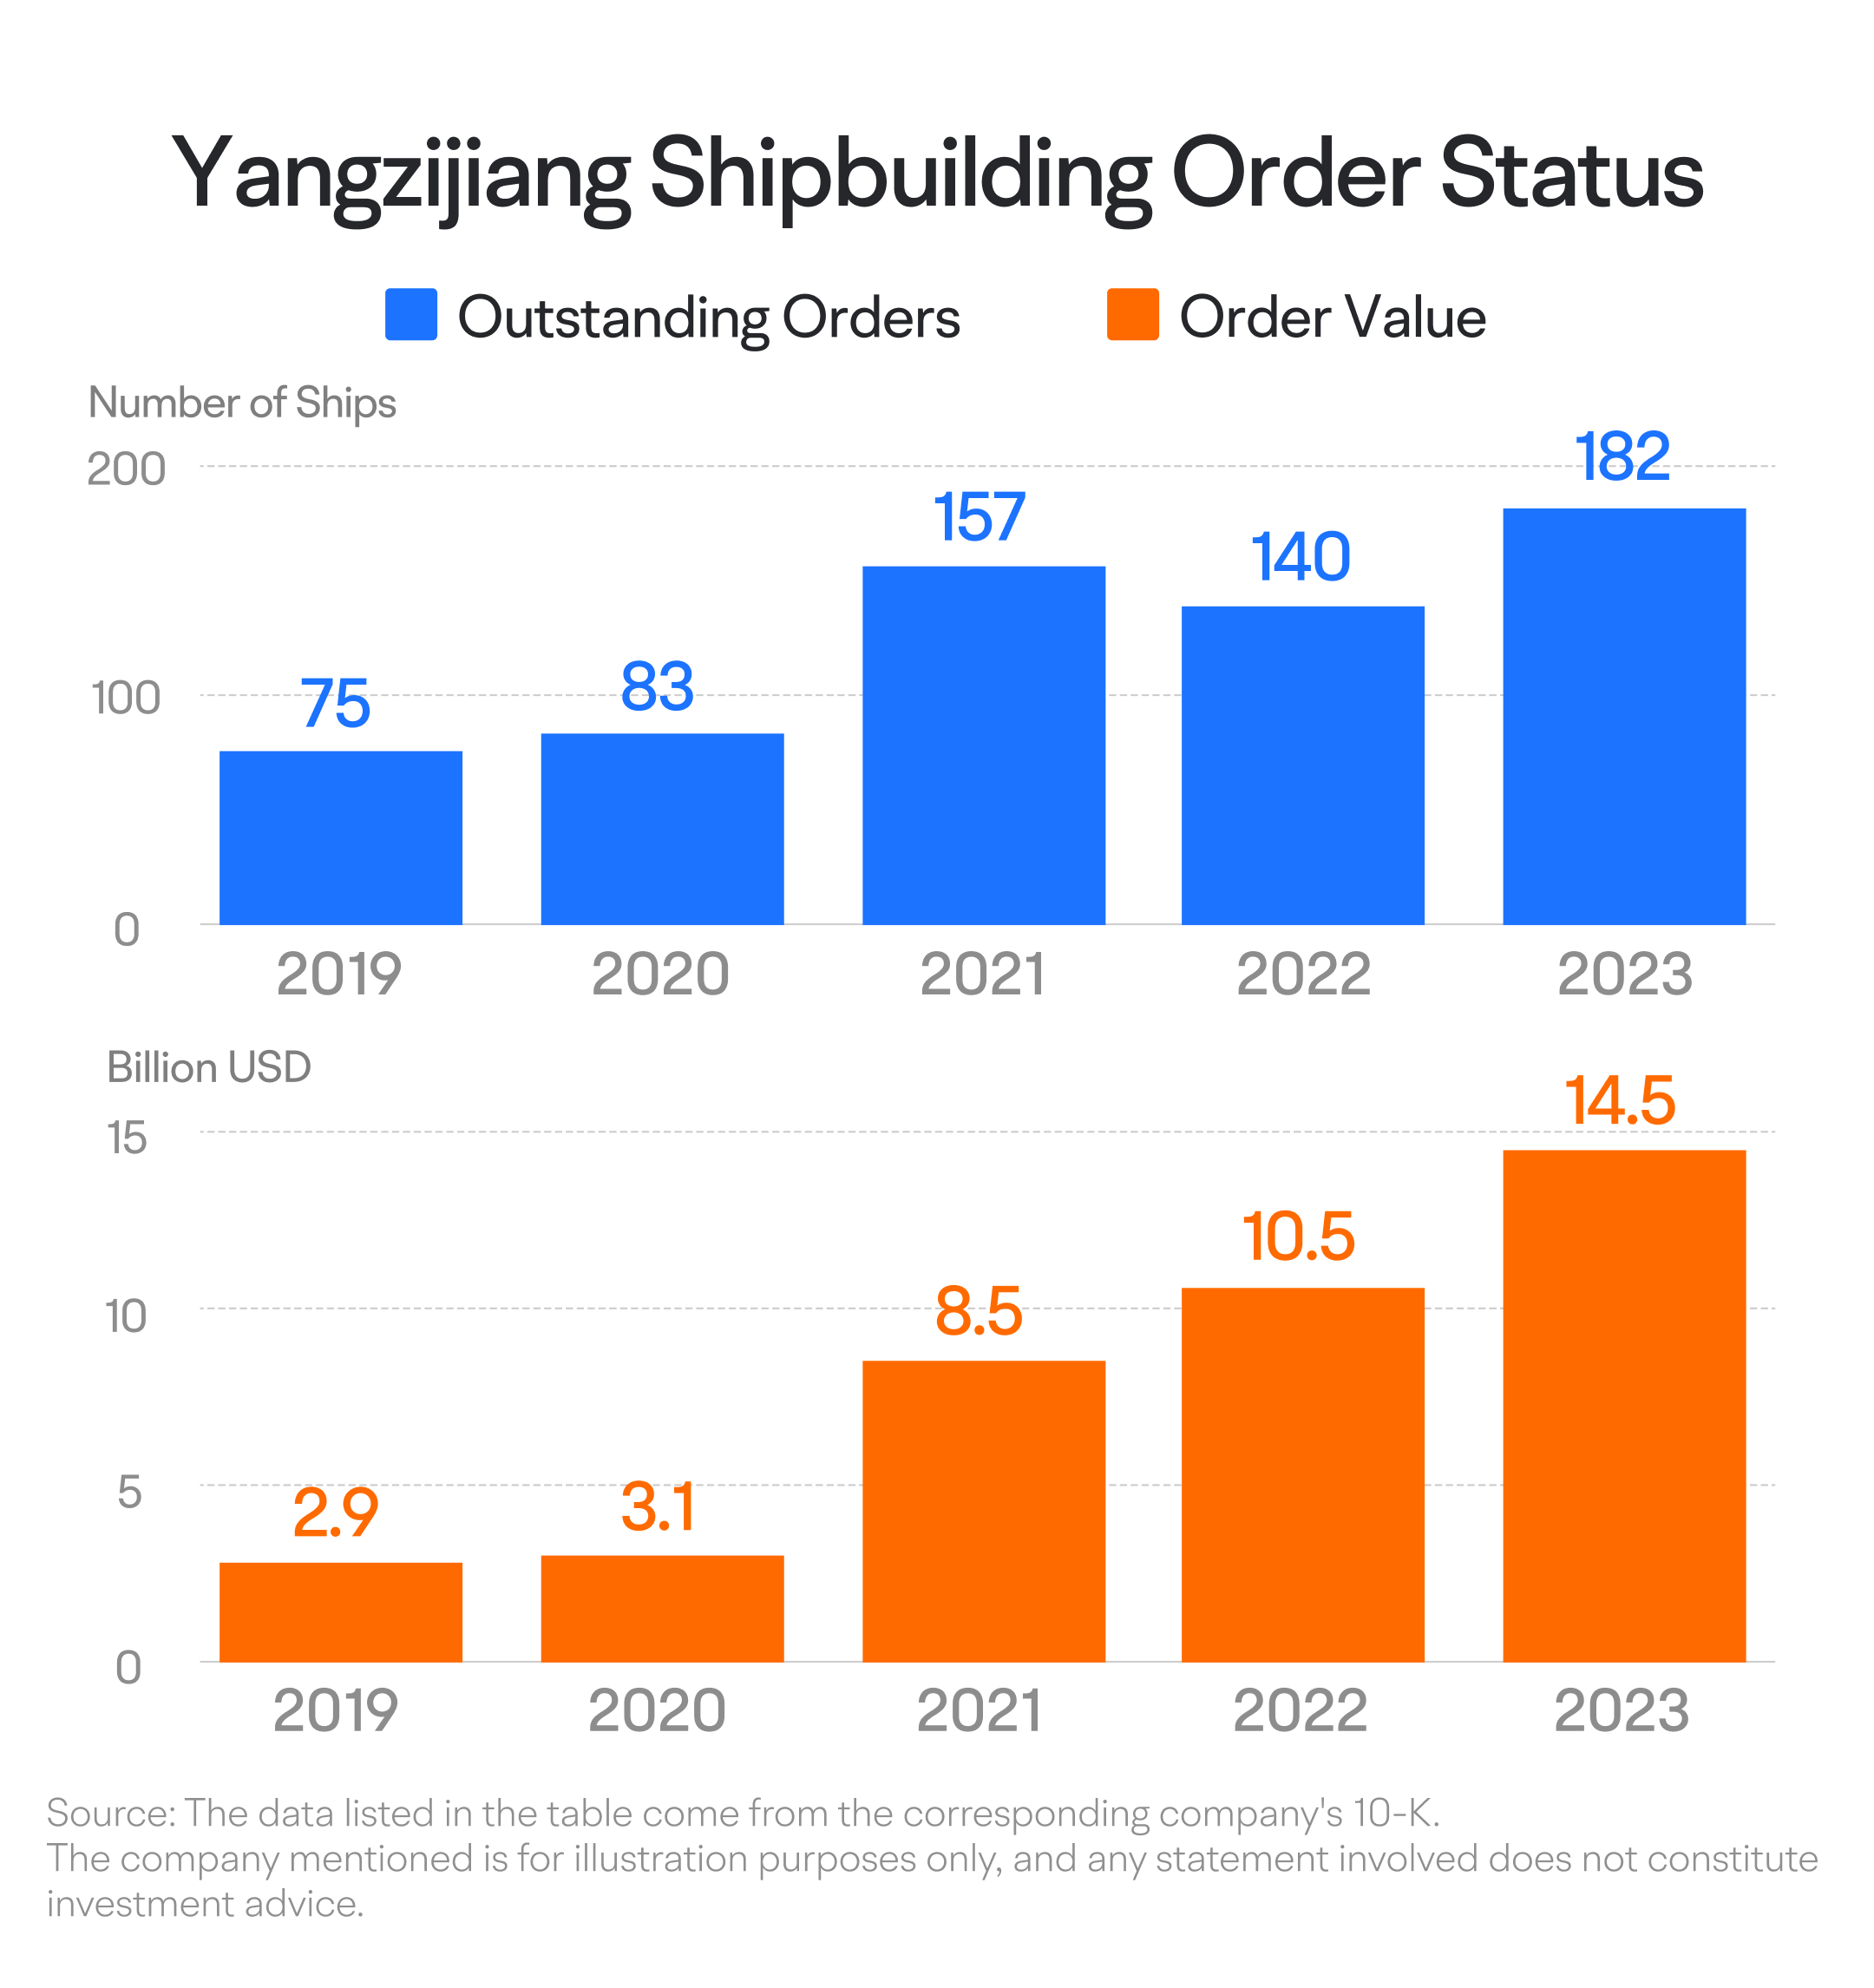
The second key indicator is the number of outstanding orders. Yangzijiang discloses the number and value of its undelivered orders in its financial reports, providing a forward-looking measure of revenue growth. A high volume of outstanding orders may secure future revenue growth.
Over the past five years, Yangzijiang has experienced rapid growth in both order volume and value. The number of orders increased from 75 ships in 2019 to 182 in 2023, more than doubling, while the value of these orders surged from $2.9 billion to $14.5 billion, a fivefold increase. This value exceeds four times its 2023 revenue, indicating solid prospects for future revenue growth.
2. Profitability and financial health
Yangzijiang Shipbuilding has shown impressive revenue growth in recent years, but how do its profitability and financial health stack up?
In terms of profitability, Yangzijiang's gross margin has fluctuated due to industry cycles but generally remains between 15% and 30%. Unlike many cyclical companies that experience extreme highs and lows, Yangzijiang maintains relatively stable margins. Its net margin also follows a similar pattern, ranging between 12% and 25%, well above the industry average with limited volatility.
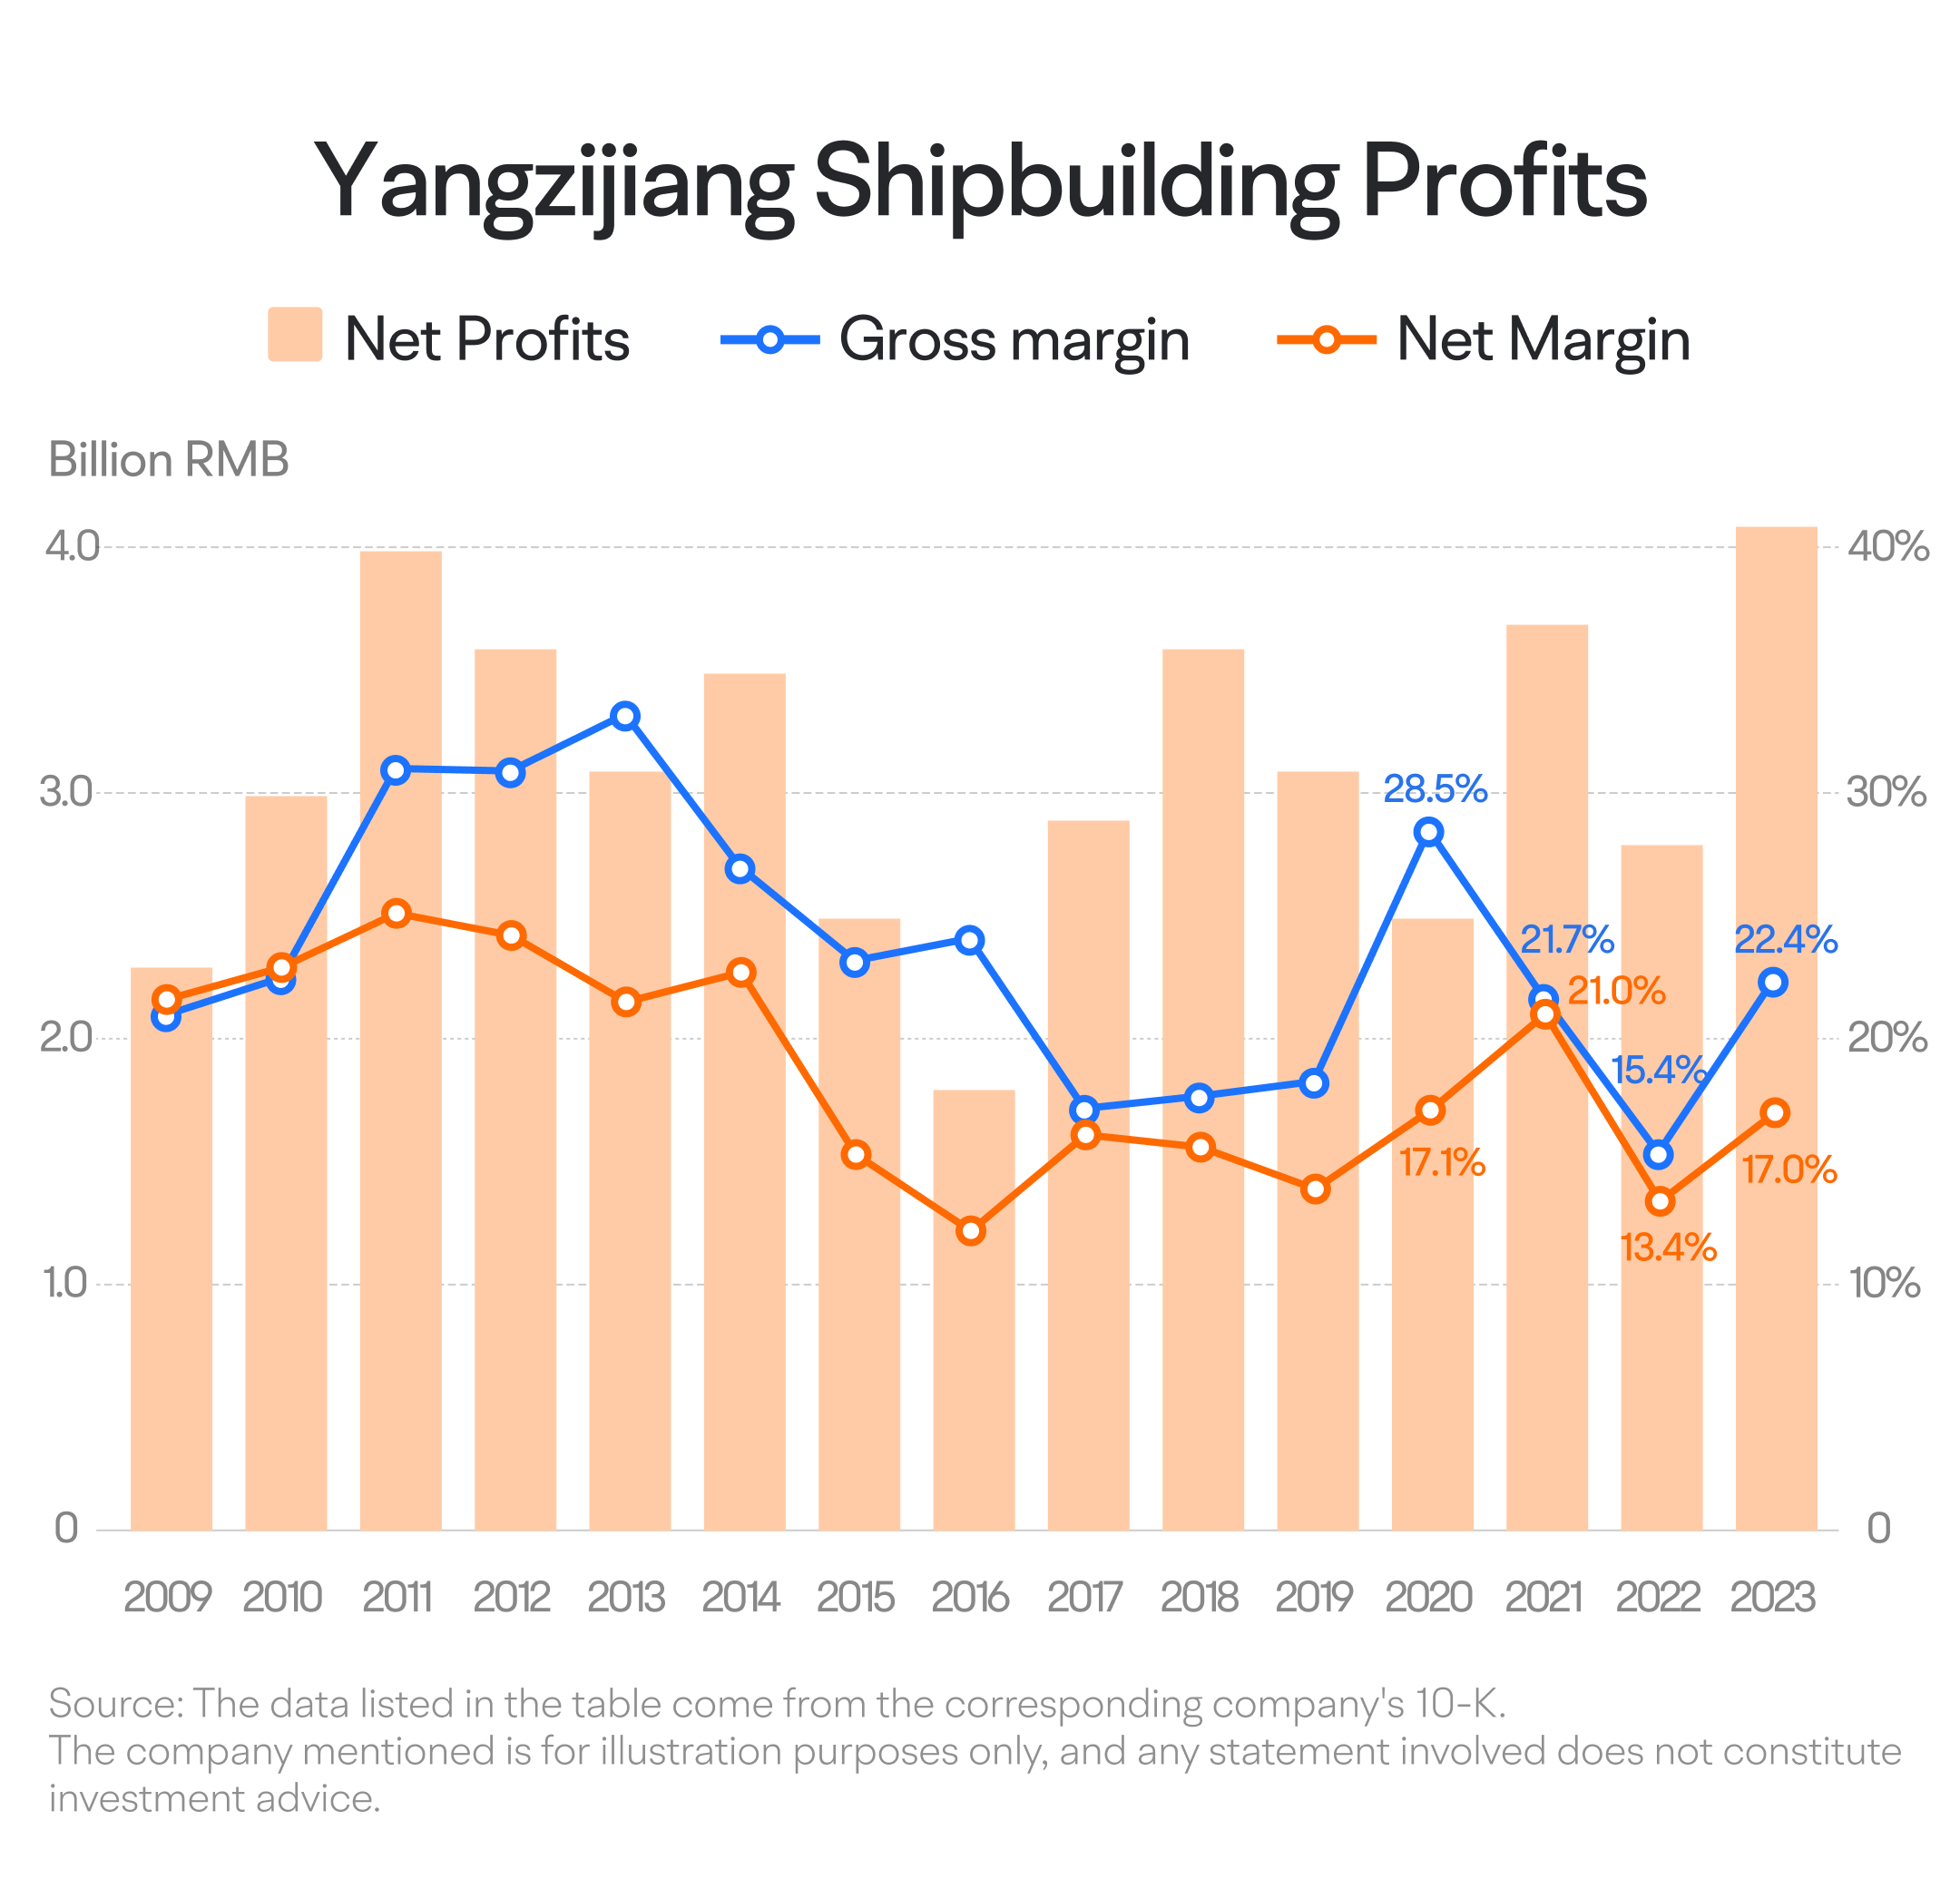
From 2009 to 2023, net profit grew from CNY 2.29 billion to CNY 4.1 billion, despite some fluctuations, consistently exceeding CNY 1.5 billion annually and hitting a new high in 2023. This shows Yangzijiang's resilience against cyclical downturns.
For a capital-intensive manufacturing company, financial health is crucial. Yangzijiang's debt-to-asset ratio was around 48% in 2023, having grown over the past few years but remaining below 50%.
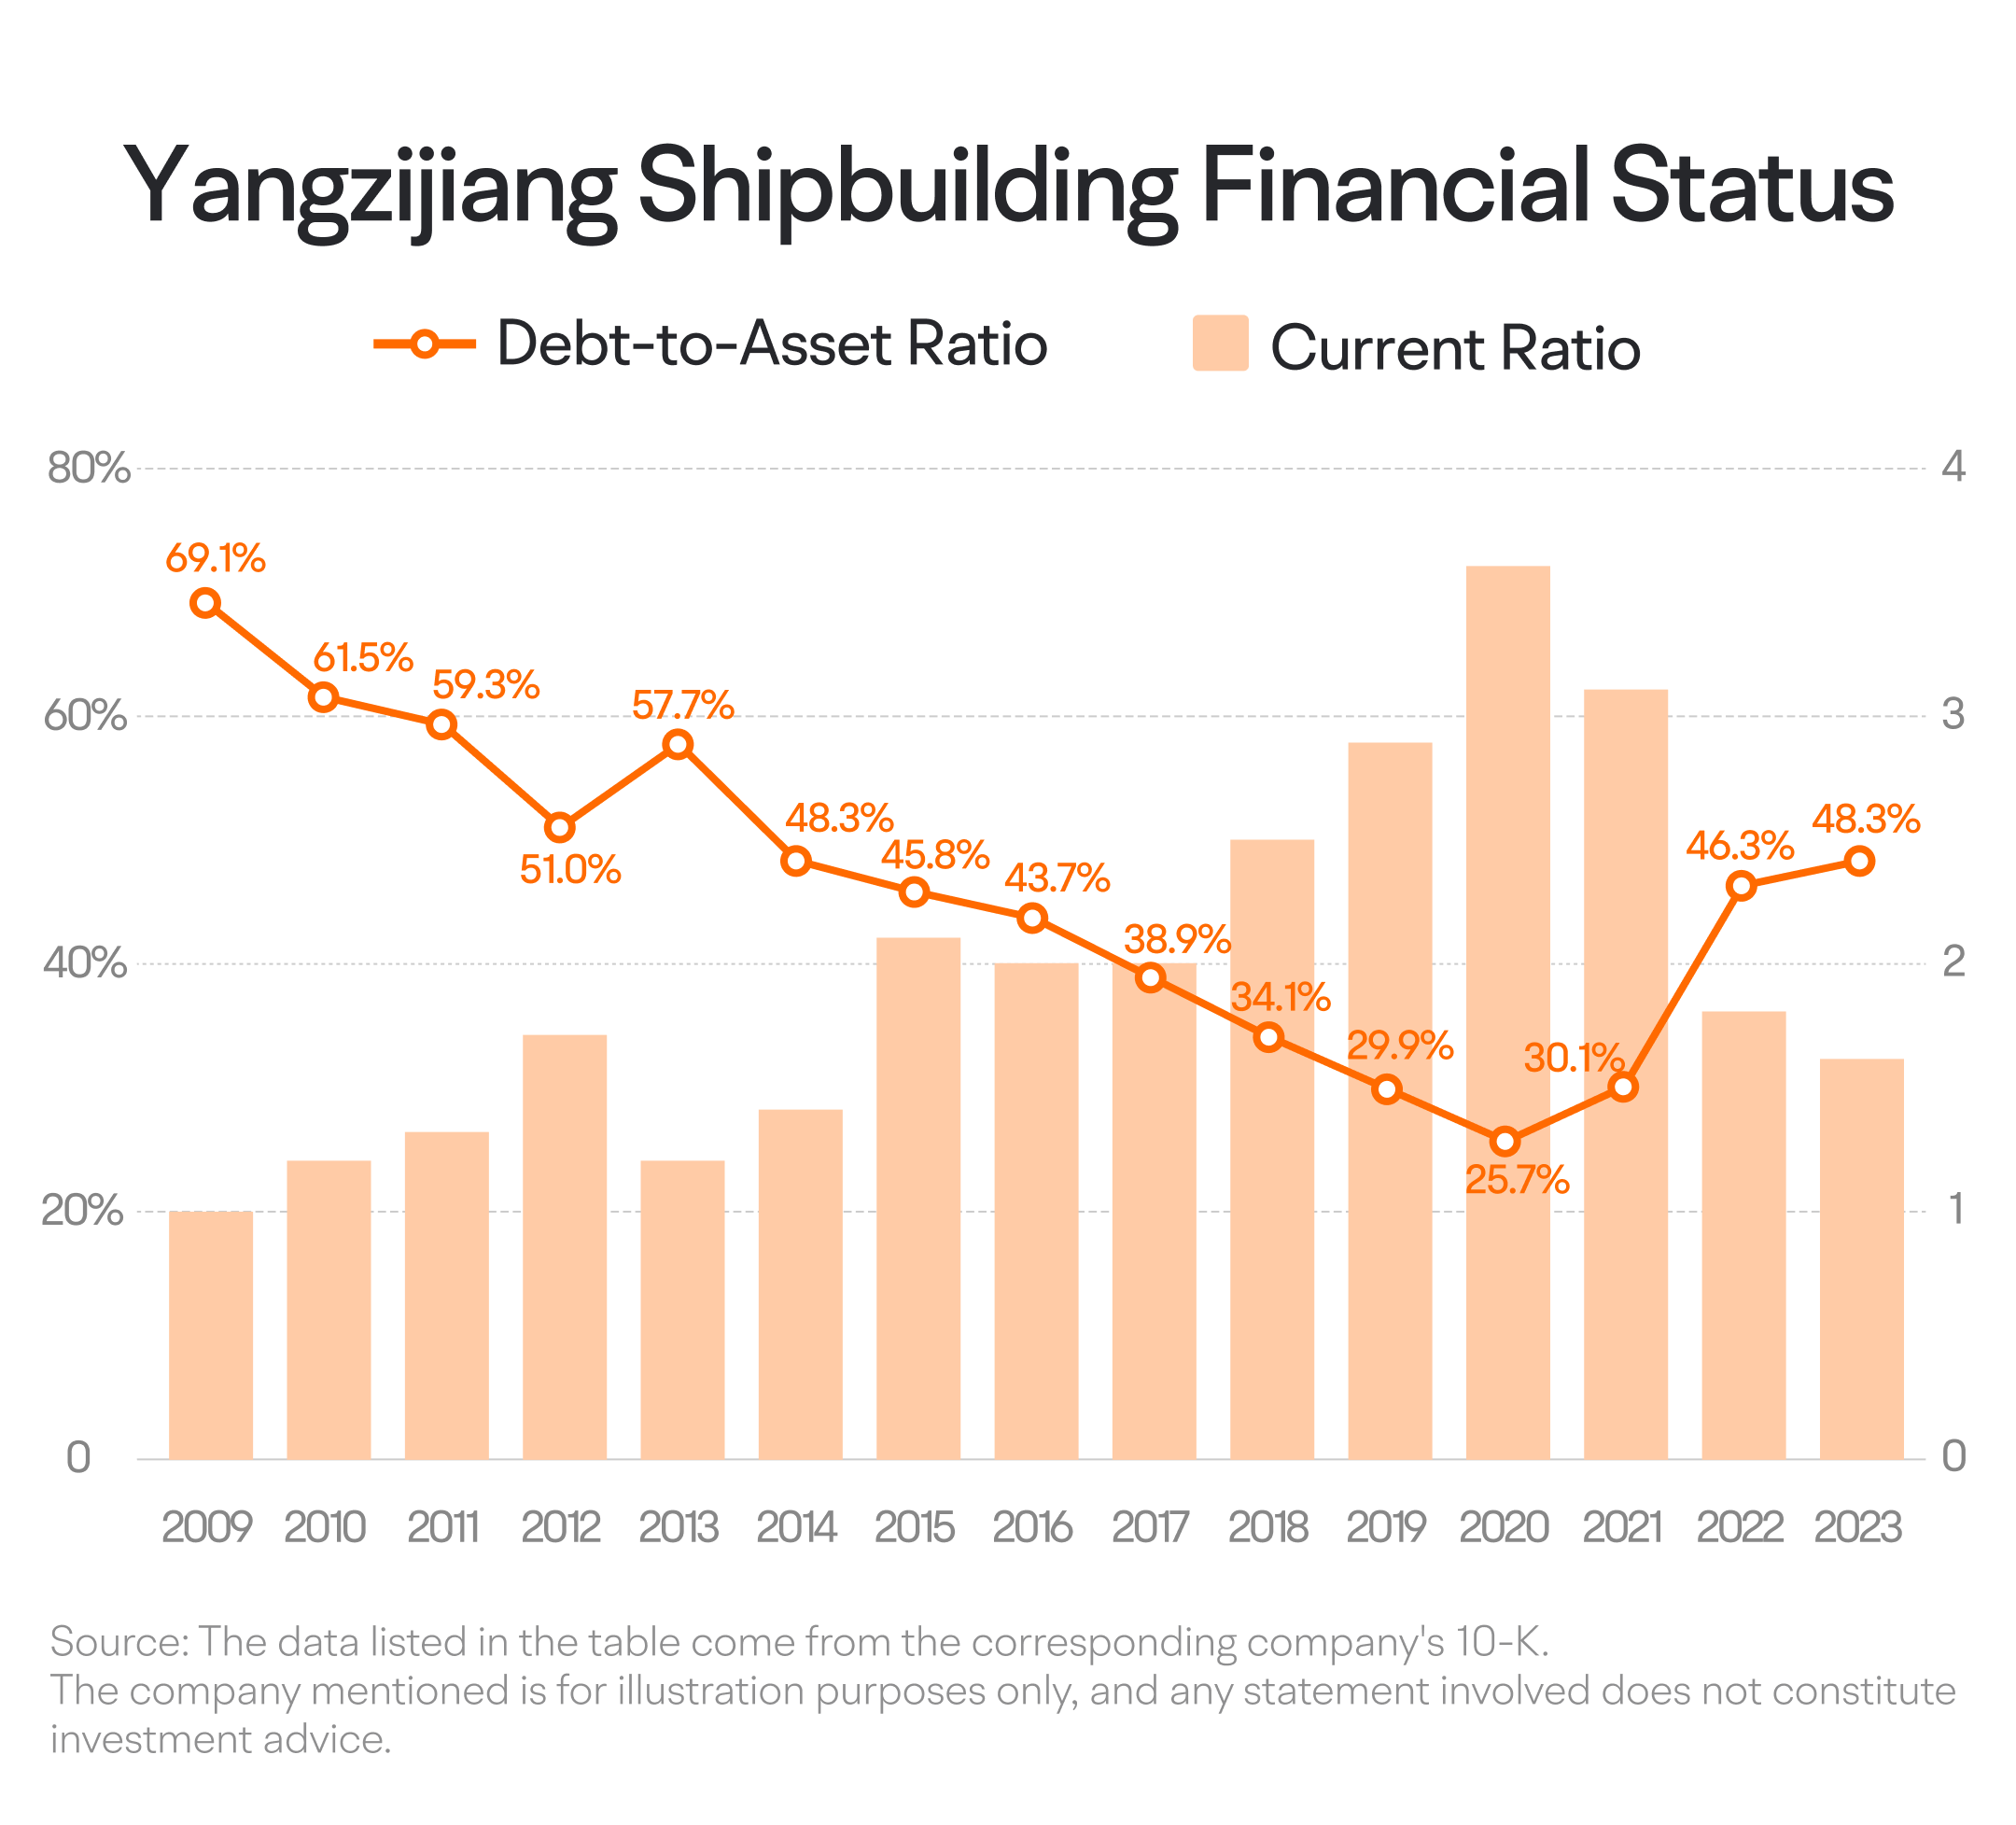
The company’s current ratio stands at about 1.7, which, despite a significant decline in recent years, remains above 1, indicating no immediate liquidity concerns.
Overall, Yangzijiang Shipbuilding's financial position appears stable. Looking forward, we should monitor whether the company can maintain its profitability above industry averages and sustain its financial stability.
3. Cash flow and shareholder returns
For Yangzijiang Shipbuilding, managing cash flow is crucial given the capital-intensive nature of the shipbuilding industry, which requires significant investments to meet order growth and update equipment. Historically, its free cash flow (FCF) has been volatile. For instance, in 2011, the company reported a massive negative FCF of CNY 6.08 billion. However, over the past decade, Yangzijiang's free cash flow has significantly improved. Between 2014 and 2023, it only posted negative FCF in one year, maintaining overall stability. During this period, it accumulated CNY 37.2 billion in free cash flow, surpassing its net profit of approximately CNY 30.5 billion for the same timeframe.
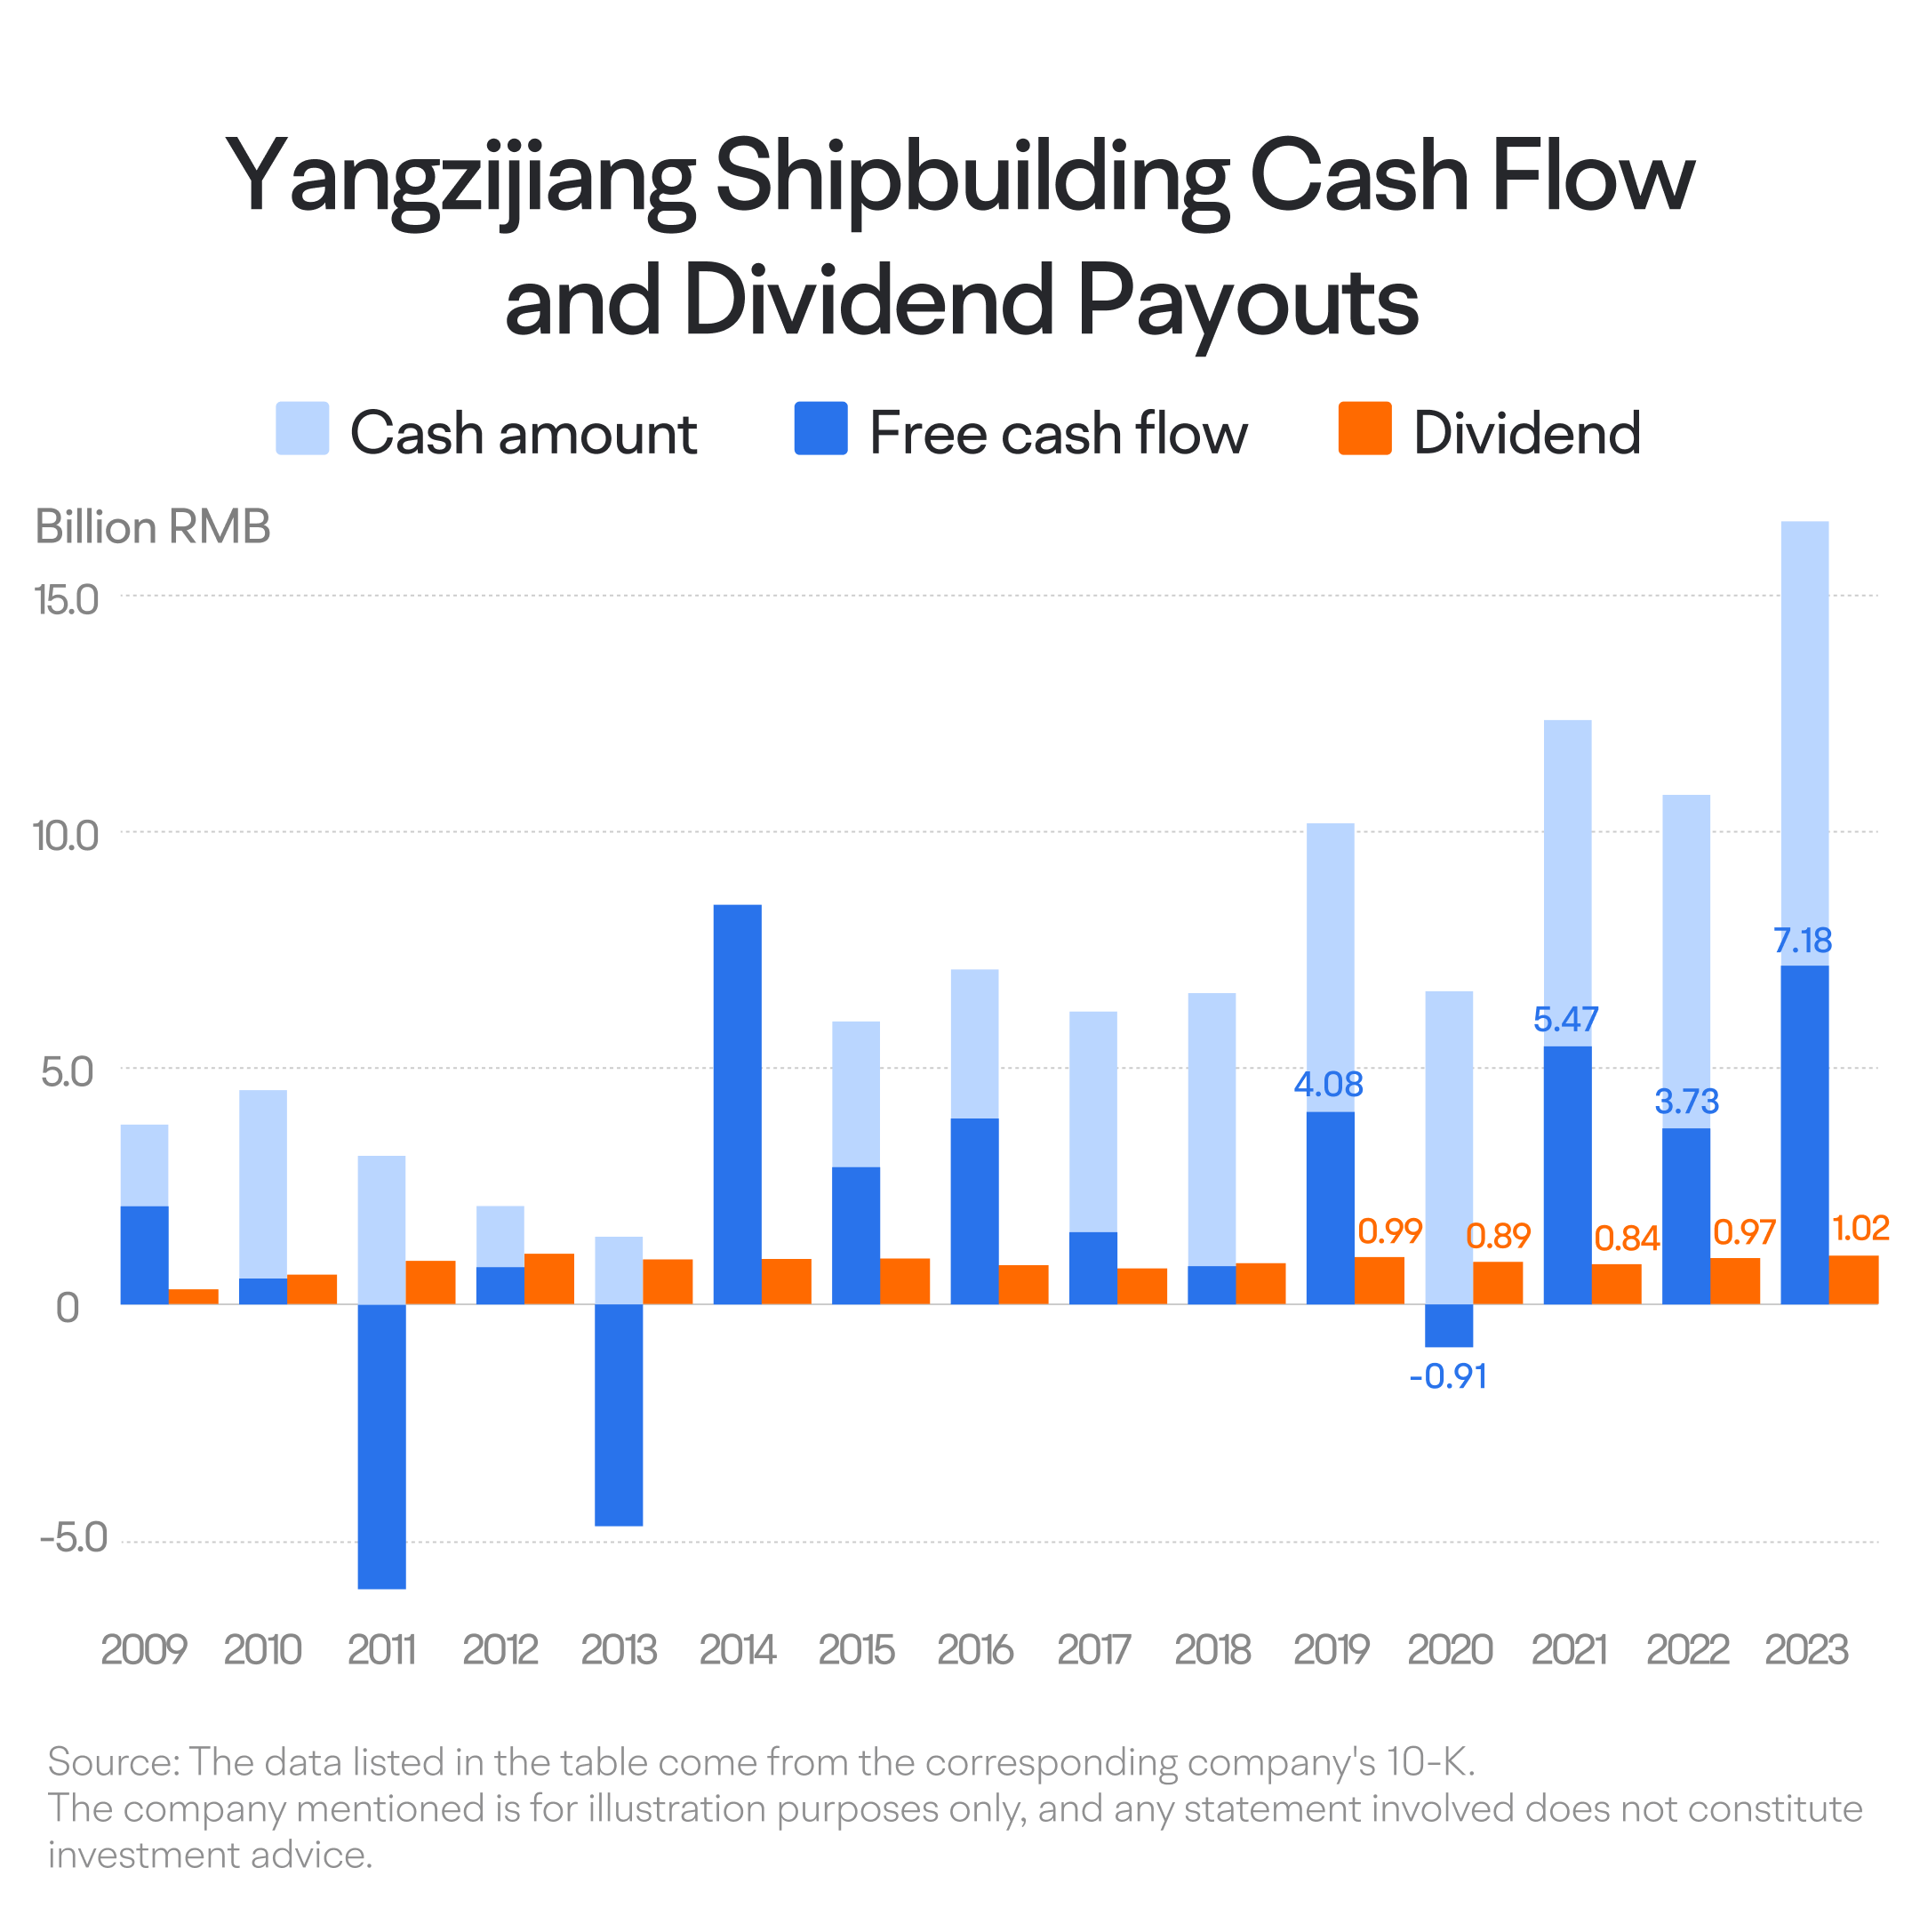
Additionally, its cash reserves have grown substantially, from just over CNY 2 billion in 2012 to CNY 16.7 billion in 2023.
With healthy free cash flow and ample cash reserves, Yangzijiang has consistently rewarded shareholders, primarily through dividends. Over the past decade (2014-2023), the company paid out around CNY 9 billion in dividends, averaging CNY 900 million per year. This represents roughly 30% of its net profit during this period, indicating room for potential increases.
In future financial reports, we can continue to monitor the stability of Yangzijiang's cash flow and whether the company will increase its dividend payout ratio.
Summary
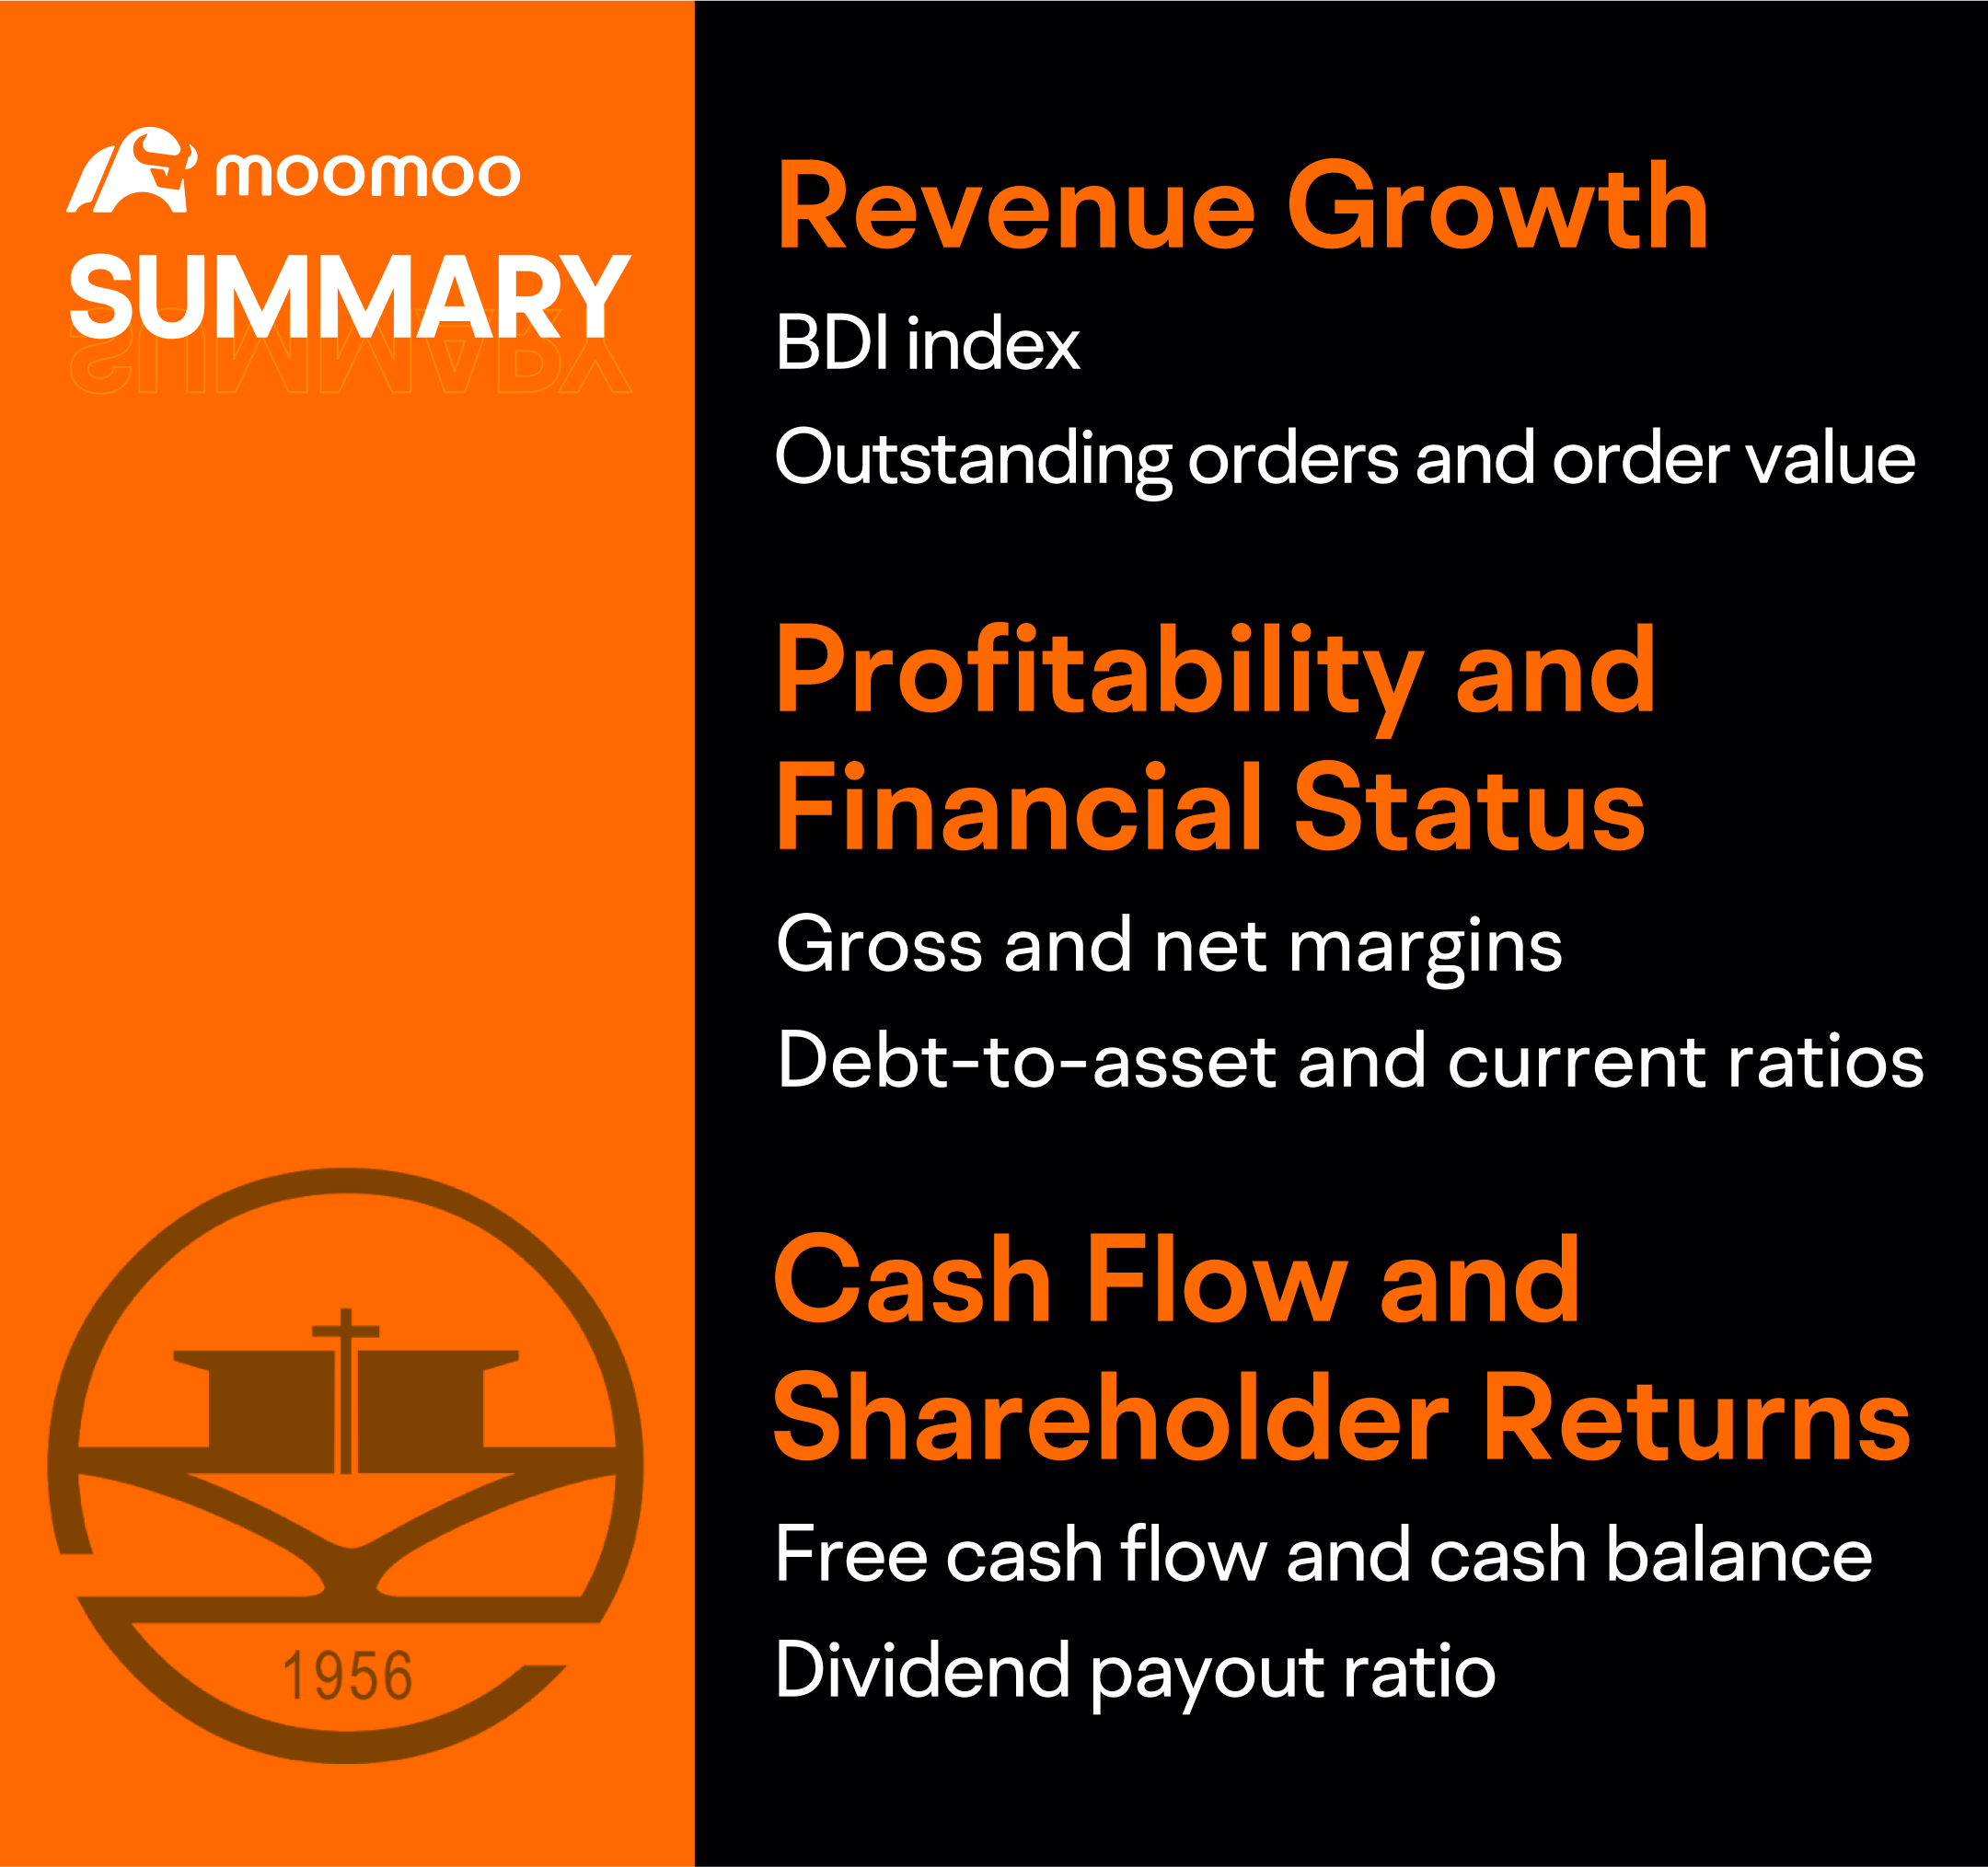
In analyzing Yangzijiang Shipbuilding's financial reports, we should focus on three key areas: revenue growth, profitability and financial health, and shareholder returns.
1. Revenue growth:
· Baltic Dry Index (BDI): Monitor changes in the BDI as it reflects industry health and can influence shipbuilding demand.
· Outstanding Order: Keep an eye on the number and value of undelivered orders, which are strong predictors of future revenue growth.
2. Profitability and financial health:
· Profitability metrics:
· Gross Margin: Assess whether the company maintains a gross profit margin in the 15%-30% range, indicating resilience against industry cycles.
· Net Margin: Ensure the net profit margin remains between 12%-25%, above industry averages.
· Financial stability:
· Debt-to-Asset Ratio: Check if the ratio stays below 50%, indicating manageable debt levels.
· Current Ratio: Ensure this ratio remains above 1, indicating sufficient liquidity.
3. Cash flow and shareholder returns:
· Cash flow:
· Free Cash Flow: Monitor the stability and health of free cash flow, noting any significant improvements or deteriorations.
· Cash Reserves: Track the growth in cash reserves, as ample reserves indicate financial robustness.
· Shareholder returns:
· Dividend Payouts: Watch for any increases in the dividend payout ratio, which would signify enhanced shareholder returns.
This presentation is for informational and educational use only and is not a recommendation or endorsement of any particular investment or investment strategy. Investment information provided in this content is general in nature, strictly for illustrative purposes, and may not be appropriate for all investors. Read more