How to Identify Three White Soldiers

If you spot three consecutive rising candles on a stock price chart, it could be a sign that the trend is about to reverse.
This particular candlestick pattern has a unique name: three white soldiers.
In this article, we'll take a closer look at this pattern and help you identify it on a candlestick chart.
What is a three white soldiers pattern?
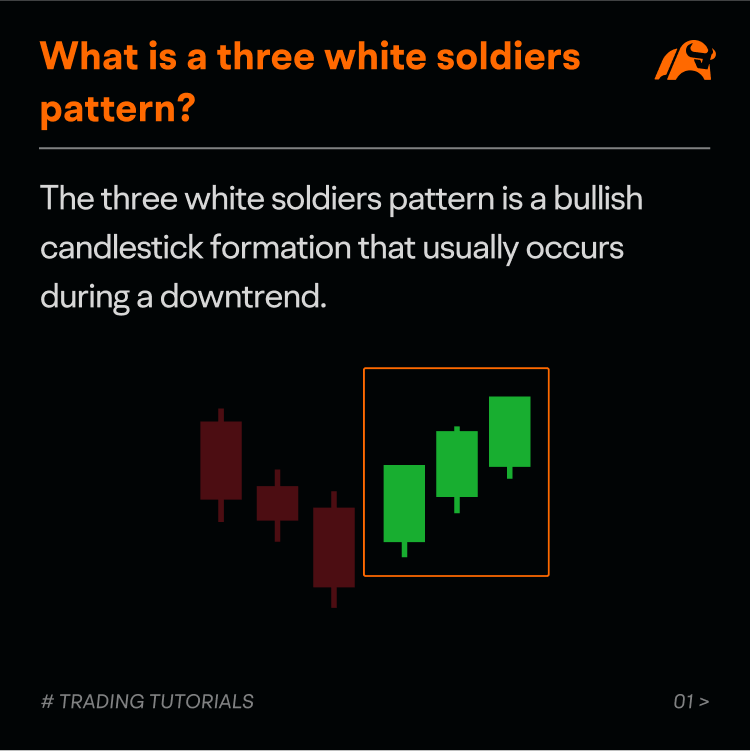
The three white soldiers pattern is a bullish candlestick formation that usually occurs during a downtrend.
As the name suggests, the pattern consists of three consecutive bullish candles (white or green) with each having a higher close than the previous one.
The pattern usually indicates a weakness in an established downtrend and the potential emergence of an uptrend.
How does a three white soldiers pattern occur?
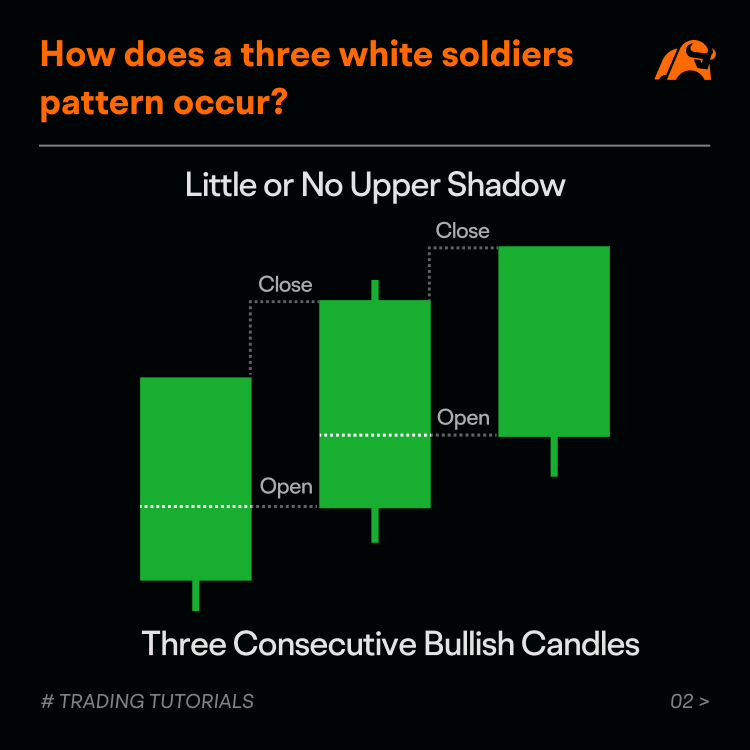
A standard three white soldiers pattern usually has these features:
There must be three bullish (white or green) candlesticks in a row. Ideally, the candles' bodies should be similar in size.
Ideally, each candle should open within the previous candle's body.
Each candle has a higher close than the previous day's close, creating a staircase-like structure as the price climbs higher and higher.
Each candle closes at or near its high. Thus, the candles should have very small or no upper shadows or wicks.
When the three white soldiers pattern appears after a downtrend, it may indicate the selling sentiment is fading.
Some experienced traders may consider opening a long position seeking to profit from any upward movement. However, it's important to use other indicators to confirm the potential trend reversal.
In addition, the three white soldiers pattern can also occur during a consolidation period. In such cases, it may suggest that the upward trend is likely to continue rather than reverse.
How to identify a three white soldiers pattern?
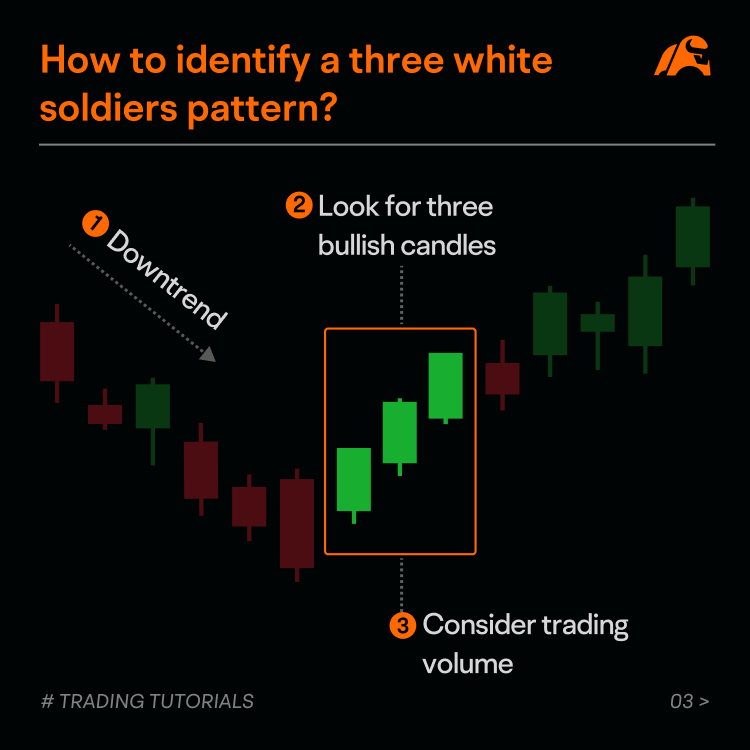
The following steps may help you identify the three white soldiers pattern as a signal for trend reversal:
Confirm the downtrend: Look for a clear downward trend before the pattern appears. This establishes the context for a potential reversal.
Look for three bullish candles: In the current downtrend, observe three consecutive bullish candles. These candles should have similar sizes, and each candle should ideally open within the previous candle's body and close near its own high. It suggests a strong buying sentiment and a potential shift in market sentiment.
Consider volume: Higher trading volume during the formation of the pattern can strengthen its validity, though it is not a required condition. Increased volume signals greater market participation and typically reinforces the bullish sentiment of the pattern.
It is worth noting that if the third candle is smaller (or shorter) than the first two candles or has a long upper shadow, you should exercise caution as it may suggest the bullish momentum is not strong enough to reverse the overall trend.
In some cases, there is a short period of consolidation following the three white soldiers pattern, but the short-term and intermediate-term bias may remain bullish.
Case study
The chart below shows a three white soldiers pattern on the daily price chart of Caterpillar Inc. (CAT) stock.
Before the appearance of the pattern, the stock price had been on a noticeable decline, indicating strong selling sentiment.
In the downtrend, three consecutive bullish candles emerged. Each candle opened within the previous candle's body and closed near its high, indicating that the buyers could be taking control and a potential reversal may occur.
After the appearance of the pattern, Caterpillar's stock price did experience a modest upward movement.

Summary
The three white soldiers is a bullish pattern formed with three consecutive bullish candles appearing during a downtrend. Some bullish traders may consider using this pattern to help identify potential entry points.
However, it's important to remember that the pattern is not always guaranteed to be successful and can produce false signals.
When trading candlestick patterns, it is important to factor in other technical methods.
Additional Disclaimer:
This presentation discusses technical analysis. Other approaches, including fundamental analysis, may offer very different views. The examples provided are for illustrative and educational purposes only and are not intended to be reflective of the results you can expect to achieve.
This presentation is for informational and educational use only and is not a recommendation or endorsement of any particular investment or investment strategy. Investment information provided in this content is general in nature, strictly for illustrative purposes, and may not be appropriate for all investors. Read more