What is the PEG Ratio?
Key Takeaways
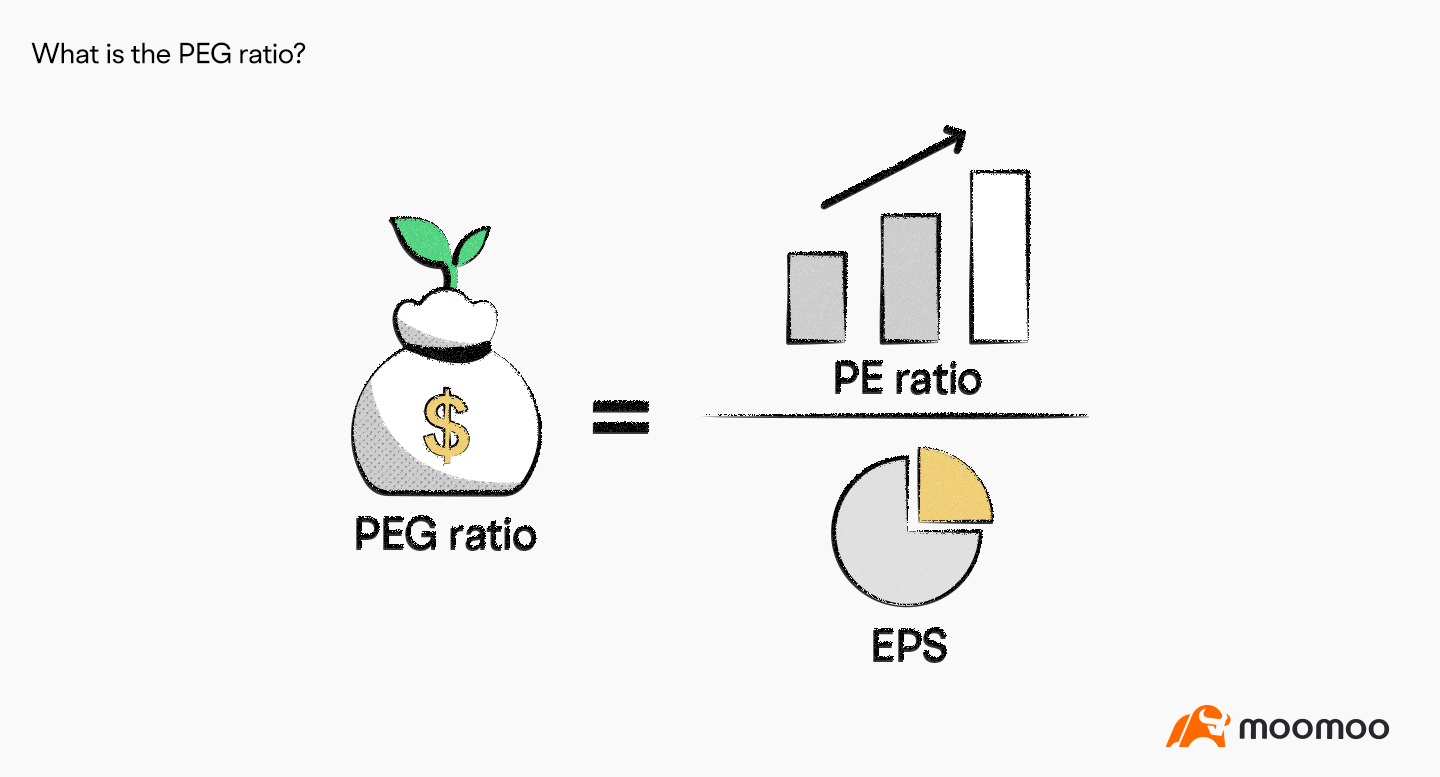
The Price/Earnings-to-Growth(PEG) ratio is a stock's price/earnings(PE) ratio divided by the growth rate of its earnings.
The PEG ratio is more comprehensive as a stock evaluation measure than the PE ratio because it also considers the growth rate.
In theory, a PEG ratio value of 1 represents a good correlation between the company's market value and its projected earnings growth.
Understanding the PEG ratio
The PEG ratio is a company’s price/earnings ratio divided by its earnings growth rate over a period of time (typically 1 to 3 years). By accounting for the expected future growth rate in earnings per share, the PEG ratio modifies the conventional P/E ratio. The PEG ratio formula is as follows:

How to Interpret the PEG Ratio
The PEG ratio was originally developed by Mario Farina who wrote about it in his 1969 Book, A Beginner's Guide To Successful Investing In The Stock Market. It was later popularized by Peter Lynch, who wrote in his 1989 book One Up on Wall Street that, "the P/E ratio of any company that's fairly priced will equal its growth rate", that is, a fairly valued company will have its PEG equal to 1. When a company's PEG exceeds 1, it's considered overvalued while a stock with a PEG of less than 1 is considered undervalued.
While a low P/E ratio may suggest that a stock is a smart investment, the PEG ratio, which takes into account the company's growth rate, may provide a different picture. Given the business's expected future earnings, the lower the PEG ratio, the more inexpensive the stock may be. Companies with high growth rates and high P/E ratios can have their results adjusted by factoring in predicted growth for the company.
Limitations
There are a few things to consider when employing the PEG ratio as part of your stock analysis. The PEG ratio makes assumptions that may or may not be true. It is impossible to predict when a company's growth will slow down or accelerate.
Additionally, the PEG ratio does not account for other factors that could raise or lower a company's value. As an illustration, the PEG ratio ignores the clear value that some growth companies add when they maintain large amounts of capital on their balance sheet.
Finally, exercise caution when using the PEG ratio to analyze value stocks or slower-growing businesses. A company's PEG ratio of 3.0 may seem costly if it trades for 15 times earnings and has consistently grown by 5 percent annually for decades. However, for investors looking for security and stability, this company may still represent a reasonable value given its solid history of steady development.
This presentation is for informational and educational use only and is not a recommendation or endorsement of any particular investment or investment strategy. Investment information provided in this content is general in nature, strictly for illustrative purposes, and may not be appropriate for all investors. Read more
Recommend

What is the Equity Ratio?

What is a Stock Split?

What is a Golden Cross?

What is a 401(k)?
What is Net Worth?
What is Net Income?
What is Volume-Weighted Average Price (VWAP)?
What is Opportunity Cost?
What is the KDJ?
What is After-hour Trading?
What is a Delisting?
What is the OBV?
What is the Dead Cat Bounce?
What are Support and Resistance?
What is a block trade?
What is the PEG Ratio?
What is a Trailing Stop Limit Order?
What is Scalp Trading?
What is a Share Repurchase?
What is the rate of change?
What is Return on Equity (ROE)?
What is the Relative Strength Index (RSI)?
What are Bollinger Bands?
What is Free Cash Flow to Firm(FCFF)?
What is the Quick Ratio?
What is a Sunk Cost?
What is Momentum Trading?
What are the Safe-haven Assets?
What is Gross Margin?
What is Short Selling?
What is Book Value per Share (BVPS)?
What is the Risk/Reward Ratio?
What is Margin Trading?
What is Capitulation?
What is PE ratio?
What is the Short Squeeze?
What Is a Dividend?
What is Return on Assets (ROA)?
What is a SPAC?
What is the Current Ratio?
What is the Equity Ratio?
What is a Stock Split?
What is a Golden Cross?
What is a 401(k)?
What is Net Worth?
What is Net Income?
What is Volume-Weighted Average Price (VWAP)?
What is Opportunity Cost?
What is the KDJ?
What is After-hour Trading?
What is a Delisting?
What is the OBV?
What is the Dead Cat Bounce?
What are Support and Resistance?
What is a block trade?
What is the PEG Ratio?
What is a Trailing Stop Limit Order?
What is Scalp Trading?
What is a Share Repurchase?
What is the rate of change?
What is Return on Equity (ROE)?
What is the Relative Strength Index (RSI)?
What are Bollinger Bands?
What is Free Cash Flow to Firm(FCFF)?
What is the Quick Ratio?
What is a Sunk Cost?
What is Momentum Trading?
What are the Safe-haven Assets?
What is Gross Margin?
What is Short Selling?
What is Book Value per Share (BVPS)?
What is the Risk/Reward Ratio?
What is Margin Trading?
What is Capitulation?
What is PE ratio?
What is the Short Squeeze?
What Is a Dividend?
What is Return on Assets (ROA)?
What is a SPAC?
What is the Current Ratio?