What is the OBV?
Key Takeaways
● Traders can use the OBV, a volume indicator, to anticipate price moves.
● Volume is added into the OBV on up days and subtracted from the indicator on down days.
● This indicator tells traders whether there is a divergence between the stock price and the volume.
Understanding
The On-balance volume (OBV) is a technical momentum indicator that measures trading volume.
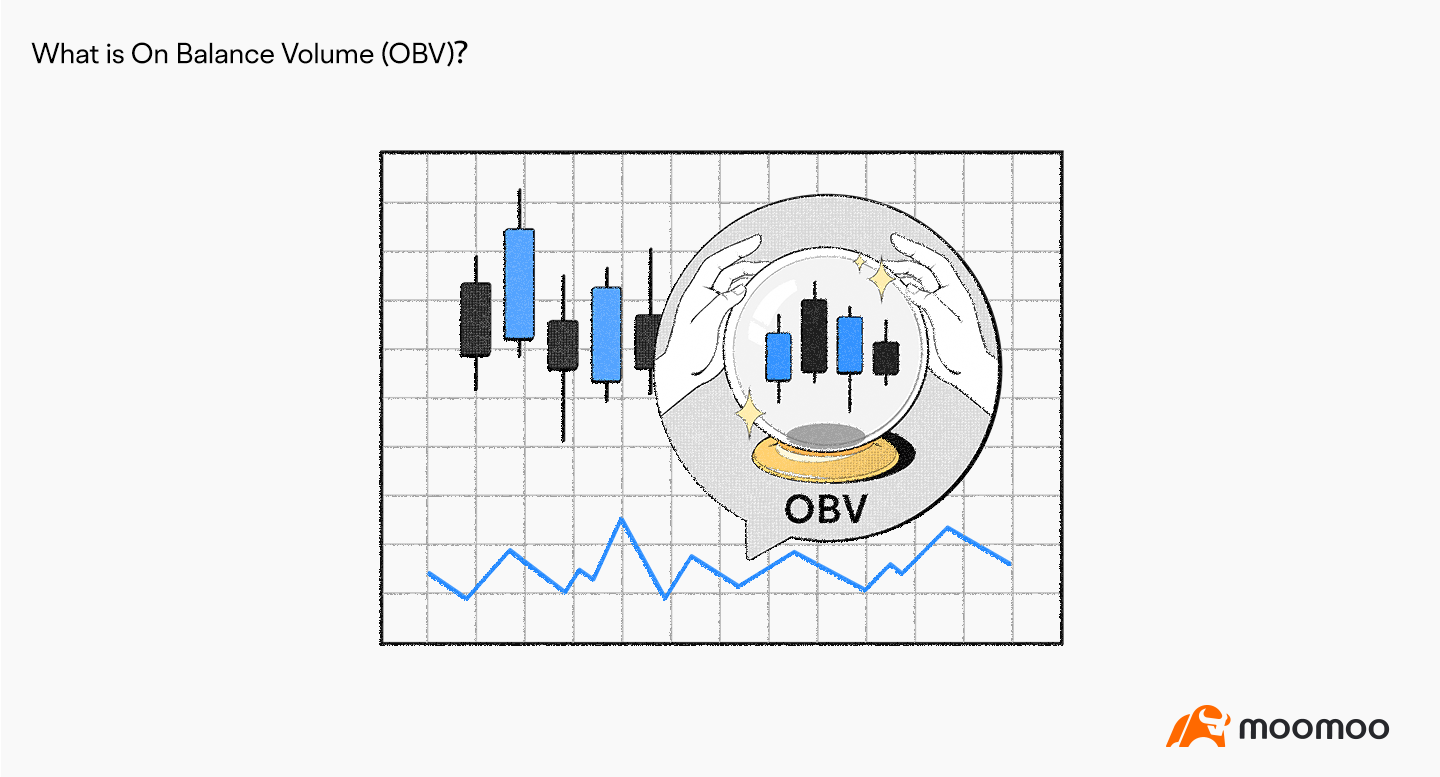
Combined with the candlestick chart, OBV can be used to predict major market moves.
Calculating OBV
The OBV is a cumulative total of a security's trading volume, adding volume on up days and subtracting volume on down days.
The calculation follows three rules:

How to use OBV
The bulls may have gathered strong momentum if the OBV indicator has been trading sideways for over three months.
When the OBV makes an upward breakout, it may signal a rising trend.
When the stock price falls, and the OBV rises, a positive divergence is formed, signaling an upward move in the stock price.
When the stock price rises, and the OBV falls, a negative divergence occurs, signaling a downward move in the stock price.
When both stock price and OBV are making higher highs, the uptrend is likely to continue.
When both stock price and OBV are making lower lows, the downtrend is likely to persist.
The Bottom Line
The price-volume relation serves as a window on the stock market trends.
The OBV indicates whether the trading volume can validate price actions. But remember that the indicator only tracks the trading volume.
If momentum is suddenly affected by other factors, the OBV's effectiveness might be compromised.
This presentation is for informational and educational use only and is not a recommendation or endorsement of any particular investment or investment strategy. Investment information provided in this content is general in nature, strictly for illustrative purposes, and may not be appropriate for all investors. Read more
Recommend

What is the Equity Ratio?

What is a Stock Split?

What is a Golden Cross?

What is a 401(k)?
What is Net Worth?
What is Net Income?
What is Volume-Weighted Average Price (VWAP)?
What is Opportunity Cost?
What is the KDJ?
What is After-hour Trading?
What is a Delisting?
What is the OBV?
What is the Dead Cat Bounce?
What are Support and Resistance?
What is a block trade?
What is the PEG Ratio?
What is a Trailing Stop Limit Order?
What is Scalp Trading?
What is a Share Repurchase?
What is the rate of change?
What is Return on Equity (ROE)?
What is the Relative Strength Index (RSI)?
What are Bollinger Bands?
What is Free Cash Flow to Firm(FCFF)?
What is the Quick Ratio?
What is a Sunk Cost?
What is Momentum Trading?
What are the Safe-haven Assets?
What is Gross Margin?
What is Short Selling?
What is Book Value per Share (BVPS)?
What is the Risk/Reward Ratio?
What is Margin Trading?
What is Capitulation?
What is PE ratio?
What is the Short Squeeze?
What Is a Dividend?
What is Return on Assets (ROA)?
What is a SPAC?
What is the Current Ratio?
What is the Equity Ratio?
What is a Stock Split?
What is a Golden Cross?
What is a 401(k)?
What is Net Worth?
What is Net Income?
What is Volume-Weighted Average Price (VWAP)?
What is Opportunity Cost?
What is the KDJ?
What is After-hour Trading?
What is a Delisting?
What is the OBV?
What is the Dead Cat Bounce?
What are Support and Resistance?
What is a block trade?
What is the PEG Ratio?
What is a Trailing Stop Limit Order?
What is Scalp Trading?
What is a Share Repurchase?
What is the rate of change?
What is Return on Equity (ROE)?
What is the Relative Strength Index (RSI)?
What are Bollinger Bands?
What is Free Cash Flow to Firm(FCFF)?
What is the Quick Ratio?
What is a Sunk Cost?
What is Momentum Trading?
What are the Safe-haven Assets?
What is Gross Margin?
What is Short Selling?
What is Book Value per Share (BVPS)?
What is the Risk/Reward Ratio?
What is Margin Trading?
What is Capitulation?
What is PE ratio?
What is the Short Squeeze?
What Is a Dividend?
What is Return on Assets (ROA)?
What is a SPAC?
What is the Current Ratio?