What is Return on Assets (ROA)?
Key Takeaways
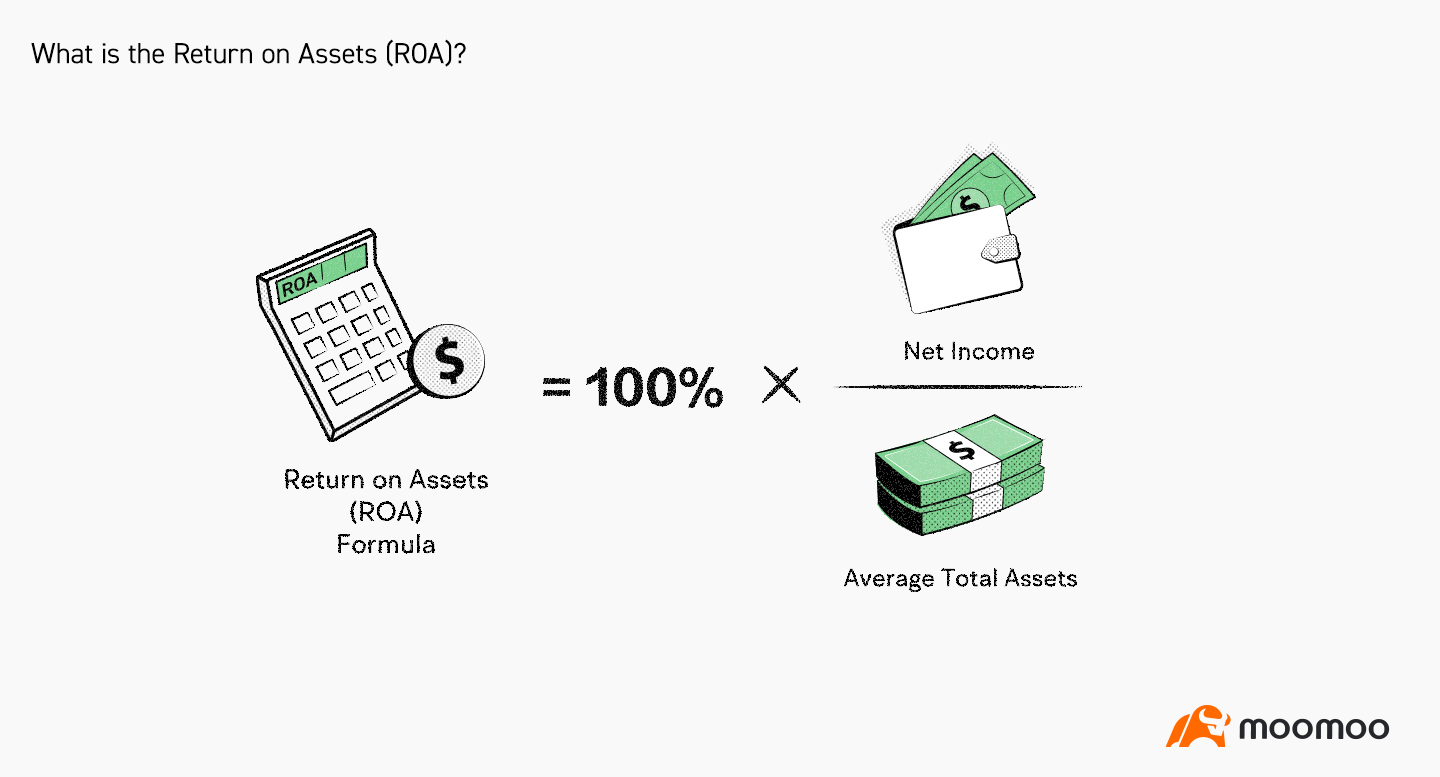
A company's Return on Assets (ROA) is a financial ratio calculated by dividing a firm's net income by its average total assets.
ROA can be used to determine how efficiently a company utilizes its assets to generate profit.
ROA should not be used across industries since companies in one industry have different asset bases from those in another.
Understanding Return on Assets (ROA)
The term Return on Assets (ROA) refers to a financial ratio that indicates how profitable a company is in relation to its total assets.
ROA is calculated by dividing a firm's net income by its average total assets during a period of time (usually in one year). It is generally presented as a percentage.
The formula is:

where,
(Average total assets are used in calculating ROA because a company's assets can vary over time due to the purchase or sale of vehicles, land, equipment, inventory changes, or seasonal sales fluctuations. )
Corporate management, analysts, and investors can use ROA to determine how effective it is for the company to convert resources into net profit.
The higher the ROA number, the better because the company can earn more money with a smaller investment. Put it simply: a higher ROA means more asset efficiency.
Investors can use ROA to find opportunities in the stock market. A ROA that rises over time indicates the company is doing well at generating profits with its investment. On the other hand, if the company has over-invested in resources that have failed to produce revenue growth, its ROA may be falling.
ROA for public companies can vary substantially and are highly dependent on their industries, so the ROA for a tech company won't necessarily correspond to that of a food and beverage company.
This is why it is better to compare a company's ROA against its previous figures or a similar company's ROA.
Example of Return on Assets (ROA)
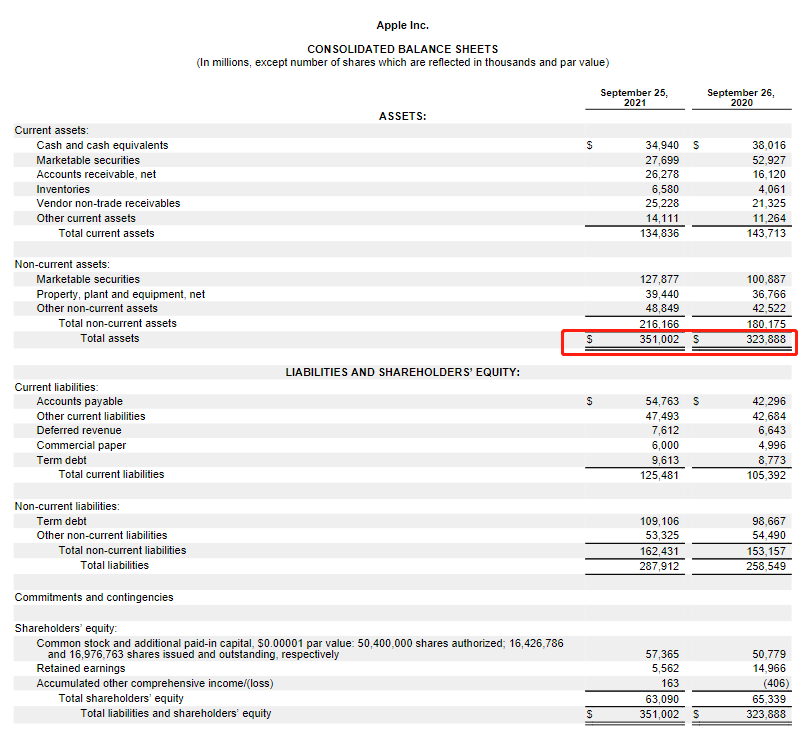
The chart below is the balance sheet from $Apple (null)$ 10K statement showing the company's total assets at the end of the fiscal years ended September 26, 2020, and September 25, 2021.
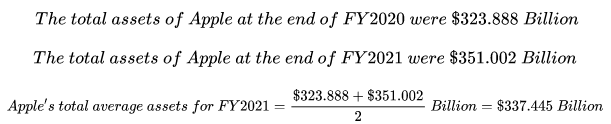
Below is the income statement for the fiscal year 2021 (for the year ended September 25, 2021) for $Apple (null)$ according to its 10K statement:
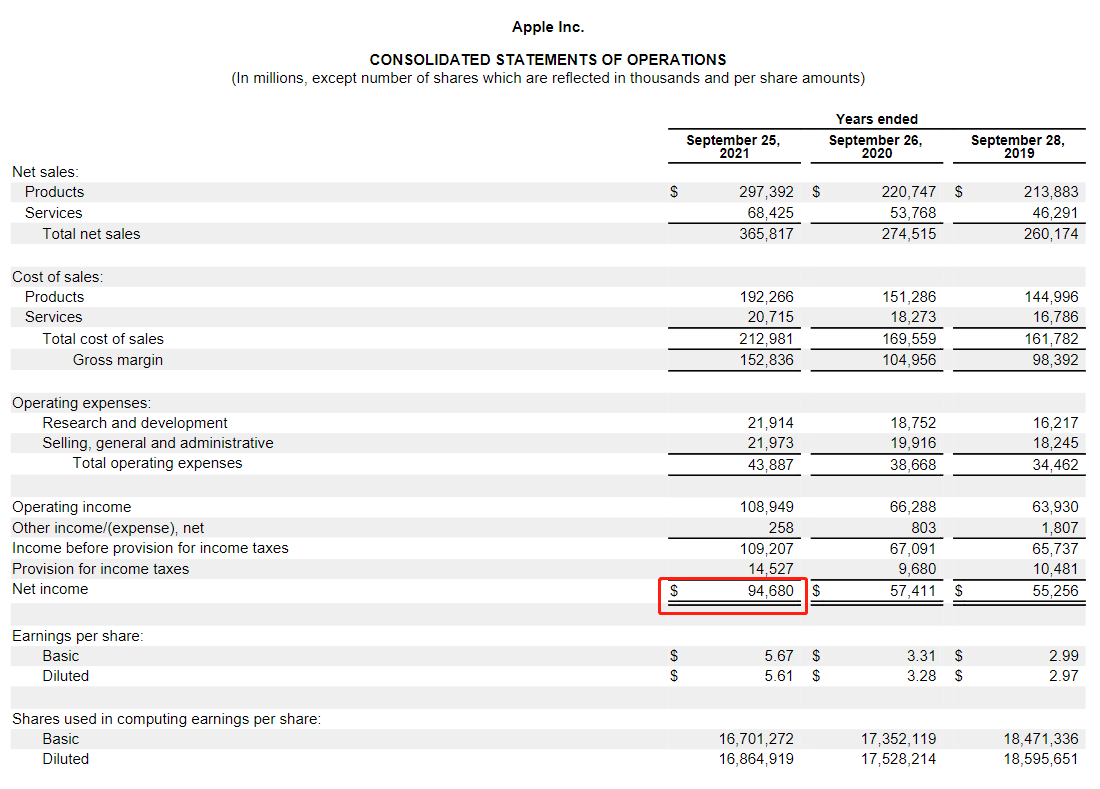
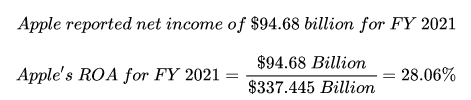
This means that for every dollar in assets during FY 2021, $Apple (null)$ generated 28.06 cents in profit.
This presentation is for informational and educational use only and is not a recommendation or endorsement of any particular investment or investment strategy. Investment information provided in this content is general in nature, strictly for illustrative purposes, and may not be appropriate for all investors. Read more
Recommend

What is the Equity Ratio?

What is a Stock Split?

What is a Golden Cross?

What is a 401(k)?
What is Net Worth?
What is Net Income?
What is Volume-Weighted Average Price (VWAP)?
What is Opportunity Cost?
What is the KDJ?
What is After-hour Trading?
What is a Delisting?
What is the OBV?
What is the Dead Cat Bounce?
What are Support and Resistance?
What is a block trade?
What is the PEG Ratio?
What is a Trailing Stop Limit Order?
What is Scalp Trading?
What is a Share Repurchase?
What is the rate of change?
What is Return on Equity (ROE)?
What is the Relative Strength Index (RSI)?
What are Bollinger Bands?
What is Free Cash Flow to Firm(FCFF)?
What is the Quick Ratio?
What is a Sunk Cost?
What is Momentum Trading?
What are the Safe-haven Assets?
What is Gross Margin?
What is Short Selling?
What is Book Value per Share (BVPS)?
What is the Risk/Reward Ratio?
What is Margin Trading?
What is Capitulation?
What is PE ratio?
What is the Short Squeeze?
What Is a Dividend?
What is Return on Assets (ROA)?
What is a SPAC?
What is the Current Ratio?
What is the Equity Ratio?
What is a Stock Split?
What is a Golden Cross?
What is a 401(k)?
What is Net Worth?
What is Net Income?
What is Volume-Weighted Average Price (VWAP)?
What is Opportunity Cost?
What is the KDJ?
What is After-hour Trading?
What is a Delisting?
What is the OBV?
What is the Dead Cat Bounce?
What are Support and Resistance?
What is a block trade?
What is the PEG Ratio?
What is a Trailing Stop Limit Order?
What is Scalp Trading?
What is a Share Repurchase?
What is the rate of change?
What is Return on Equity (ROE)?
What is the Relative Strength Index (RSI)?
What are Bollinger Bands?
What is Free Cash Flow to Firm(FCFF)?
What is the Quick Ratio?
What is a Sunk Cost?
What is Momentum Trading?
What are the Safe-haven Assets?
What is Gross Margin?
What is Short Selling?
What is Book Value per Share (BVPS)?
What is the Risk/Reward Ratio?
What is Margin Trading?
What is Capitulation?
What is PE ratio?
What is the Short Squeeze?
What Is a Dividend?
What is Return on Assets (ROA)?
What is a SPAC?
What is the Current Ratio?