What Is Bull Bear Ratio?
Investors Intelligence, a company that provides financial data, publishes a market-sentiment indicator called the bull/bear ratio every week. This indicator is also frequently referred to as the bull-bear spread. This leverages information gathered by surveys administered directly to industry experts. The information comes from investment advisers that aid people with their financial planning and investment portfolios. These advisors deal directly with the general investing public.
The Bull-Bear Ratio: What You Need to Know
The term "market sentiment" describes the general attitude of investors toward a particular security or financial market. The emotion or tone of a market or the crowd psychology is disclosed by the activity and price movement of the securities traded in that market. Another way to think of it is that it is the crowd's sentiment. Generally, a positive market mood is seen when the price increases, whereas an indication of negative market sentiment is seen when the price decreases.
The bull/bear index measures the collective feelings of financial advisers and planners involved daily in the market. It represents how well-informed professionals feel about the stock market as a whole and how they likely advise their customers to invest based on those emotions.
A weekly poll of financial advisers is compiled and published by Investors Intelligence. The survey asks the advisors whether they are optimistic, bearish, or neutral on the stock market. The percentage of financial advisers with a bullish outlook compared to those with a pessimistic outlook is referred to as the bull/bear ratio.
If the result is higher than "1.0," it implies that more financial advisers have an optimistic outlook on the market. Here, the term "bullish" refers to investor sentiment that shows a belief that the stock market will shortly increase. A value lower than "1.0" indicates that a more significant percentage of financial advisers are pessimistic and believe that the market will decline very shortly.
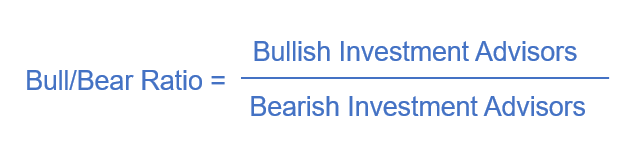
When looking for contrarian signs, extreme readings on the optimistic or bearish side of the market might be helpful.
Using the Bull/Bear Ratio
Investors Intelligence conducts weekly surveys with financial advisers to gather data for calculating the bull/bear ratio. The bull/bear ratio is an indicator that has been around for a long time that demonstrates how the opinions of market experts like financial advisers are evolving.
Financial advisers' attitudes will impact how they interact with their customers and may even cause them to alter the method in which they recommend that their clients invest, which in turn may affect the market's movement. The bull/bear ratio is a measure of the proportion of investment professionals in a particular market who are optimistic (that is, who believe that the market will go up) in comparison to the number who are pessimistic about the market's future (or expecting the market to fall).
Technical analysis with moomoo
Moomoo stock trading app provides powerful stock charting tools to meet various investors' technical analysis needs and help to make investing decisions. Moomoo stock charting tools consist of 63+ technical indicators, 38 types of charts, support for saving and synchronization of charts, and customized color patterns, etc. Sign up and download the moomoo app today to get access to these free charting tools!
This presentation is for informational and educational use only and is not a recommendation or endorsement of any particular investment or investment strategy. Investment information provided in this content is general in nature, strictly for illustrative purposes, and may not be appropriate for all investors. Read more
Recommend
What Is Commodity Channel Index?

What Is Technical Analysis of Stock Market?
What Is a Pivot Point in Stock Market

Top Trading Tools Traders Should Know
What Is the Price Channel Indicator
What Is Volume of Trade?
What Is a Harami Cross?
What Is the Rate of Change (ROC)?
What Is the Pattern of Inverted Hammer Candlesticks?
What Is the Price Percentage Oscillator?
What Is the Parabolic SAR Indicator?
What Is the Directional Divergence Index?
What Is the Ichimoku Kinko Hyo?
What Is the Average True Range (ATR)
What Is a Bearish Harami?
What Are the Three Black Crows?
What Is Turnover?
What Is a Morning Star?
What Is a Detrended Price Oscillator (DPO)?
What does Williams %R mean?
What Is a Three Outside Up and Down?
What Is a Shooting Star?
What Is an Evening Star?
What Is a Bullish Harami?
What Is Three Inside Up and Three Inside Down?
What Is Bullish and Bearish Breakaway Candlestick Pattern?
What Is a Detrended Price Oscillator?
What Is Keltner Channel?
What Is the Separating Lines Candlestick Pattern?
What Is a Hammer Candlestick?
What Is Bull Bear Ratio?
What is the Exponential Moving Average (EMA): Usage and Limitations
How Stock Charting Tools Can Help Investors in the Stock Market
What Is Bias Ratio?
What Does the Directional Movement Index (DMI) Indicate?
Everything About Stock Heatmaps That Investors Should Know
What Is an Oscillator
What Is a Doji?
What Is Parabolic Stop and Reverse (SAR)
Triple Exponential Average (TRIX): What Does That Mean?
What Is Three White Soldiers Candlestick Pattern?
What Is a Volume Moving Average (VMA)
What Is a Bullish Engulfing Pattern?
What Is a Psychological Line
What Is Commodity Channel Index?
What Is Technical Analysis of Stock Market?
What Is a Pivot Point in Stock Market
Top Trading Tools Traders Should Know
What Is the Price Channel Indicator
What Is Volume of Trade?
What Is a Harami Cross?
What Is the Rate of Change (ROC)?
What Is the Pattern of Inverted Hammer Candlesticks?
What Is the Price Percentage Oscillator?
What Is the Parabolic SAR Indicator?
What Is the Directional Divergence Index?
What Is the Ichimoku Kinko Hyo?
What Is the Average True Range (ATR)
What Is a Bearish Harami?
What Are the Three Black Crows?
What Is Turnover?
What Is a Morning Star?
What Is a Detrended Price Oscillator (DPO)?
What does Williams %R mean?
What Is a Three Outside Up and Down?
What Is a Shooting Star?
What Is an Evening Star?
What Is a Bullish Harami?
What Is Three Inside Up and Three Inside Down?
What Is Bullish and Bearish Breakaway Candlestick Pattern?
What Is a Detrended Price Oscillator?
What Is Keltner Channel?
What Is the Separating Lines Candlestick Pattern?
What Is a Hammer Candlestick?
What Is Bull Bear Ratio?
What is the Exponential Moving Average (EMA): Usage and Limitations
How Stock Charting Tools Can Help Investors in the Stock Market
What Is Bias Ratio?
What Does the Directional Movement Index (DMI) Indicate?
Everything About Stock Heatmaps That Investors Should Know
What Is an Oscillator
What Is a Doji?
What Is Parabolic Stop and Reverse (SAR)
Triple Exponential Average (TRIX): What Does That Mean?
What Is Three White Soldiers Candlestick Pattern?
What Is a Volume Moving Average (VMA)
What Is a Bullish Engulfing Pattern?
What Is a Psychological Line