What Is a Volume Moving Average (VMA)
One of the straightforward volume-based technical analysis is the Volume Moving Average. A VMA, analogous to a price-moving average, is the average volume of a security (stock), commodity, index, or exchange over a predetermined time frame. By filtering out short-term spikes and gaps, volume moving averages are employed in charts and technical analysis to smooth out and explain a volume trend.
Generally, a volume may be quite volatile, and you may notice spikes here and there due to specific massive deals ("games" of the significant institutional traders). You may reduce the impact of individual volume swings by using a moving average of volume method. As a result, it is now feasible to visually assess the overall direction of the volume. i.e., rising or falling. In addition, you will be provided with a numerical representation of the volume trend, which can be used in conjunction with many other indicators and trading systems.
There are several VMA types, just like the price analysis. A Simple Moving Average applied to the volume is one of the most popular VMAs. This is determined by taking the total number of bars and dividing that total by the total number of bars.
Simple VMA (n) = (sum of N volume bars) / N
One type of moving average is known as an exponential VMA, and it employs weighted elements to cut down on the latency that is inherent in a basic moving average. In addition to that, analysis makes extensive use of it.
The fundamental and straightforward instrument in analysis is a VMA. This criterion can stand on its own and being evaluated. At the same time, VMAs are used in the calculations of more complicated volume-based technical investigations. The formula for the Volume Oscillator, Percentage Volume Oscillator (PVO), and Market Volume Oscillator (MVO) all include a VMA. Indirectly, a moving average is used to volume in the accumulation/distribution, Oscillator Chaikin, Chaikin Money Flow (CMF), and On Balance Volume (OBV), among other things. As a result, VMA has the potential to be regarded as one of the most significant instruments that may be used in indications.
Monitoring changes in the direction of VMA is one of the fundamental methods of analysis. When the price of a security (stock, index, or other commodity) goes up, and we witness a huge rise in the VMA, it often suggests that the intensity of bullish (buying) traders is growing considerably.
In a similar manner, a spike in a VMA during a price decrease implies an increase in the number of traders who may be panicking and dumping their positions. As soon as the VMA begins to go down after being at a high level during the price drop, it may be an indication that the number of traders who are interested in selling has reached its maximum and that there may be a shift in both the sentiment and the trend direction.
Moomoo stock trading app provides investors with powerful stock charting tools to meet various investors' charting needs and help to make investing decisions. Moomoo stock charting tools consist of 63+ technical indicators, 38 types of charts, support for saving and synchronization of charts, and customized color patterns, etc. Download the moomoo app today to unlock these free charting tools!
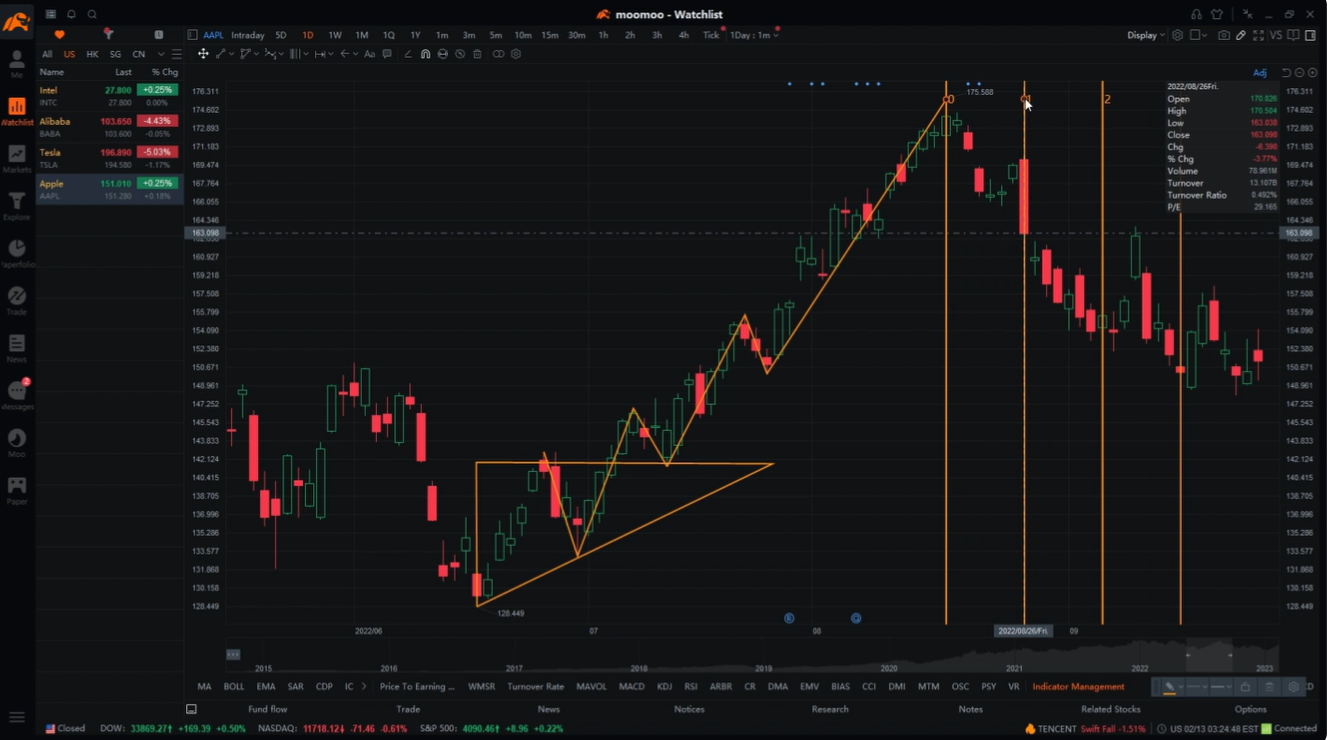
Images provided are not current and any securities are shown for illustrative purposes only.
Frequency Asked Questions
This presentation is for informational and educational use only and is not a recommendation or endorsement of any particular investment or investment strategy. Investment information provided in this content is general in nature, strictly for illustrative purposes, and may not be appropriate for all investors. Read more
Recommend
What Is Commodity Channel Index?
What Is Technical Analysis of Stock Market?
What Is a Pivot Point in Stock Market

Top Trading Tools Traders Should Know
What Is the Price Channel Indicator
What Is Volume of Trade?
What Is a Harami Cross?
What Is the Rate of Change (ROC)?
What Is the Pattern of Inverted Hammer Candlesticks?
What Is the Price Percentage Oscillator?
What Is the Parabolic SAR Indicator?
What Is the Directional Divergence Index?
What Is the Ichimoku Kinko Hyo?
What Is the Average True Range (ATR)
What Is a Bearish Harami?
What Are the Three Black Crows?
What Is Turnover?
What Is a Morning Star?
What Is a Detrended Price Oscillator (DPO)?
What does Williams %R mean?
What Is a Three Outside Up and Down?
What Is a Shooting Star?
What Is an Evening Star?
What Is a Bullish Harami?
What Is Three Inside Up and Three Inside Down?
What Is Bullish and Bearish Breakaway Candlestick Pattern?
What Is a Detrended Price Oscillator?
What Is Keltner Channel?
What Is the Separating Lines Candlestick Pattern?
What Is a Hammer Candlestick?
What Is Bull Bear Ratio?
What is the Exponential Moving Average (EMA): Usage and Limitations
How Stock Charting Tools Can Help Investors in the Stock Market
What Is Bias Ratio?
What Does the Directional Movement Index (DMI) Indicate?
Everything About Stock Heatmaps That Investors Should Know
What Is an Oscillator
What Is a Doji?
What Is Parabolic Stop and Reverse (SAR)
Triple Exponential Average (TRIX): What Does That Mean?
What Is Three White Soldiers Candlestick Pattern?
What Is a Volume Moving Average (VMA)
What Is a Bullish Engulfing Pattern?
What Is a Psychological Line
What Is Commodity Channel Index?
What Is Technical Analysis of Stock Market?
What Is a Pivot Point in Stock Market
Top Trading Tools Traders Should Know
What Is the Price Channel Indicator
What Is Volume of Trade?
What Is a Harami Cross?
What Is the Rate of Change (ROC)?
What Is the Pattern of Inverted Hammer Candlesticks?
What Is the Price Percentage Oscillator?
What Is the Parabolic SAR Indicator?
What Is the Directional Divergence Index?
What Is the Ichimoku Kinko Hyo?
What Is the Average True Range (ATR)
What Is a Bearish Harami?
What Are the Three Black Crows?
What Is Turnover?
What Is a Morning Star?
What Is a Detrended Price Oscillator (DPO)?
What does Williams %R mean?
What Is a Three Outside Up and Down?
What Is a Shooting Star?
What Is an Evening Star?
What Is a Bullish Harami?
What Is Three Inside Up and Three Inside Down?
What Is Bullish and Bearish Breakaway Candlestick Pattern?
What Is a Detrended Price Oscillator?
What Is Keltner Channel?
What Is the Separating Lines Candlestick Pattern?
What Is a Hammer Candlestick?
What Is Bull Bear Ratio?
What is the Exponential Moving Average (EMA): Usage and Limitations
How Stock Charting Tools Can Help Investors in the Stock Market
What Is Bias Ratio?
What Does the Directional Movement Index (DMI) Indicate?
Everything About Stock Heatmaps That Investors Should Know
What Is an Oscillator
What Is a Doji?
What Is Parabolic Stop and Reverse (SAR)
Triple Exponential Average (TRIX): What Does That Mean?
What Is Three White Soldiers Candlestick Pattern?
What Is a Volume Moving Average (VMA)
What Is a Bullish Engulfing Pattern?
What Is a Psychological Line