What Is a Bearish Harami?
A bearish harami is a two-bar Japanese candlestick pattern indicating that prices may shortly reverse downwards. The pattern contains a long white candle and a small black candle. The body of the first candle must include both the opening and closing prices of the second candle. A bearish harami first forms after an uptrend.
It can be better understood with a bullish harami, which is opposite to it.
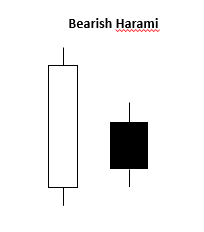
Understanding Bearish Harami
The second candle's size defines how powerful the pattern is; the smaller it is, the more likely a reversal is to occur. A bullish harami indicates that prices may reverse to the upside, is the opposite pattern to a bearish harami.
A bearish harami is frequently used in conjunction with other technical indicators by traders to enhance its potency as a trading signal. When a bearish harami emerges during a retracement, a trader may utilize the 200-day moving average to confirm that the market is in a long-term decline.
Technical analysis with moomoo
Moomoo stock trading app provides free advanced stock charting tools to help various investors to analyze trends and patterns with 60+ technical indicators and add visuals to charts using 38+ drawing tools. Sign up and download the moomoo app today to access these charting tools!
This presentation is for informational and educational use only and is not a recommendation or endorsement of any particular investment or investment strategy. Investment information provided in this content is general in nature, strictly for illustrative purposes, and may not be appropriate for all investors. Read more
Recommend
What Is Commodity Channel Index?

What Is Technical Analysis of Stock Market?

What Is a Pivot Point in Stock Market

Top Trading Tools Traders Should Know
What Is the Price Channel Indicator
What Is Volume of Trade?
What Is a Harami Cross?
What Is the Rate of Change (ROC)?
What Is the Pattern of Inverted Hammer Candlesticks?
What Is the Price Percentage Oscillator?
What Is the Parabolic SAR Indicator?
What Is the Directional Divergence Index?
What Is the Ichimoku Kinko Hyo?
What Is the Average True Range (ATR)
What Is a Bearish Harami?
What Are the Three Black Crows?
What Is Turnover?
What Is a Morning Star?
What Is a Detrended Price Oscillator (DPO)?
What does Williams %R mean?
What Is a Three Outside Up and Down?
What Is a Shooting Star?
What Is an Evening Star?
What Is a Bullish Harami?
What Is Three Inside Up and Three Inside Down?
What Is Bullish and Bearish Breakaway Candlestick Pattern?
What Is a Detrended Price Oscillator?
What Is Keltner Channel?
What Is the Separating Lines Candlestick Pattern?
What Is a Hammer Candlestick?
What Is Bull Bear Ratio?
What is the Exponential Moving Average (EMA): Usage and Limitations
How Stock Charting Tools Can Help Investors in the Stock Market
What Is Bias Ratio?
What Does the Directional Movement Index (DMI) Indicate?
Everything About Stock Heatmaps That Investors Should Know
What Is an Oscillator
What Is a Doji?
What Is Parabolic Stop and Reverse (SAR)
Triple Exponential Average (TRIX): What Does That Mean?
What Is Three White Soldiers Candlestick Pattern?
What Is a Volume Moving Average (VMA)
What Is a Bullish Engulfing Pattern?
What Is a Psychological Line
What Is Commodity Channel Index?
What Is Technical Analysis of Stock Market?
What Is a Pivot Point in Stock Market
Top Trading Tools Traders Should Know
What Is the Price Channel Indicator
What Is Volume of Trade?
What Is a Harami Cross?
What Is the Rate of Change (ROC)?
What Is the Pattern of Inverted Hammer Candlesticks?
What Is the Price Percentage Oscillator?
What Is the Parabolic SAR Indicator?
What Is the Directional Divergence Index?
What Is the Ichimoku Kinko Hyo?
What Is the Average True Range (ATR)
What Is a Bearish Harami?
What Are the Three Black Crows?
What Is Turnover?
What Is a Morning Star?
What Is a Detrended Price Oscillator (DPO)?
What does Williams %R mean?
What Is a Three Outside Up and Down?
What Is a Shooting Star?
What Is an Evening Star?
What Is a Bullish Harami?
What Is Three Inside Up and Three Inside Down?
What Is Bullish and Bearish Breakaway Candlestick Pattern?
What Is a Detrended Price Oscillator?
What Is Keltner Channel?
What Is the Separating Lines Candlestick Pattern?
What Is a Hammer Candlestick?
What Is Bull Bear Ratio?
What is the Exponential Moving Average (EMA): Usage and Limitations
How Stock Charting Tools Can Help Investors in the Stock Market
What Is Bias Ratio?
What Does the Directional Movement Index (DMI) Indicate?
Everything About Stock Heatmaps That Investors Should Know
What Is an Oscillator
What Is a Doji?
What Is Parabolic Stop and Reverse (SAR)
Triple Exponential Average (TRIX): What Does That Mean?
What Is Three White Soldiers Candlestick Pattern?
What Is a Volume Moving Average (VMA)
What Is a Bullish Engulfing Pattern?
What Is a Psychological Line